How do you view cycles and drawdowns?
If you have been in the Crypto market for a long time and have experienced extreme stress tests like "9·4", "3·12", "5·19", and the latest "10·11", you might conclude a hard rule: every crisis and drawdown often marks the starting point for a cycle restart.
Although the time scale of Crypto is still too short and the volatility is more intense, if you compare it with the two giants, the US stock market and the A-share market, you will find a commonality in the market—from the peak of the bubble, to violent liquidation, and then to differentiated recovery, the script of the cycle is always repeating.
The past four years serve as the best example. In October 2021, global assets began to retreat from their peaks, and gradually recovered in the AI wave and new interest rate cycle from 2023 to 2025. Today, the US stock market and Crypto have reached new highs again, while the A-share market is hovering on the threshold of recovery.
It can be said that these four years have been a pressure test concerning global capital flows, risk pricing, and market psychology. Today, we will attempt to delve into this vivid "market cycle lesson" from the perspective of "drawdowns."
1. Cross-Market Cycle Lesson: Drawdowns Are Never a Distant Story
"In the long run, we are all dead." — Keynes.
But in the capital market, what everyone is most obsessed with is still the long-term macro narrative: cycles.
Taking the Crypto market as an example, over the past decade, Bitcoin has almost formed a widely recognized "four-year cycle" pattern, including about three years of upward trends, followed by approximately one year of adjustments and liquidations, and then the next cycle begins. So far, this cycle has been fully played out four times.
However, from Q4 2021 to Q4 2025, we have witnessed a broader and more profound resonance of macro liquidity and risk assets. This time, whether it is the emerging Crypto or the mature US and A-share markets, they have all been inevitably swept into it, with a path so clear that it can be considered a textbook example of the "prosperity peak - drawdown liquidation - differentiated recovery" cycle:
- Q4 2021: The last carnival of global liquidity flooding, Bitcoin, Nasdaq, and S&P 500 (Q1 2022) successively reached historical highs, while the A-share market was also at the tail end of a collective rally;
- 2022-2023: The fastest interest rate hike cycle in the history of the Federal Reserve led to a sudden tightening of dollar liquidity, and risk assets were not spared, the US stock market, Crypto, and A-shares experienced a brutal wave of liquidation;
- 2023-2025: Inflation peaked, AI concepts rose, and interest rate cut expectations reignited, different markets began to emerge with completely different recovery curves according to their underlying logic;
Therefore, the complete cycle experienced by the global market from 2021 to 2025 is the most suitable for retrospective comparison, raising a core question: when a macro tsunami strikes, all boats will sink, but why can some assets quickly rise and reach new highs while others remain submerged, struggling on the edge of recovery?
Ultimately, drawdowns are the true face of asset risk, pointing directly to the real quality of the supporting system behind the assets. After all, investment cannot only focus on returns; one must also ask—"Can you endure it?"
The long-term fate of the market is often determined by the recovery after drawdowns, which is where the real story of each cycle begins.
2. 21-25, A Complete "Three-Market Resonance" Cycle
If one were to choose a time frame to summarize the true fate of global assets over the past four years, Q4 2021 to Q4 2025 would undoubtedly be the ideal sample.
This is not a typical bull-bear transition but a rare "three-market resonance cycle": global liquidity shifted from extreme easing to rapid tightening and then returned to stability. In this intense macro variation, both the emerging Crypto and the mature US and A-share markets experienced a complete three-act play of "prosperity → liquidation → recovery."
This provides us with a perfect laboratory to observe the true performance of different assets in the same storm.
1. Q4 2021: The Peak of the Bubble
First, 2021 marked the final chapter of the global liquidity frenzy spurred by the pandemic, with overflowing cheap funds pushing the valuations of risk assets to unprecedented heights.
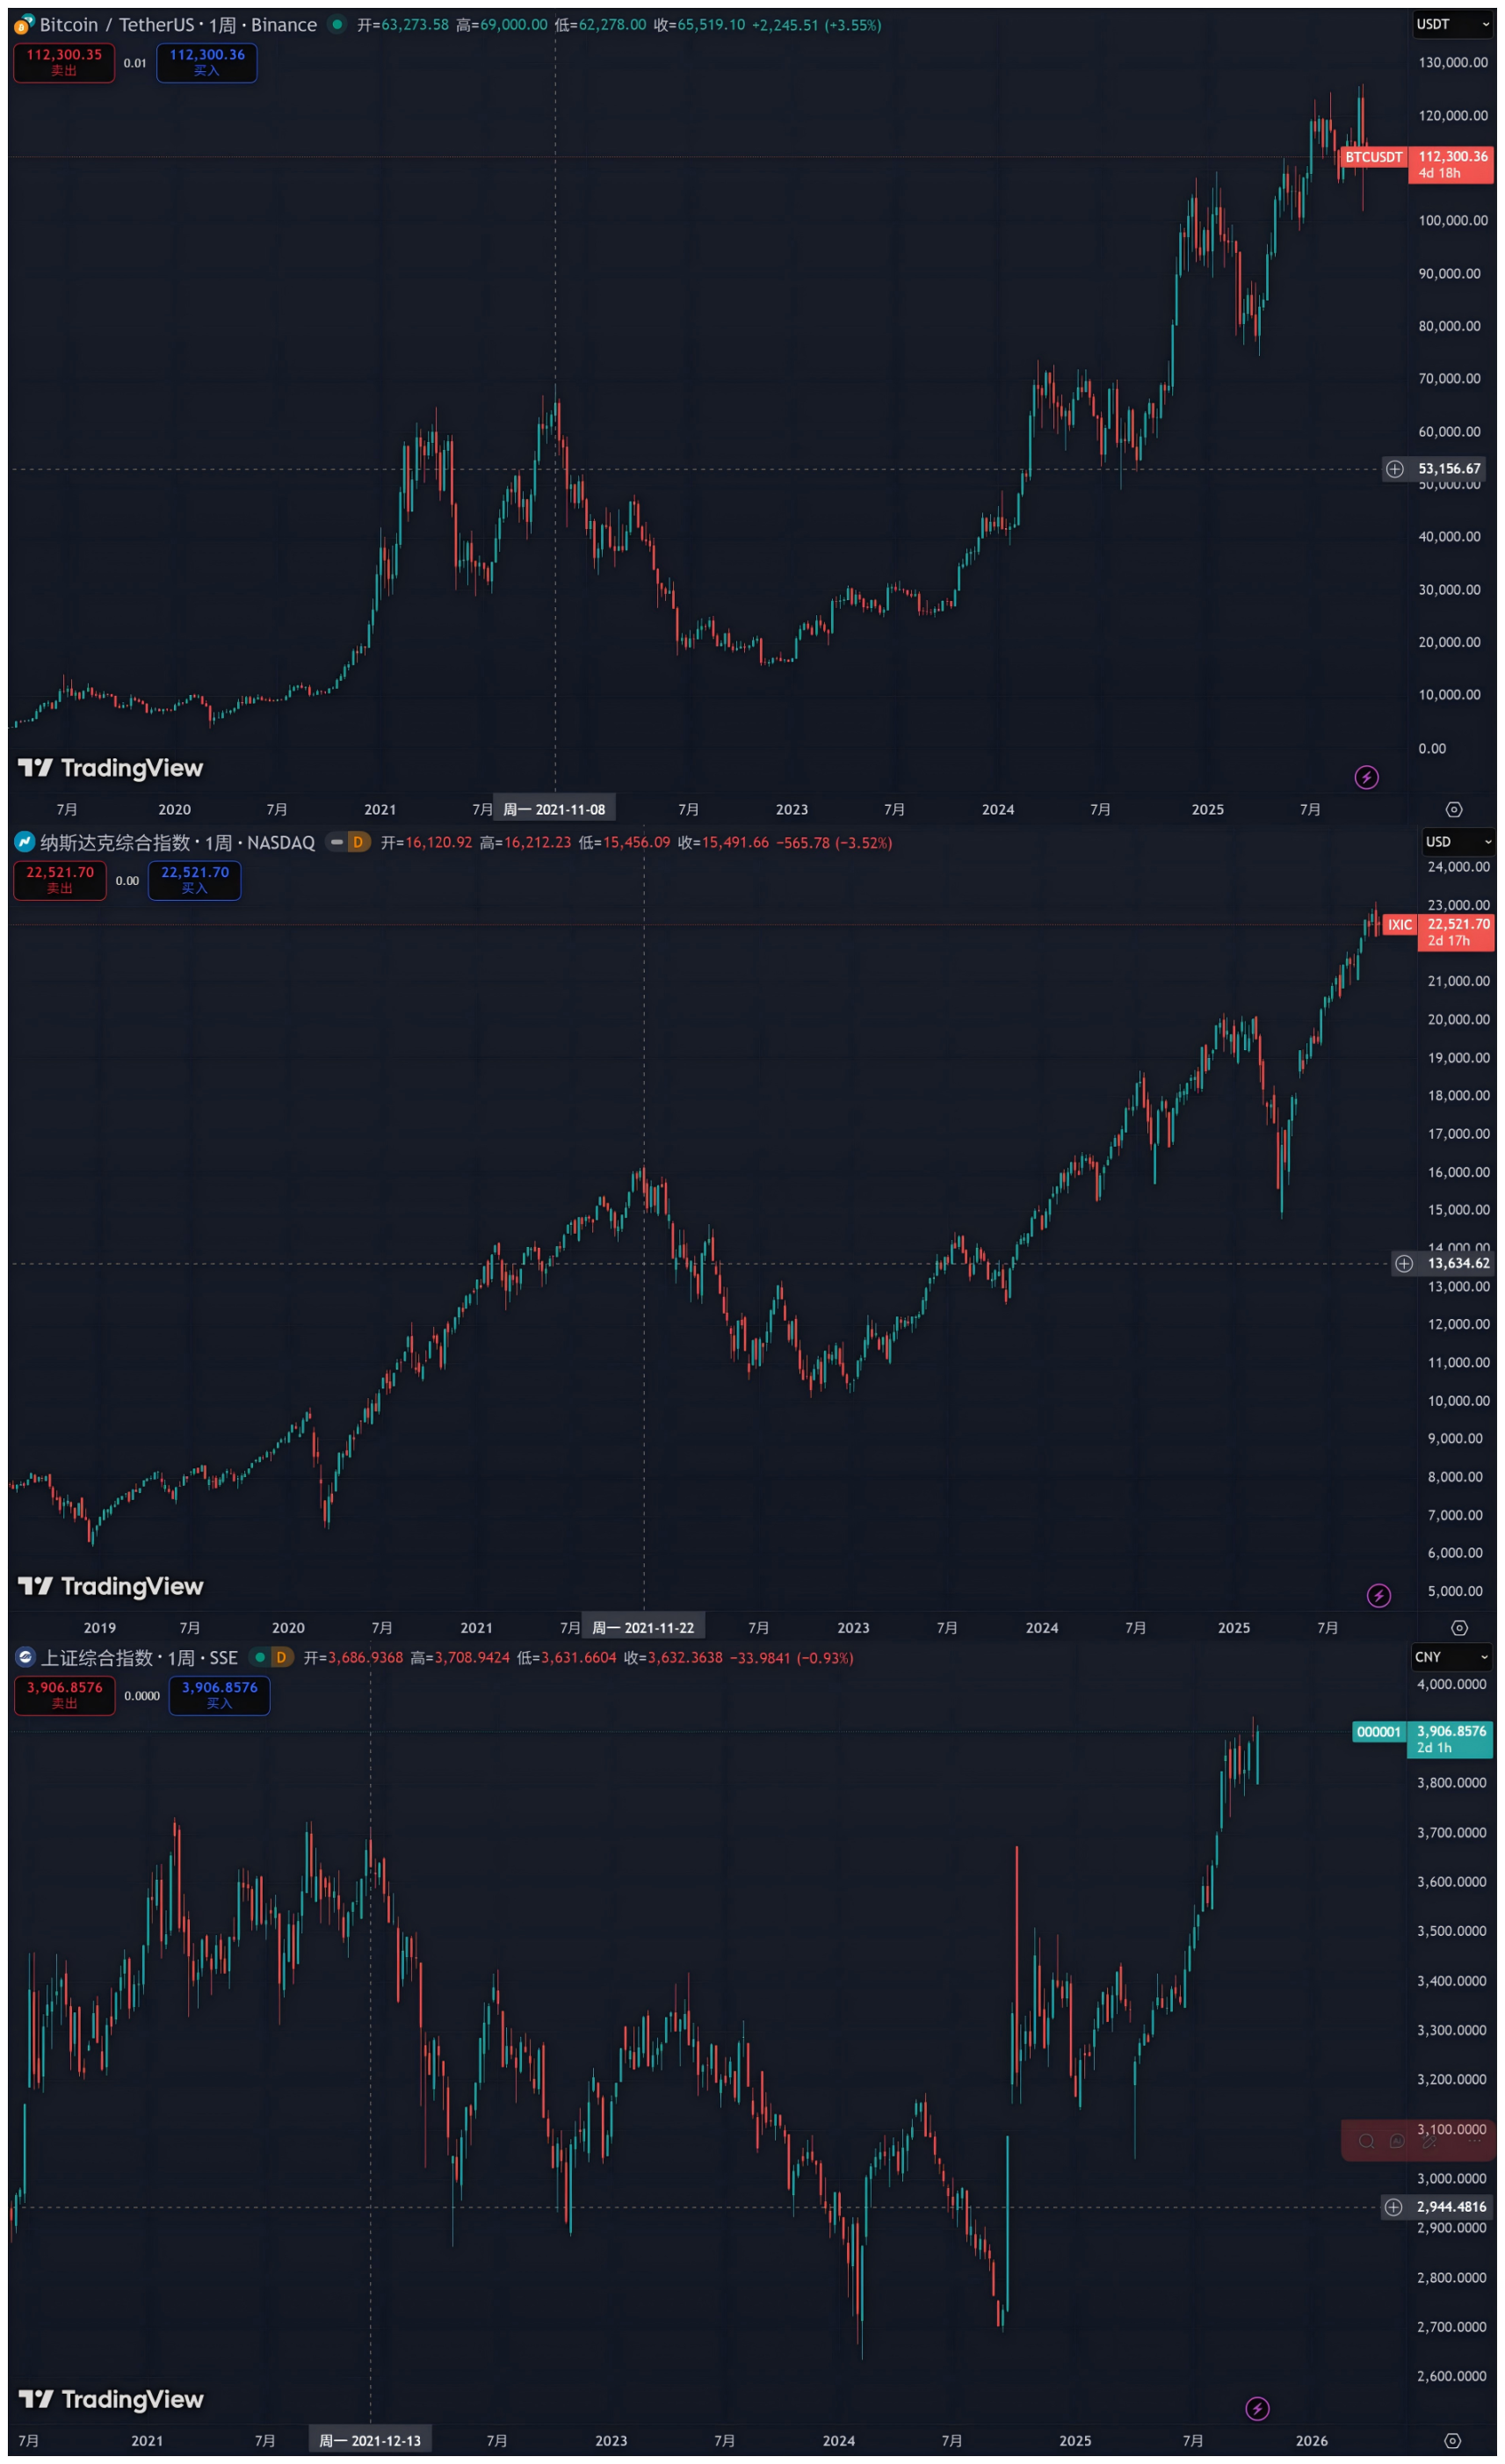
The most direct signal was the US stock market reaching historical highs from the end of 2021 to the beginning of 2022, where the Nasdaq index broke through 16,200 points on November 22, 2021, and subsequently, the S&P 500 index surged to 4,818 points on January 4 of the following year, with high valuations and a bubble in the tech sector becoming the market's main theme.
Interestingly, Crypto resonated almost synchronously with the Nasdaq, reaching its peak moment—Bitcoin hit a maximum of $69,000 on November 10, 2021 (Binance spot data, same below), and Ethereum also set a historical high of $4,868 on the same day, with the wealth myths of NFTs and DeFi virally spreading on social media, attracting the last batch of latecomers.
For the A-share market, although the CSI 300 index did not simultaneously reach a historical high (its peak was in early 2021), driven by structural trends like "carbon neutrality," "new energy," and "core assets in liquor," the market still maintained a local frenzy at high levels of 3,500 - 3,700 points.
2. 2022-2023: Violent Liquidation
However, the end of the feast was swifter and more violent than anyone expected. Faced with inflation not seen in 40 years, the Federal Reserve initiated the fastest interest rate hike cycle in history, leading to a sudden depletion of global market liquidity, with risk assets being no exception.
Especially for the Crypto market, 2022 was a devastating "black swan year": from the death spiral of Terra/LUNA to the bankruptcy liquidation of Three Arrows Capital, and then to the collapse of FTX, liquidity, confidence, and valuations collapsed almost simultaneously, creating a perfect "Davis double whammy" of internal leverage liquidation and macro liquidity depletion.
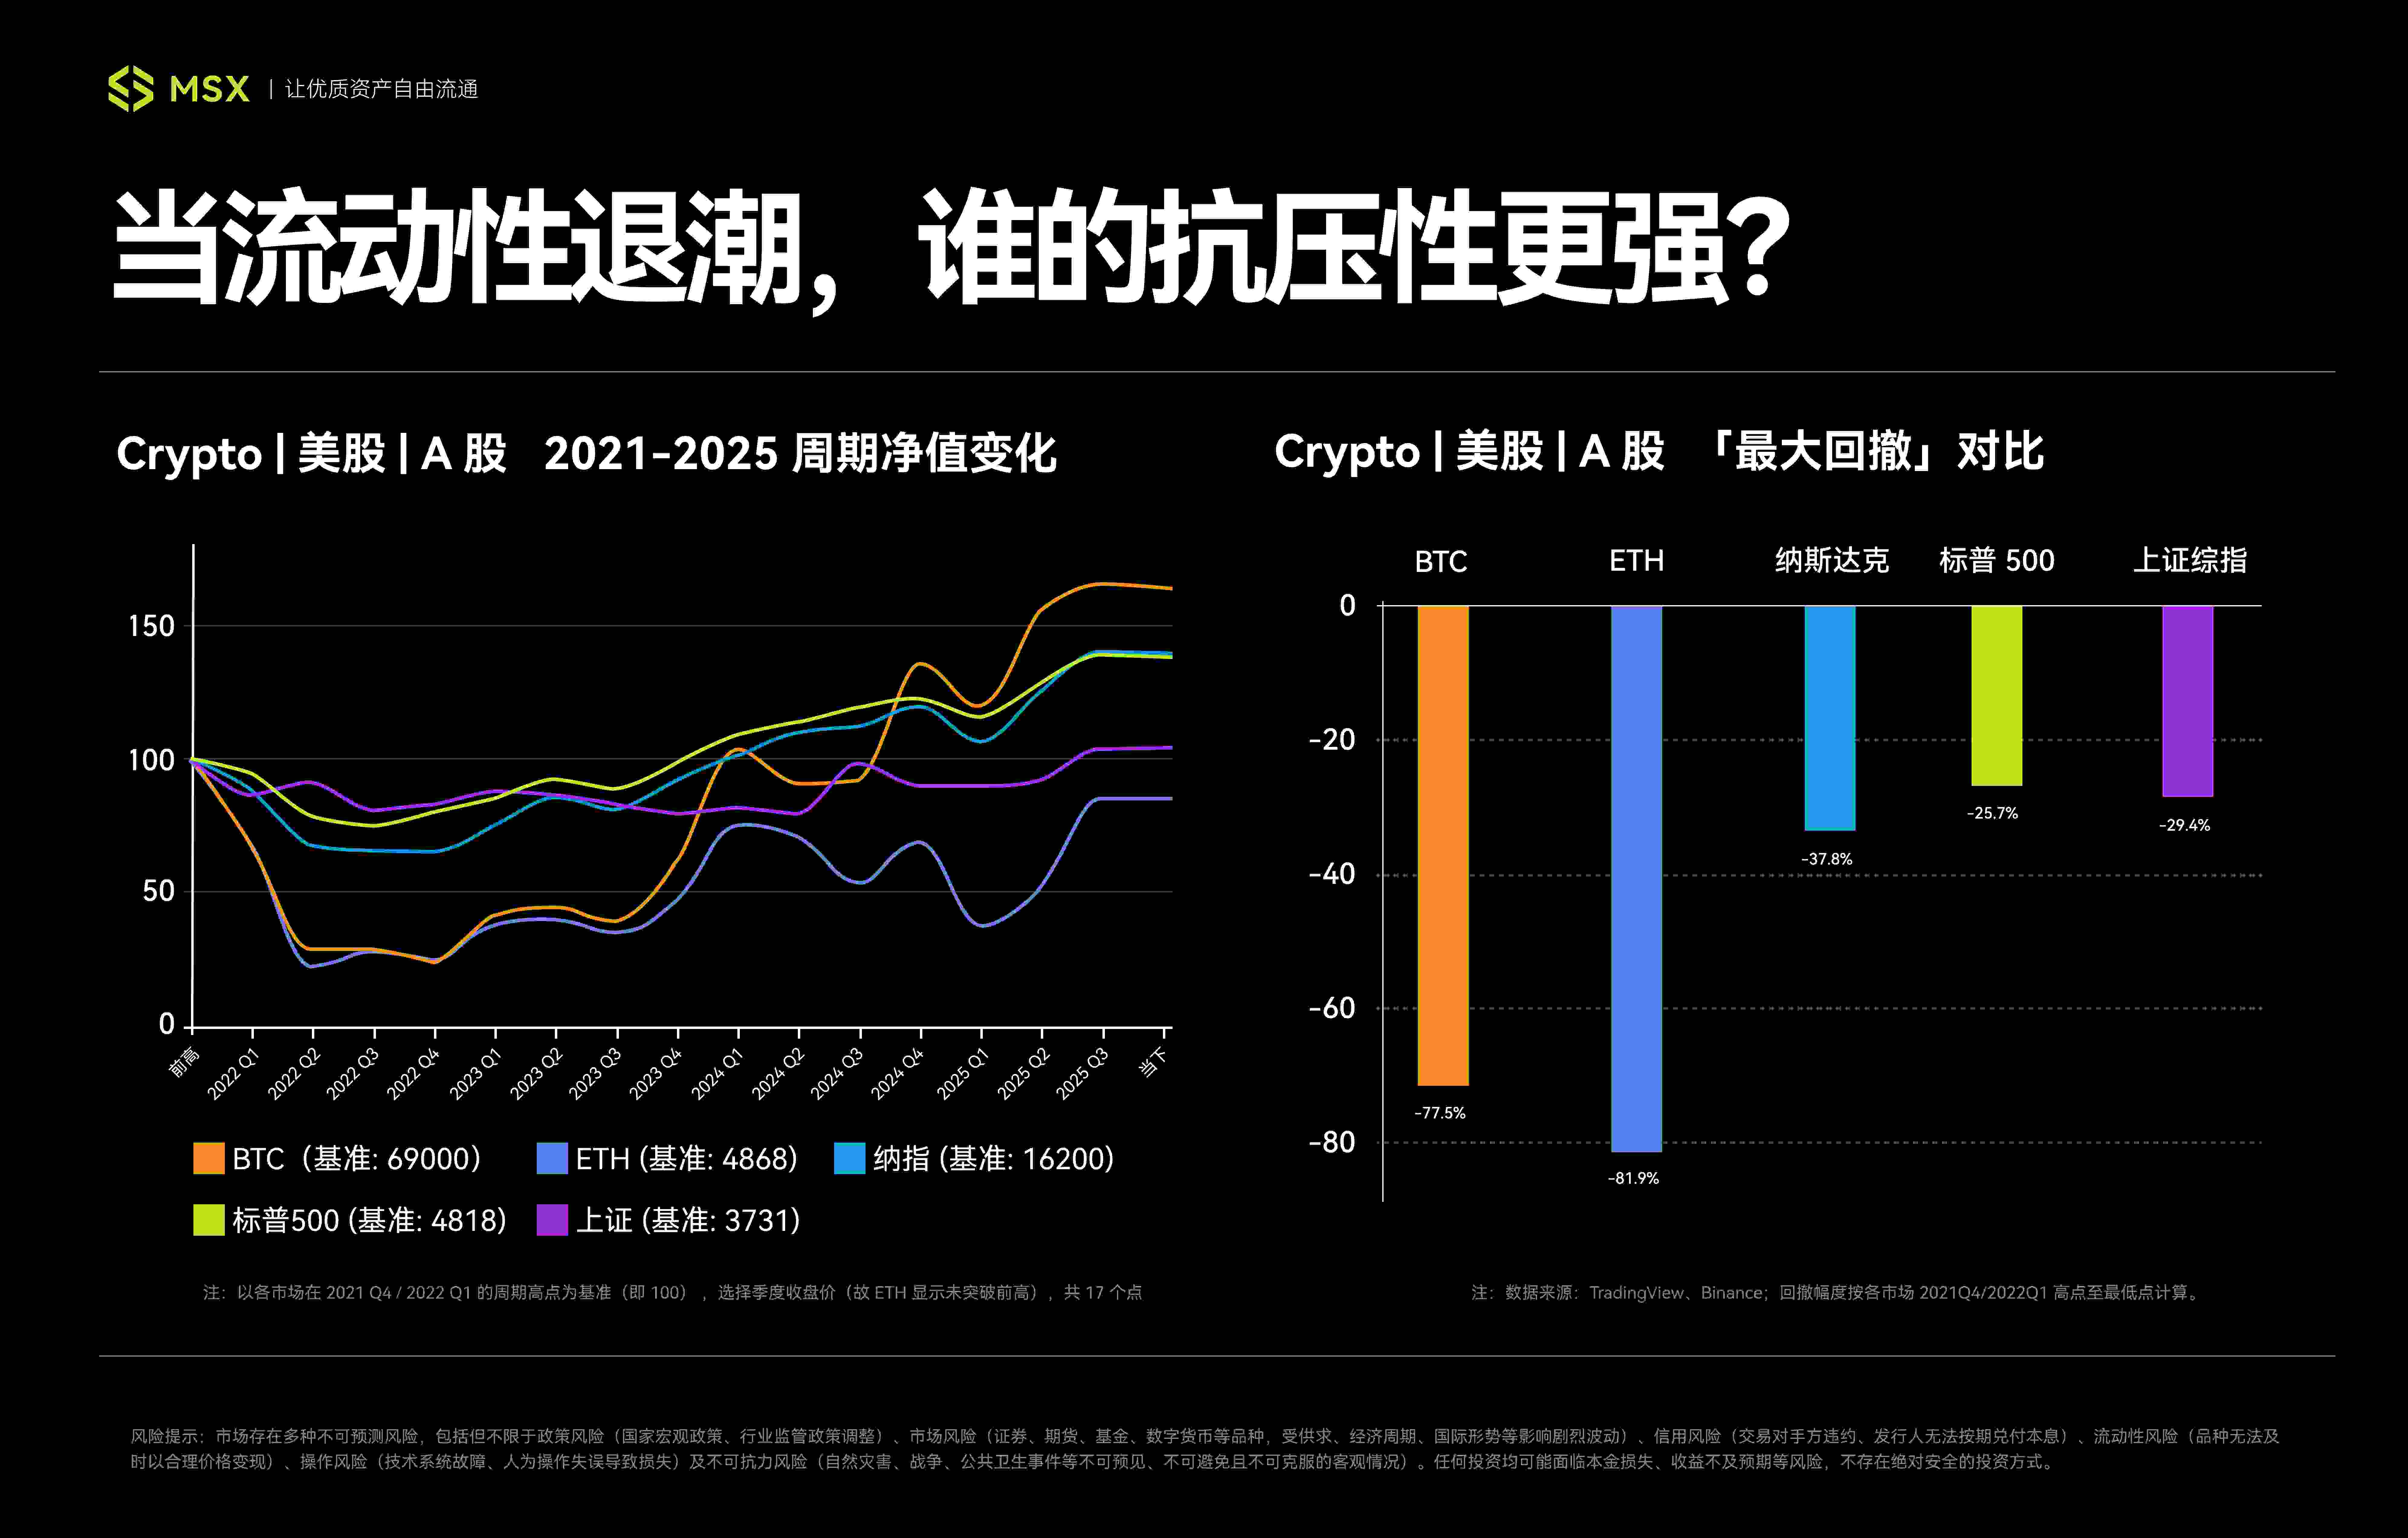
Bitcoin experienced a snowball effect, hitting a cycle low of $15,476 on November 21, 2022, while Ethereum reached its cycle bottom slightly earlier at $881 on June 18, with a maximum drawdown of 77.5% for BTC and 82% for ETH from their peaks, which is truly devastating.
As the pricing anchor for global assets, the drawdown of the US stock market was comparatively more orderly, with its decline logic clearly revolving around "anti-inflation" and "tightening expectations," where the S&P 500 index bottomed out at 3,491 points (intraday) on October 13, 2022, with a maximum drawdown of about -27.5%, and the Nasdaq also hit a low of 10,088 points (intraday) on the same day, with a maximum drawdown of about 38%.
Although the absolute decline was far smaller than that of Crypto, considering its massive scale, the evaporated market value was also astronomical, officially declaring the global entry into a technical bear market.
The decline process of the A-share market was more complex, resulting from the combination of "global tightening" and "domestic factors." Over a span of two years, the market underwent repeated bottom-testing processes, with the Shanghai Composite Index touching around 2,860 points multiple times in April and October 2022, and even setting a new cycle low of 2,635 points on February 5, 2024.
From the absolute peak of 3,731 points on February 18, 2021, the maximum drawdown of the Shanghai Composite Index was nearly 30%, though the depth was similar to that of the US stock market, the recovery process was extremely lengthy, posing an ultimate test of confidence and patience for investors.
3. 2023-2025: Differentiated Recovery
As we entered 2023, with global inflation peaking and the interest rate hike cycle nearing its end, the market began to brew recovery, especially as the AI boom ignited the US stock market and ETF expectations boosted Crypto. This round of recovery began to diverge rather than synchronize.
First was the recovery of the US stock market, undoubtedly driven by the AI narrative as the new growth engine—tech giants like Nvidia surged ahead, and the explosive earnings of tech giants became a booster, leading the Nasdaq and S&P 500 to emerge from the mire first.
The S&P 500 officially regained lost ground on January 19, 2024, followed by the Nasdaq Composite Index recovering on March 1, 2024, both reaching historical highs. As of October 14, 2025 (closing), the S&P 500 closed at 6,644 points, and the Nasdaq closed at 22,521 points, representing increases of 38% and 39% respectively compared to the previous cycle peaks in 2021/2022.
Crypto, on the other hand, attracted mainstream capital's attention again with the internal risk clearance in the industry and the approval of Bitcoin spot ETFs, a "compliance" milestone event. BTC prices experienced a V-shaped reversal, breaking through the 2021 highs, reaching $126,199, an increase of nearly 83% compared to the historical peak, while ETH also set a new historical high of $4,956 in August this year.
However, altcoins experienced a stark contrast; apart from leading public chains like Solana, Sui, and TON benefiting from ecological revival or narrative dividends, entering a local bull market, the vast majority nearly perished in the environment of liquidity contraction, with the altcoin market gradually differentiating into "mainstream asset pools" and "speculative islands."
The recovery path for the A-share market appeared particularly tortuous. Despite frequent policy tailwinds, market confidence recovered slowly, with the Shanghai Composite Index lingering at low levels for a long time, forming a stark contrast with the performance of major global markets, only officially surpassing 3,800 points in August, beginning its arduous recovery journey.
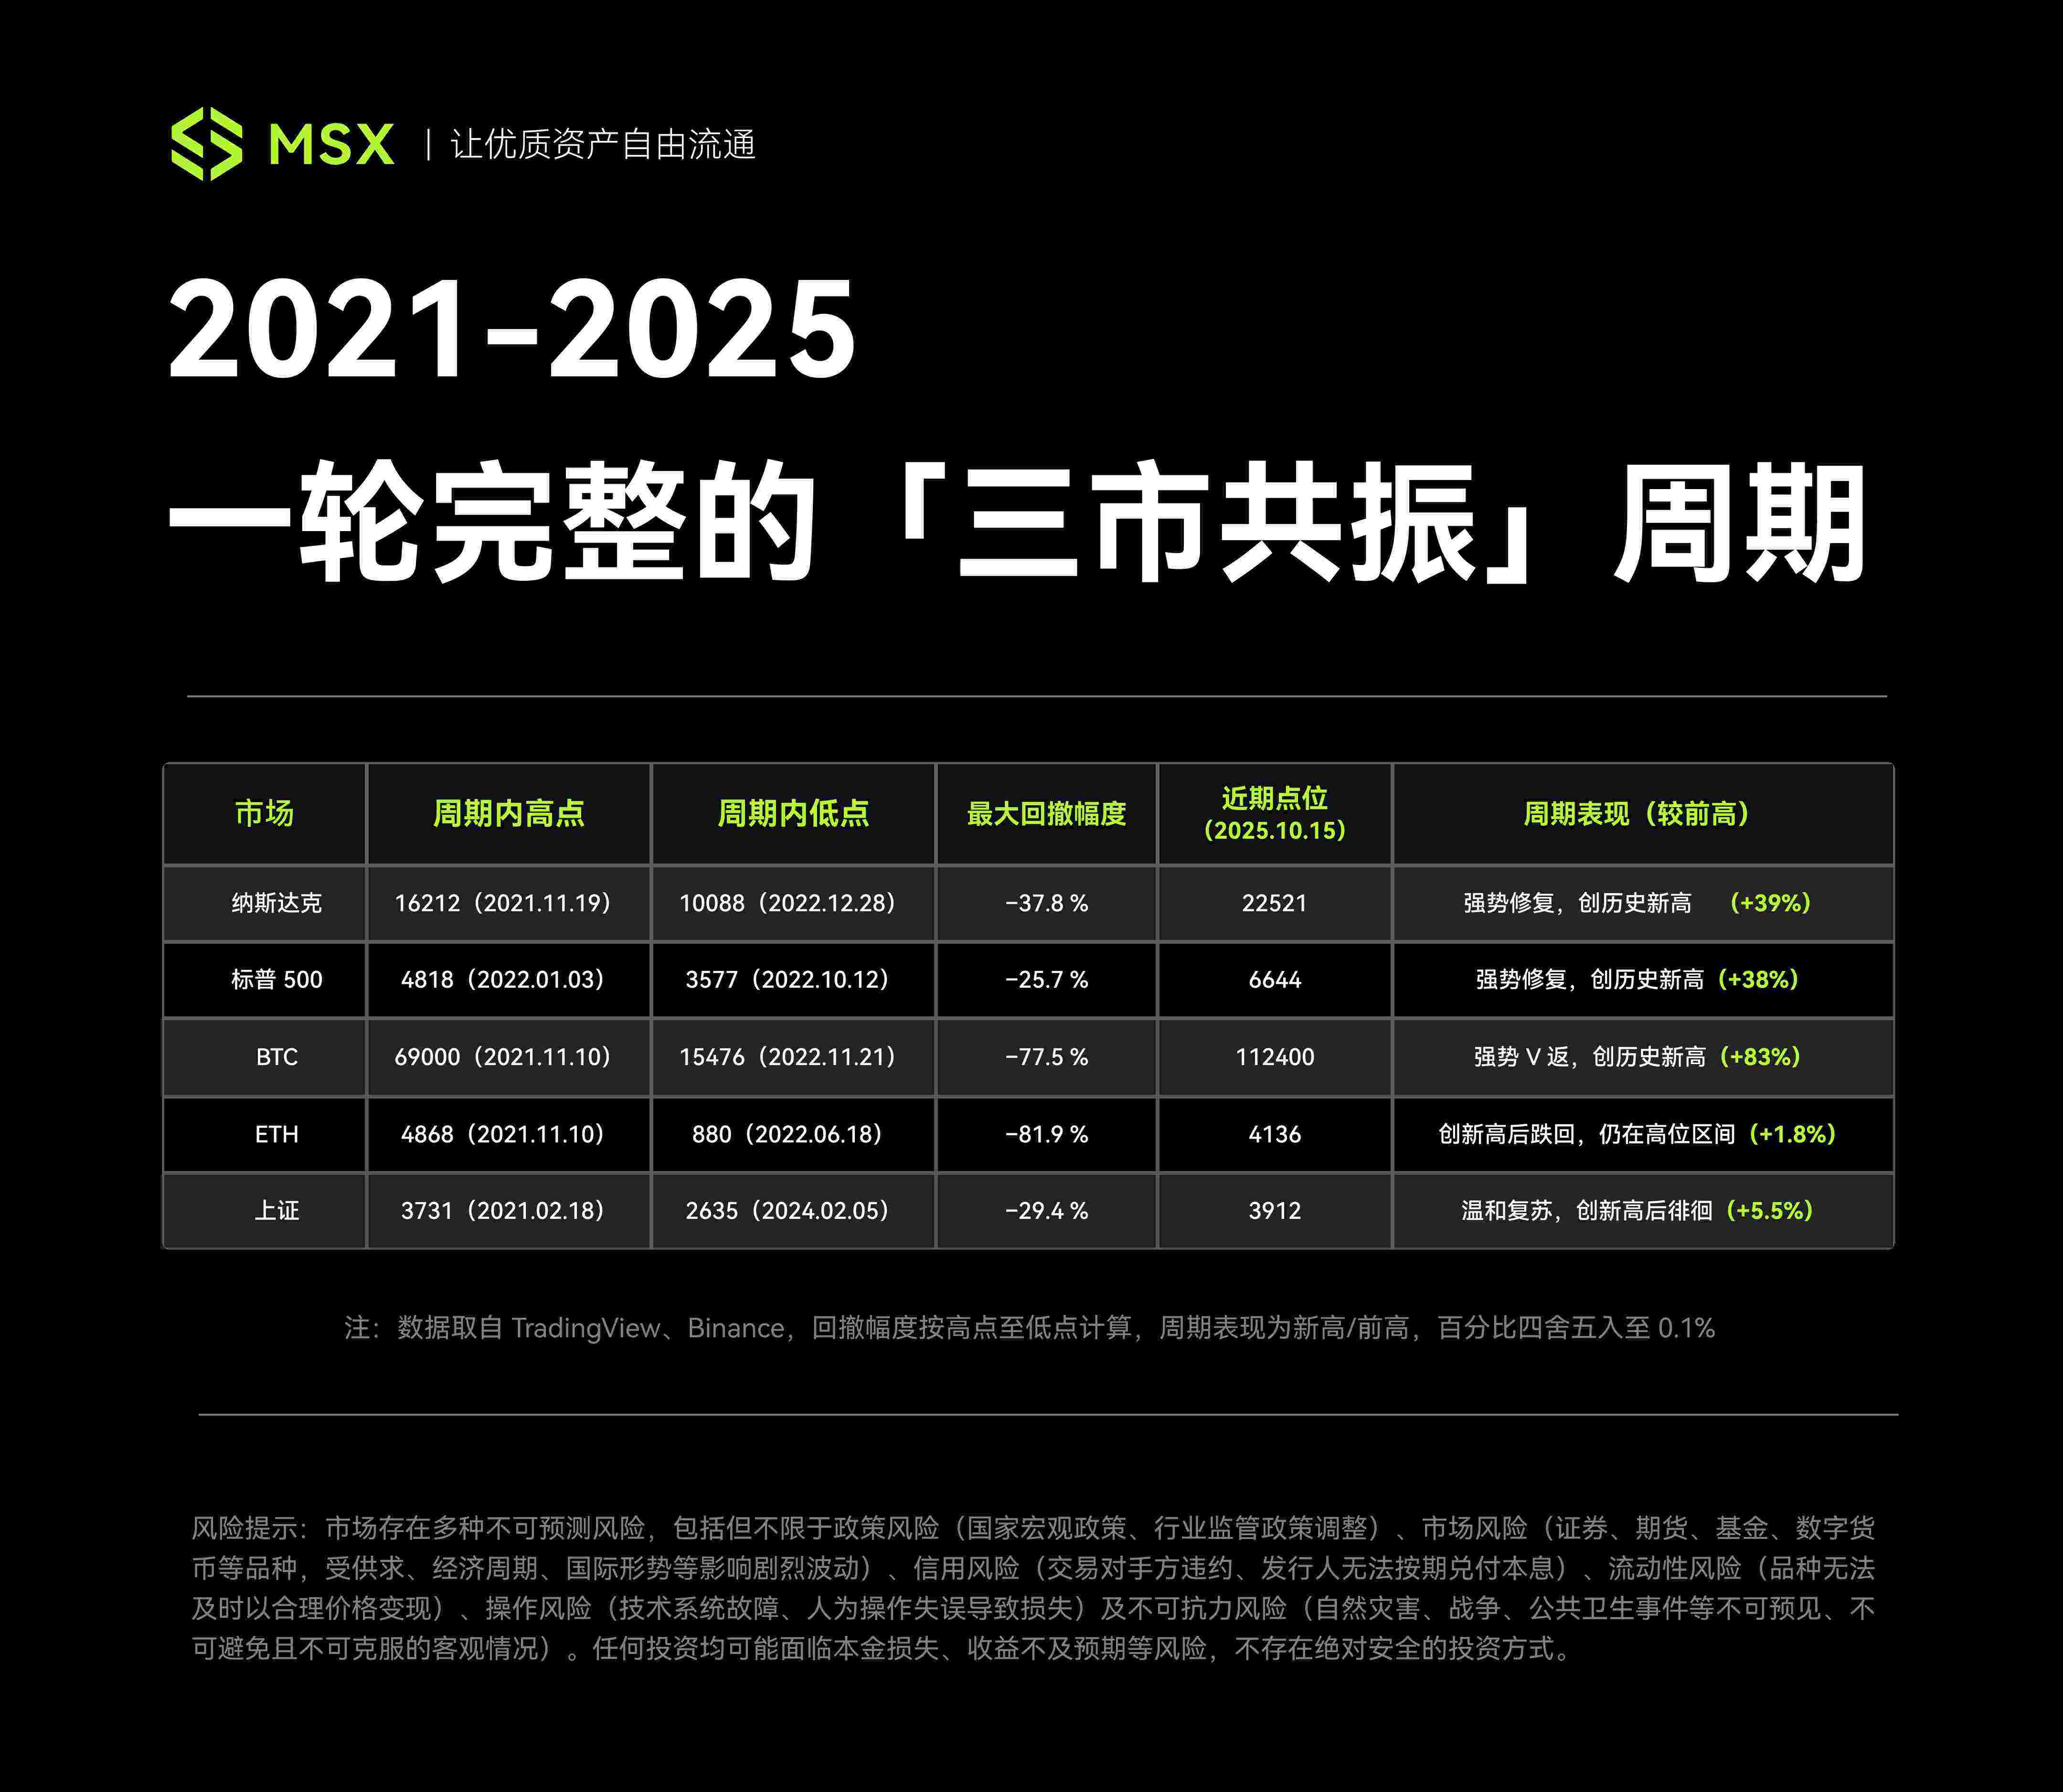 Note: Data sourced from TradingView and Binance, drawdown magnitudes calculated from peak to trough, cycle performance as new high / previous high, percentages rounded to 0.1%.
It is worth noting that although the highest point of the A-share market occurred in February 2021, earlier than the starting point we defined for the cycle (October 2021), based on the "triple top" structure and from the perspective of drawdown calculation, this article still starts from that absolute high point, which better reflects its complete downward cycle.
Thus, a complete cycle has been completed, and the three major markets, after experiencing similar macro shocks, have delivered distinctly different answers.
3. Cross-Market Comparison: Who Can Withstand Cyclical Drawdowns?
Overall, the drawdowns in the three major markets—US stocks, Crypto, and A-shares—share a clear commonality, which is their strong correlation with the dollar liquidity cycle. For instance, all three peaked around Q4 2021 and resonated to the bottom around Q4 2022, indicating that the dollar liquidity cycle remains the "master valve" hanging over the global market.
However, under the opening and closing of this valve, a closer look at the underlying logic of the three markets reveals that they each represent different cyclical paradigms:
- The US stock market relies on institutions and profits, making it the most standard "liquidity-profit" dual-cycle market;
- Crypto relies on narratives and liquidity supply, functioning as a "high-elasticity cyclical asset" with built-in leverage;
- A-shares depend on policies and confidence, representing a typical "structural recovery market";
In other words, the depth of the US stock market's drawdown is determined by liquidity, but the speed of recovery is driven by corporate profits. Therefore, during the tightening storm of 2022, the decline in US stocks was dominated by macro logic leading to valuation compression, but as liquidity panic receded, the market's focus quickly returned to fundamentals.
Especially with the enormous productivity expectations brought about by the subsequent AI revolution, which directly translated into tangible profit growth and profit statement expansion for tech giants, this powerful "profit-price" positive feedback mechanism, combined with its mature financial system (such as the long-term allocation needs of institutional investors), formed a resilient recovery loop, making the US stock market a model of "orderly declines and quicker recoveries."
On the other hand, Crypto largely acts as an amplifier of risk appetite for US stocks (especially the Nasdaq)—when liquidity is abundant, its gains are more astonishing; when liquidity dries up, its declines are also more severe. It can be completely viewed as a "cyclical offensive target" with built-in high leverage.
However, the other side of high elasticity is severe differentiation. As Bitcoin ETFs deeply bind this market to Wall Street, the vast majority of altcoins have nearly perished in the liquidity contraction, and the "altcoin broad-based rally" that ordinary people expect is becoming increasingly scarce, with the market gradually differentiating into "mainstream asset pools" and "speculative islands."
To put it bluntly, as Crypto assets gradually become "Wall Street-ized" and "institutionalized," what they represent is no longer the excess returns of the grassroots era, but a market with extremely high volatility and diminishing marginal returns. The liquidity dividend is beginning to give way to structural opportunities, which also means that US stocks have, in fact, become a more cost-effective choice.
After all, compared to altcoins, US stocks offer higher certainty, information transparency, and institutional maturity. Quality assets experience smaller drawdowns and quicker rebounds, and since corporate profits can be verified and policy cycles are predictable, the logic of news can always be unearthed—there are rarely instances of "unexplained surges and crashes." Therefore, from an investment perspective, this certainty is precisely the most scarce value in the current liquidity environment.
The recovery logic of A-shares neither fully relies on global technological waves nor has an endogenous supply mechanism. The core driving force resembles a long game between a "policy bottom" and a "market bottom," essentially revolving around the restoration of confidence and expectations.
In summary, from this perspective, one can consider US stocks as core assets, view Crypto as a cyclical offensive asset with built-in leverage, and categorize A-shares as structural strategy targets.
In Conclusion
Looking back at this global market experiment from 2021 to 2025, it becomes clear that enduring drawdowns is the only way to grasp cycles.
However, there is no standard answer for how to calmly endure drawdowns, but understanding their risk-return characteristics, especially their performance under extreme pressure, is the first step toward making informed decisions.
After all, in the long race of investment, what determines how far we can go is never how fast we run in favorable winds, but how much drawdown we can withstand in headwinds.
Let us encourage each other.
免责声明:本文章仅代表作者个人观点,不代表本平台的立场和观点。本文章仅供信息分享,不构成对任何人的任何投资建议。用户与作者之间的任何争议,与本平台无关。如网页中刊载的文章或图片涉及侵权,请提供相关的权利证明和身份证明发送邮件到support@aicoin.com,本平台相关工作人员将会进行核查。


