Crypto News
October 20 Highlights:
1. Galaxy Research: The U.S. government's BTC holdings surged by 64% overnight, with reserves reaching about 3.5% of gold reserves.
2. The head of the Payment and Settlement Department of the People's Bank of China: We will continue to improve the cross-border payment system for the renminbi.
3. "Charting Crypto Q4 2025" report: Bitcoin shows relative allocation advantages, and the overall market maintains a moderately optimistic outlook.
4. Vitalik responds on how to ensure hardware independence in improving crypto technology performance evaluation methods: Publicly available hardware can be used.
5. On October 19, on-chain monitoring data showed that Ethereum treasury company BitMine may have accumulated 379,271 ETH through three purchase transactions since its collapse last weekend, worth approximately $1.5 billion.
Trading Insights
During trading, the following practical methods can help you avoid most traps and better grasp the market! 1. Identify highs and lows; wait for high-level consolidation without rushing to exit, as the market often accompanies a new high; do not blindly bottom-fish during low-level sideways trading, as it is likely to test new lows. Wait for a clear change in direction before acting to avoid being trapped by entering early. 2. During sideways periods, control your hands; most short-term losses stem from "itchy hands" during sideways trading. When the market has no clear direction, buying and selling is essentially blind guessing, which not only incurs unnecessary transaction fees but also easily leads to being trapped. 3. Look at K-lines for signals; use daily K-lines as a reference, enter the market when a bearish line is formed, and decisively take profits when a bullish line is formed. Following the trend signals given by K-lines is more certain than guessing based on feelings. 4. Understand rebounds and judge the rhythm; when the downward rhythm slows, subsequent rebounds are often sluggish; if the decline suddenly accelerates, it is more likely to trigger a rapid rebound. You need to predict the strength of the rebound based on the downward rhythm to avoid misjudging the timing. 5. Build positions using the "pyramid" method; buy more as prices drop, but be more cautious with position size as the number of purchases increases. This method effectively controls risk and is one of the core principles of short-term position management. 6. Continuous rises and falls lead to adjustments; after consecutive rises or falls, the market will inevitably enter a sideways adjustment phase. Do not liquidate all at high levels or fully invest at low levels at once; after the sideways phase ends, a change in trend is likely to occur. If the change in trend is downward from a high level, you need to liquidate positions in time to avoid the risk of decline.
LIFE IS LIKE
A JOURNEY ▲
Below are the real trading signals from the Big White Community this week. Congratulations to the friends who followed along. If your operations are not going smoothly, you can come and try it out.
The data is real, and each order has a screenshot from the time it was issued.
**Search for the public account: *Big White Talks About Coins*
BTC
Analysis
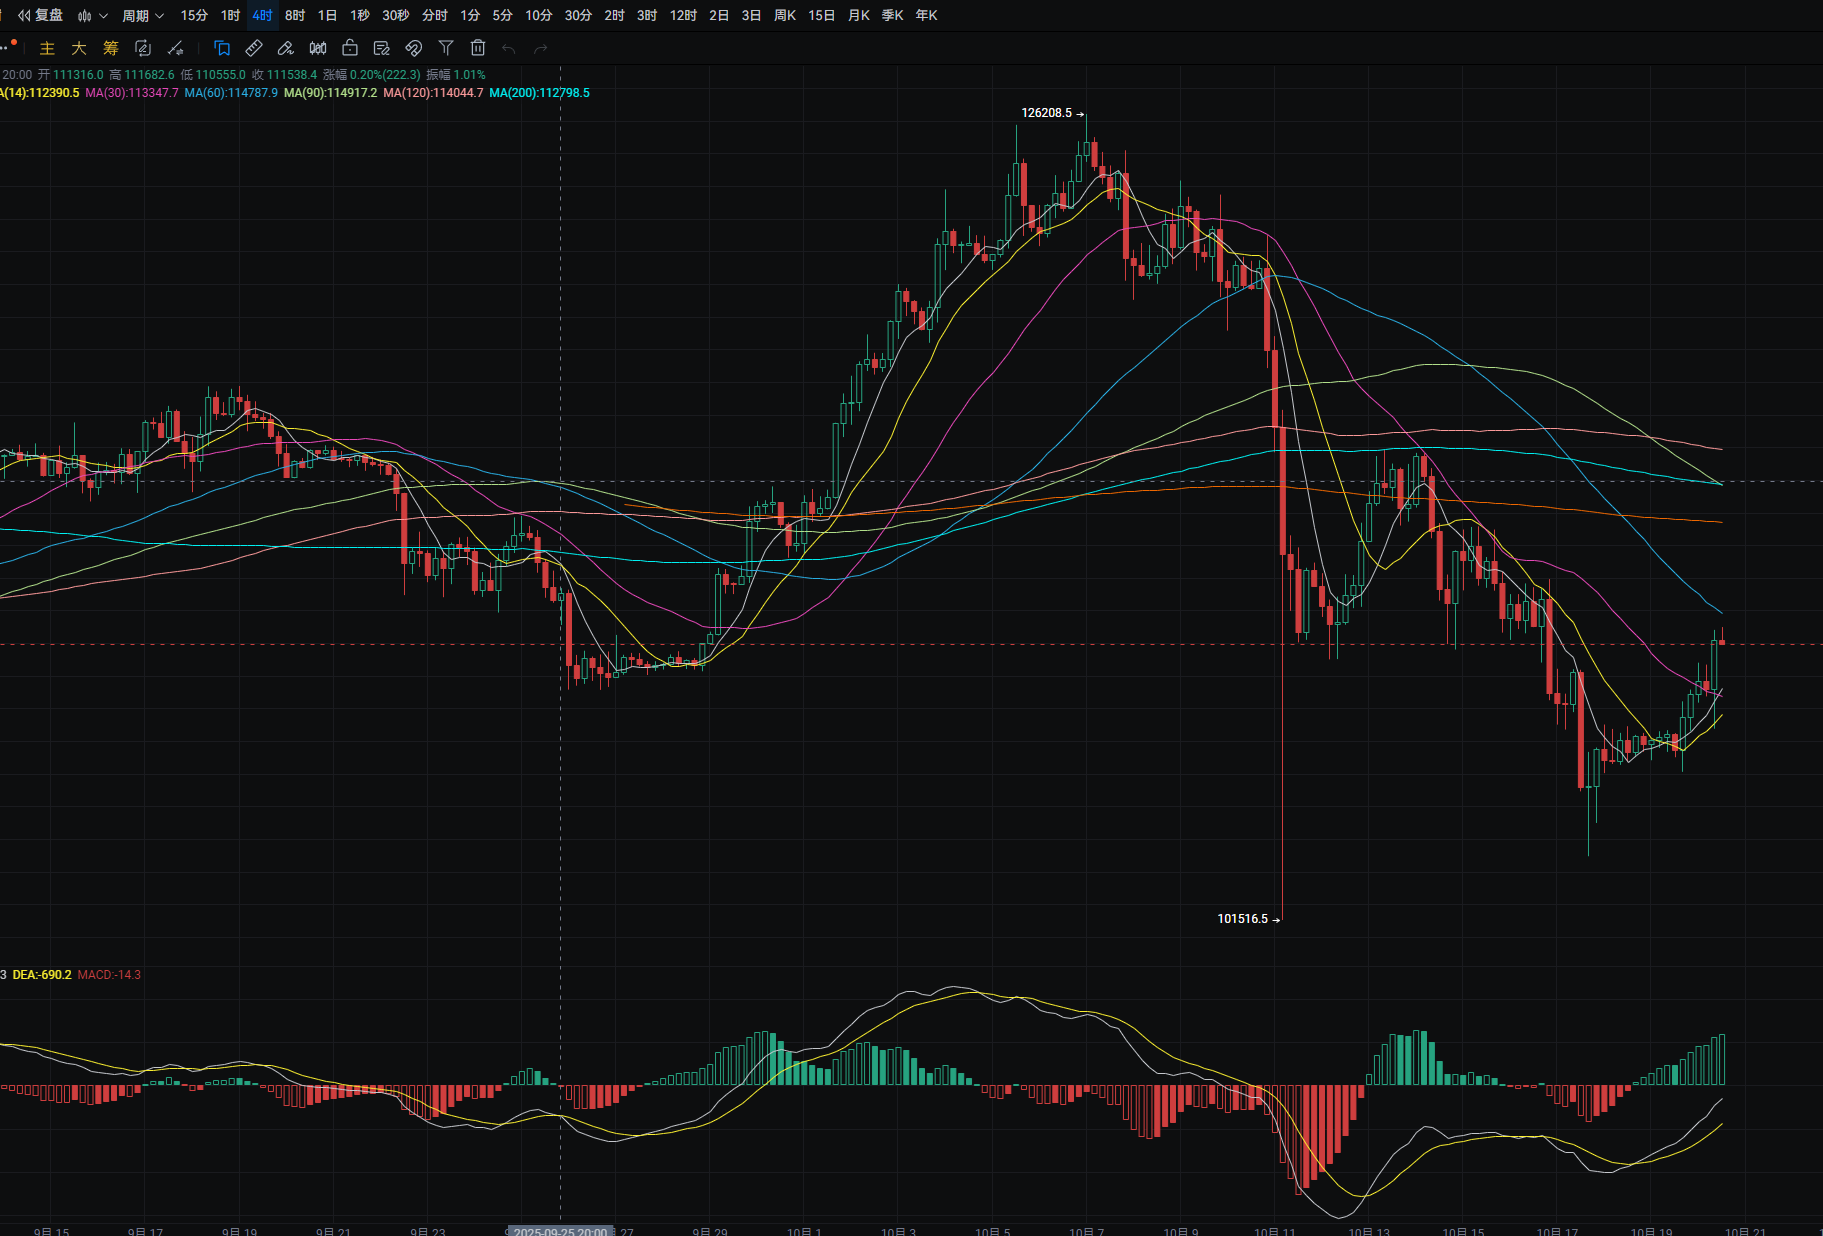
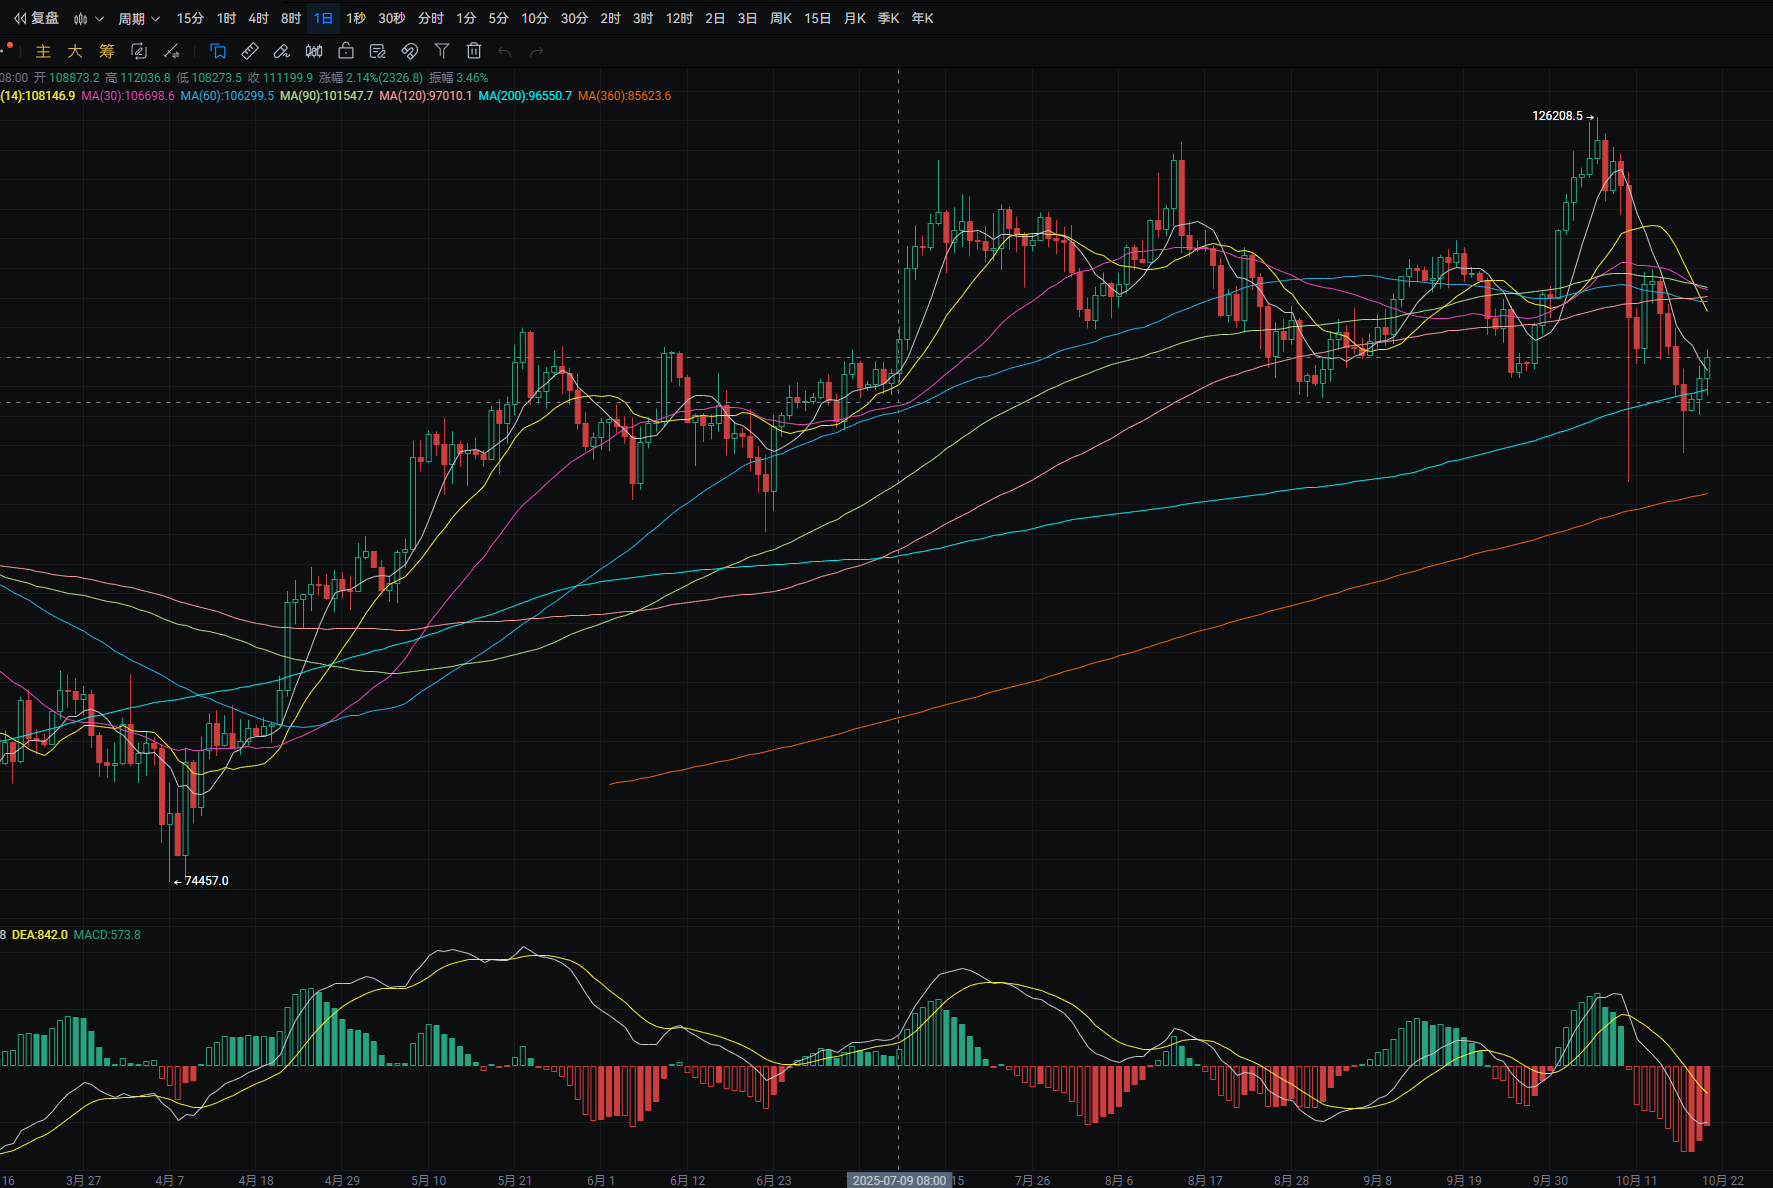
Bitcoin's daily line rose from a low of around 106,050 to a high of around 109,400 yesterday, closing around 108,600. The support level is around 108,550; if it breaks, it could drop to around 107,200. A pullback can be used to buy near this level. The resistance level is around 111,100; if it breaks, it could rise to near MA14. A rebound to this level can be used to short. MACD shows a decrease in bearish volume. The four-hour support level is near MA30; if it breaks, it could drop to around 107,100. A pullback can be used to buy near this level. MACD shows an increase in bullish volume.
ETH
Analysis
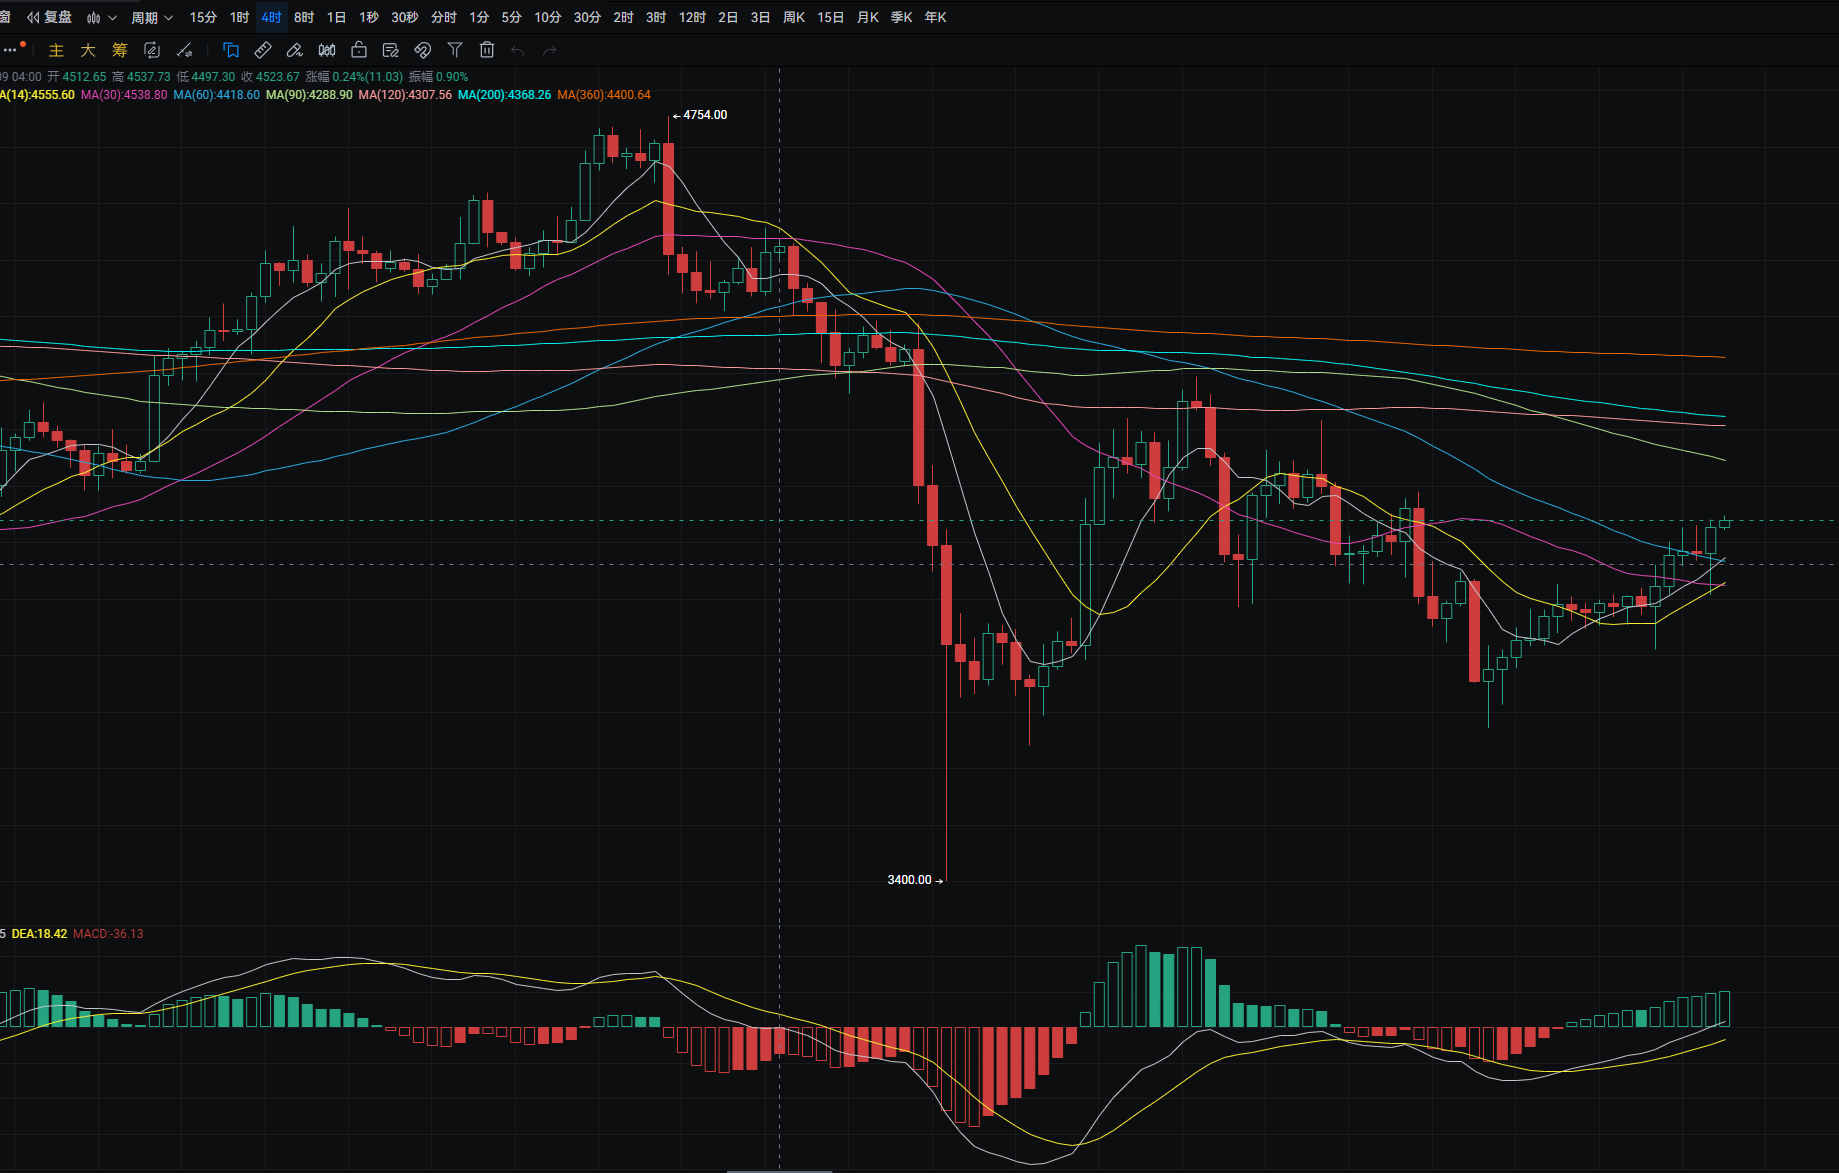
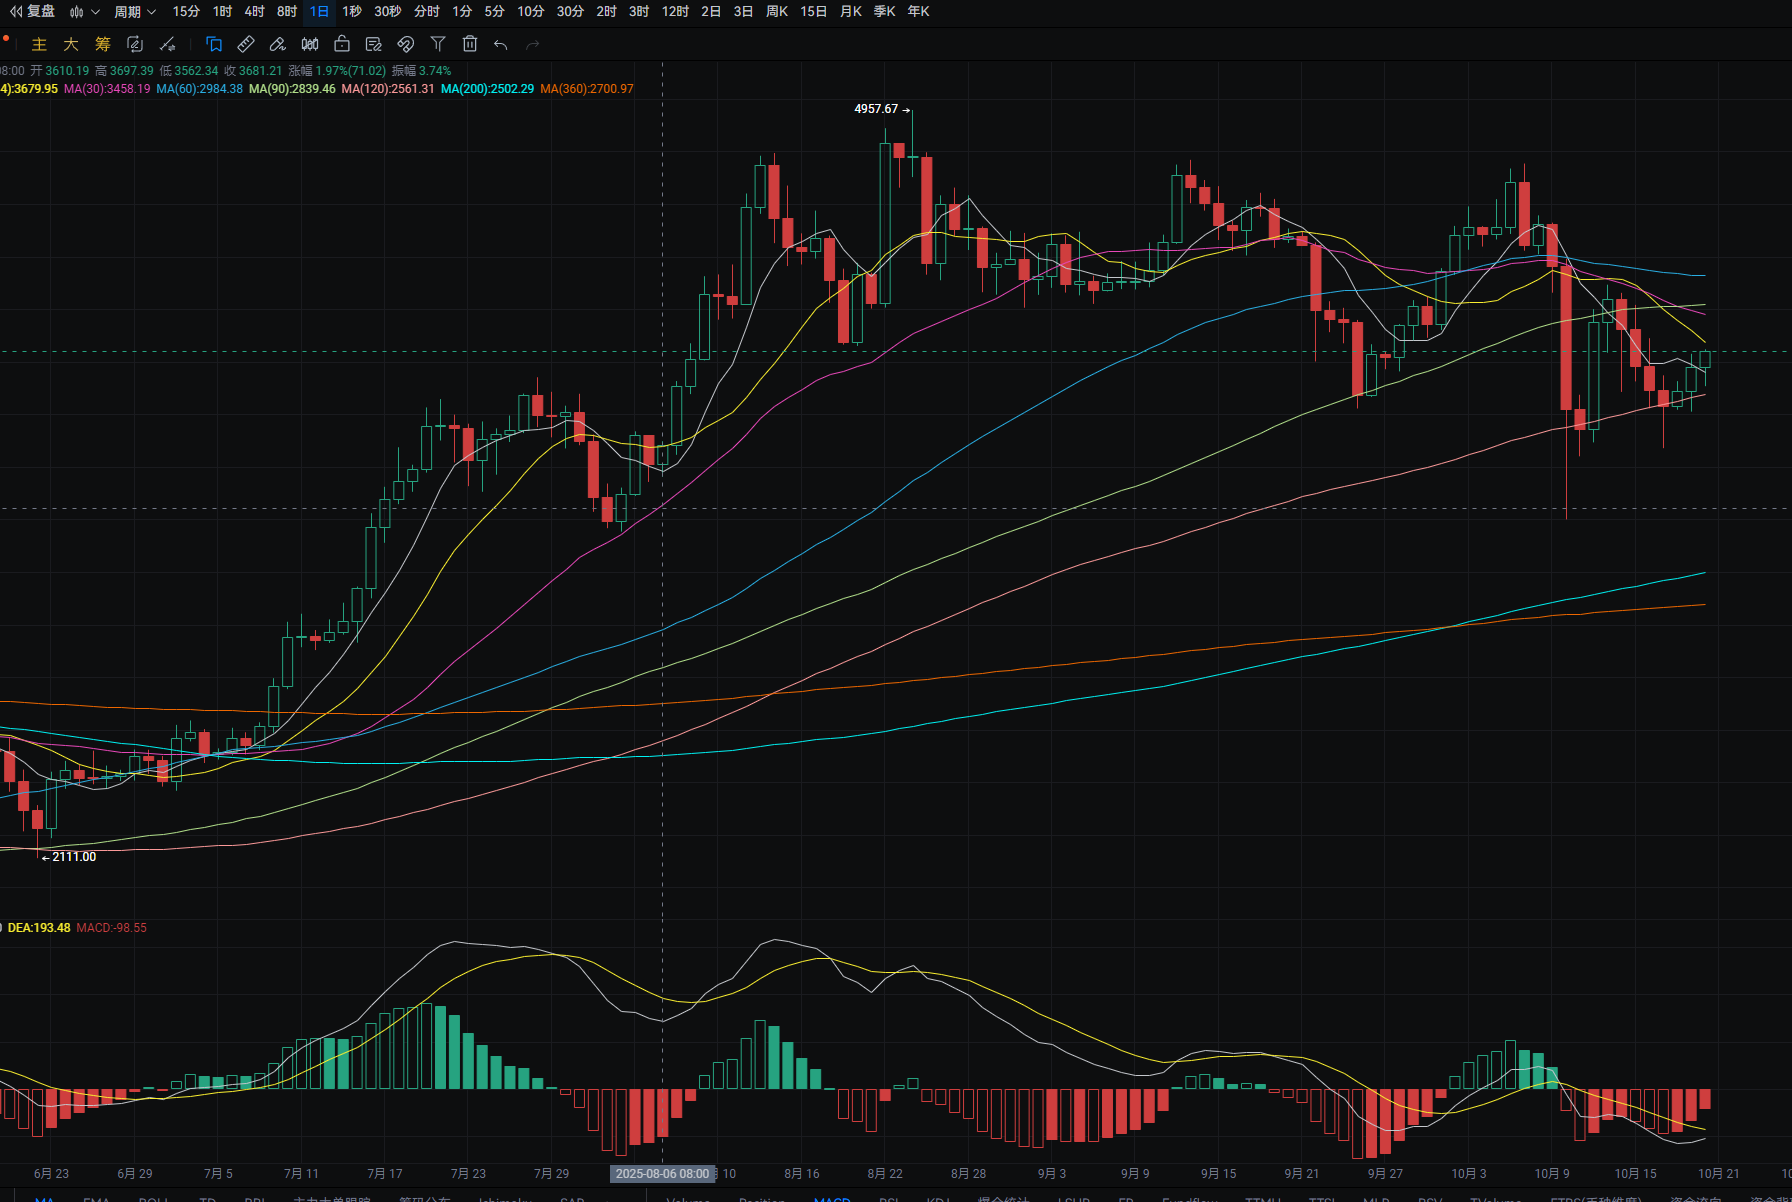
Ethereum's daily line rose from a low of around 3,810 to a high of around 4,030 yesterday, closing around 3,980. The support level is near MA120; if it breaks, it could drop to around 3,750. A pullback can be used to buy near this level. The resistance level is around 4,095; if it breaks, it could rise to around 4,150. A rebound to this level can be used to short. MACD shows a decrease in bearish volume. The four-hour support level is near MA60; if it breaks, it could drop to near MA30. A pullback can be used to buy near this level. The resistance level is around 4,075; if it breaks, it could rise to near MA90. A rebound to this level can be used to short. MACD shows an increase in bullish volume.
Disclaimer: The above content is personal opinion and for reference only! It does not constitute specific operational advice and does not bear legal responsibility. Market conditions change rapidly, and the article has a certain lag. If you have any questions, feel free to consult.
免责声明:本文章仅代表作者个人观点,不代表本平台的立场和观点。本文章仅供信息分享,不构成对任何人的任何投资建议。用户与作者之间的任何争议,与本平台无关。如网页中刊载的文章或图片涉及侵权,请提供相关的权利证明和身份证明发送邮件到support@aicoin.com,本平台相关工作人员将会进行核查。


