Yesterday we mentioned that both bulls and bears should remain vigilant. Today, the market has reached a critical point, so we need to be cautious here.
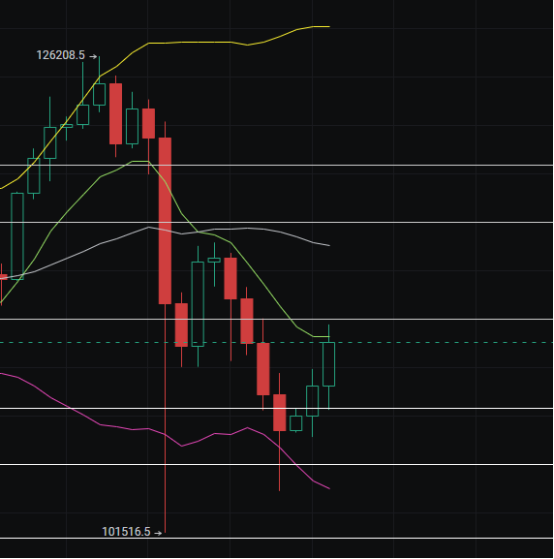
Weekly Level
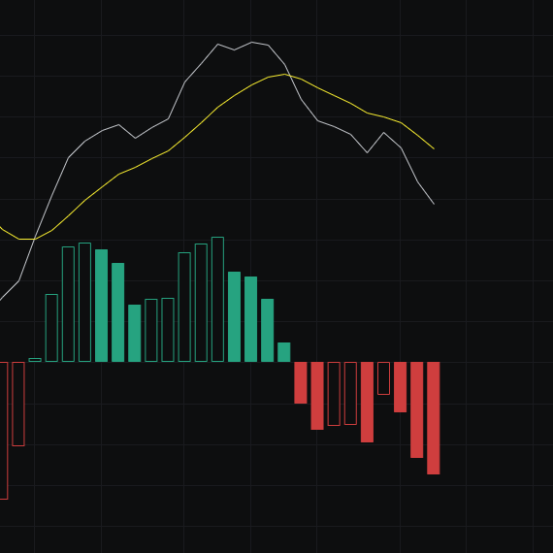
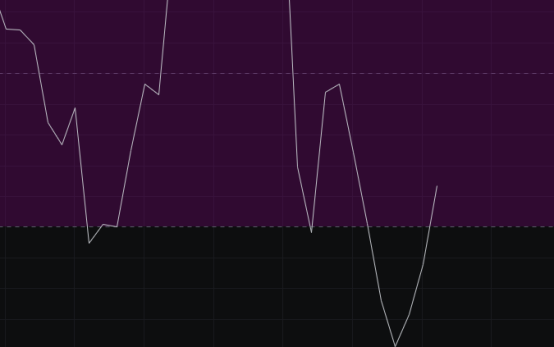
From the MACD perspective, the energy bars continue to decline, and both the fast and slow lines are under pressure. Additionally, the fast line is still some distance from the zero axis. If it continues to look bearish here, even if the fast line approaches the zero axis, there will still be room for a downward move.
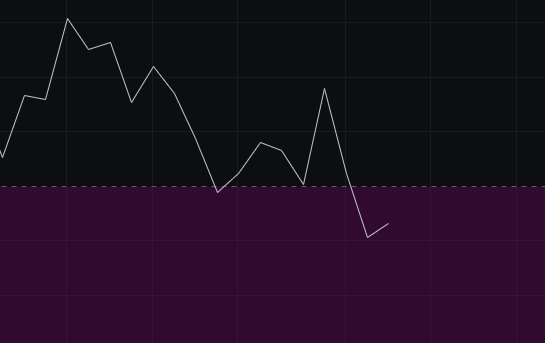
From the CCI perspective, the CCI has dropped from above and has rebounded around 100 twice. This is the third time it has touched 100, and the probability of a rebound this time is very low, so the CCI also indicates a bearish outlook.
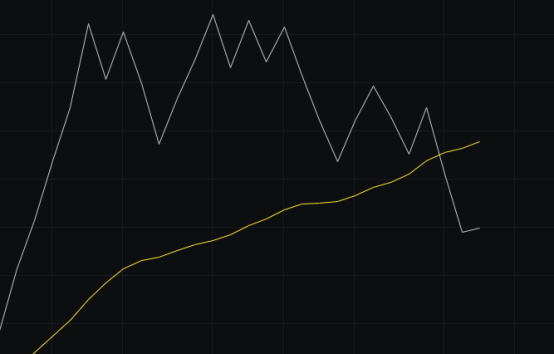
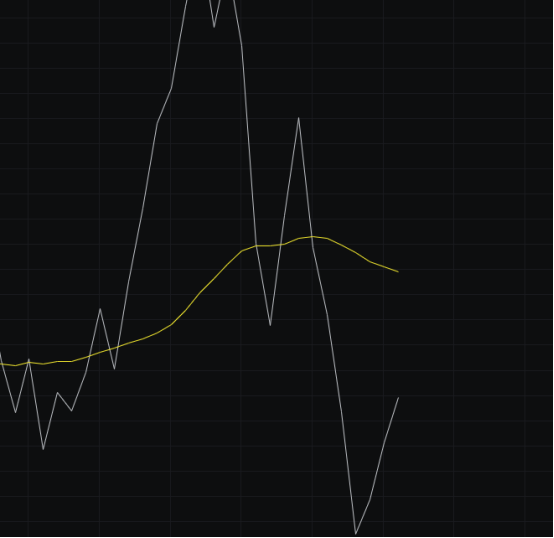
From the OBV perspective, the OBV is gradually declining, and the fast line has already fallen below the slow line. It will be impossible to regain the weekly level in a short time, so this also indicates a bearish outlook.
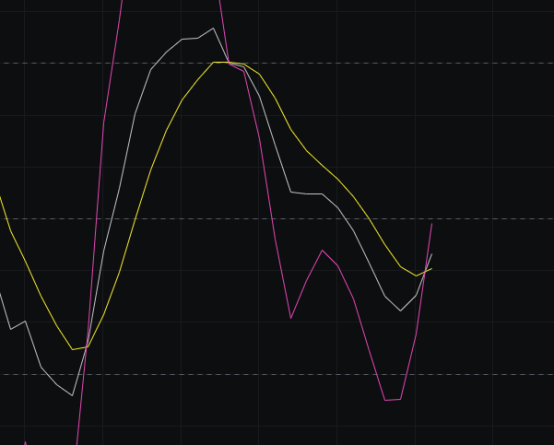
From the KDJ perspective, the KDJ has formed a death cross and is trending downwards, indicating a bearish trend, so the KDJ also suggests a bearish outlook.
From the MFI and RSI perspectives, both indicators have dropped from above into the neutral zone, so the likelihood of continued decline is greater here.
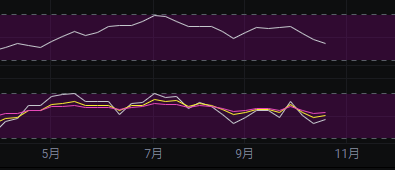
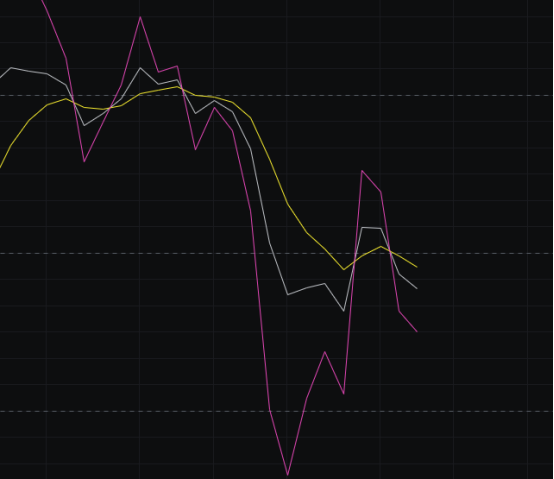
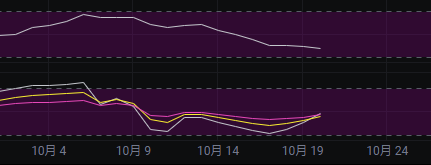
From the moving averages perspective, the market has tested the 30 level three times consecutively, with rebounds occurring in the first two instances. The third time appears to be holding, but whether it can sustain this support is uncertain. Meanwhile, the BBI is turning downwards, indicating a bearish outlook.
From the Bollinger Bands perspective, the bands have entered a narrow range and show signs of continuing to contract. If a direction occurs here, it is likely to lead to a significant market movement.
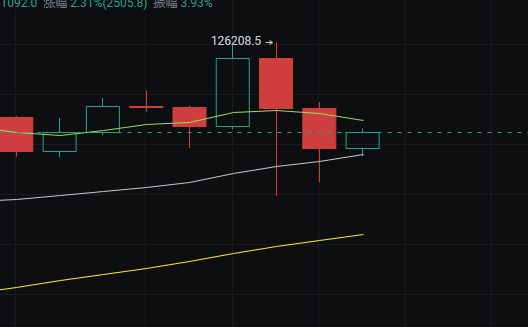
Daily Level
From the MACD perspective, the energy bars have retracted somewhat, and the fast line has turned, but whether it can break upwards will need to be observed over the next few days.
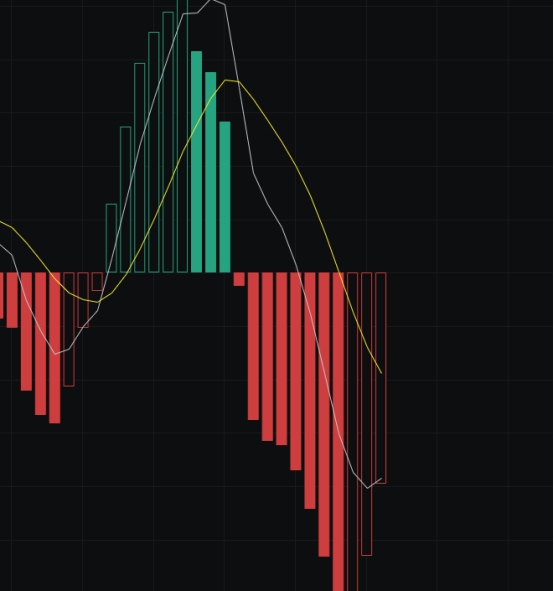
From the CCI perspective, after three days of rebounds, the CCI has shown some recovery, but it is still some distance from the zero axis. Continuous bullish candles or a large bullish candle are needed to stand above the zero axis. If it does not reach the zero axis, we will maintain a bearish view, specifically looking at the performance over the next few days.
From the OBV perspective, the OBV has shown some recovery but remains below the slow line, which continues to exert downward pressure. The OBV still indicates a bearish trend.
From the KDJ perspective, the KDJ has formed a golden cross, so those shorting should set stop losses, and those going long should remain vigilant.
From the MFI and RSI perspectives, the MFI continues to decline, while the RSI is moving upwards. An adjustment is needed here to align the directions of the MFI and RSI for a continuation of market movement, so we will observe the adjustments over the next two days.
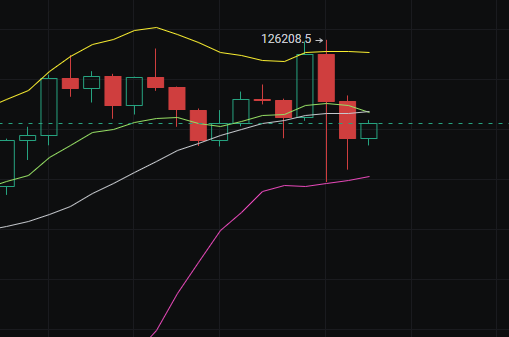
From the moving averages perspective, several moving averages are exerting downward pressure, and the price has reached near the BBI, engaging in a tug-of-war. We believe a new confrontation between bulls and bears is unfolding, with the battleground being the BBI. If the price stands above the BBI, it favors the bulls; if it does not, it favors the bears.
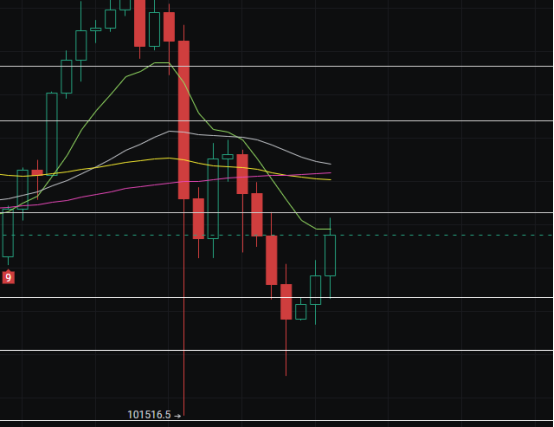
From the Bollinger Bands perspective, the upper band is tending to flatten, while the lower band is moving down but at a slower pace, which aligns with our predictions from yesterday. If the market moves upwards, the lower band will flatten, transitioning back to a wide range. If it consolidates, it will gradually transition to a wide range; if it declines, it will quickly transition to a downward channel. We will specifically observe the market movements over the next few days and make decisions based on the patterns that emerge.
In summary: The market has reached a critical point, and a new round of competition between bulls and bears will unfold here. The conservative approach is to wait for a clear direction before chasing long or short positions. Resistance is seen at 112000-114000, and support is at 107500-105000.
免责声明:本文章仅代表作者个人观点,不代表本平台的立场和观点。本文章仅供信息分享,不构成对任何人的任何投资建议。用户与作者之间的任何争议,与本平台无关。如网页中刊载的文章或图片涉及侵权,请提供相关的权利证明和身份证明发送邮件到support@aicoin.com,本平台相关工作人员将会进行核查。