Li Ying in the Crypto Circle: Bitcoin Latest Market Analysis on 10.21
Article Published on 2025.10.21------00:10
The current price of Bitcoin is 111,200. Li Ying believes that Bitcoin has a clear upward trend. The resonance of the golden cross and engulfing pattern indicates that price momentum continues to strengthen. The support from both short-term and long-term moving averages further consolidates the bullish market structure. However, it should be noted that the market is in an overbought state, which may trigger short-term pullback pressure, creating some contradiction with the trend signals. The daily chart shows a strong rebound trend with a long bullish candlestick formed over the past two days. The 2-hour candlestick has repeatedly broken through high points, indicating a short-term upward trend. The MACD shows enhanced momentum on the 2-hour chart, and the daily golden cross indicates a bullish market sentiment. The EMA on the 2-hour moving average is in a bullish arrangement, and the daily chart also maintains a bullish arrangement, confirming an upward medium to long-term trend. As the trend shows a shift and signals turn bullish, Li Ying does not recommend rigidly shorting but rather suggests primarily going long while ensuring risk control and safety first.
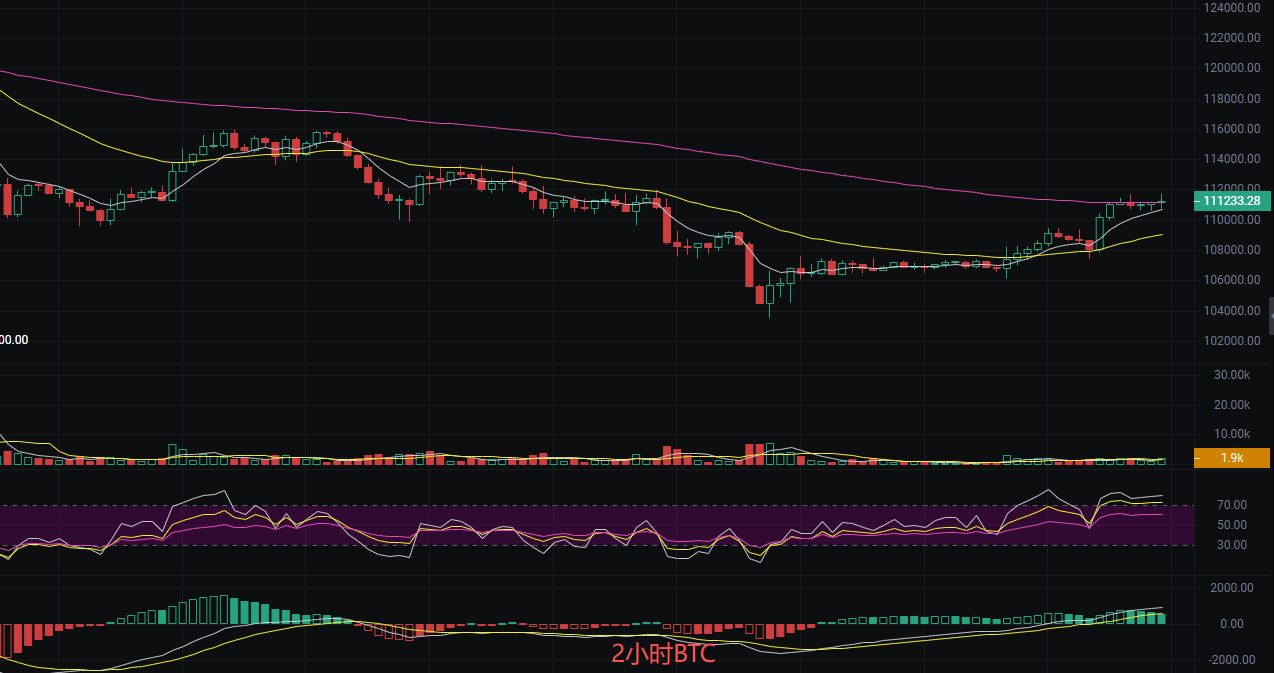
Short-term Strategy Reference:
- Long Entry Point: 110,000, Stop Loss: 109,500, Target: 112,000
- Short Entry Point: 112,000, Stop Loss: 112,500, Target: 110,000
Ethereum Latest Market Analysis
Before publication, the current price of Ethereum is 4,010. Li Ying observes that Ethereum is fluctuating between strong support at 4,032 and strong resistance at 4,293. The bullish engulfing pattern serves as a potential reversal signal, and the market remains uncertain in the short term. The characteristics of range-bound fluctuations indicate a lack of clear breakthrough momentum, necessitating close attention to key price level breakouts. The daily chart shows consecutive increases forming multiple bullish candlesticks, presenting an overall upward trend. After a slight pullback on the 2-hour chart, the candlestick closed near previous high points. The MACD shows strong bullish momentum on the daily chart, while the 2-hour chart needs to be monitored for any further weakening. The EMA indicates a clear bullish trend on the daily chart, and the 2-hour chart maintains a short-term upward trend. Li Ying assesses that the market has reached a critical pressure point for the exchange of bullish and bearish trends, which is why such changes are occurring; therefore, caution is advised when entering the market.
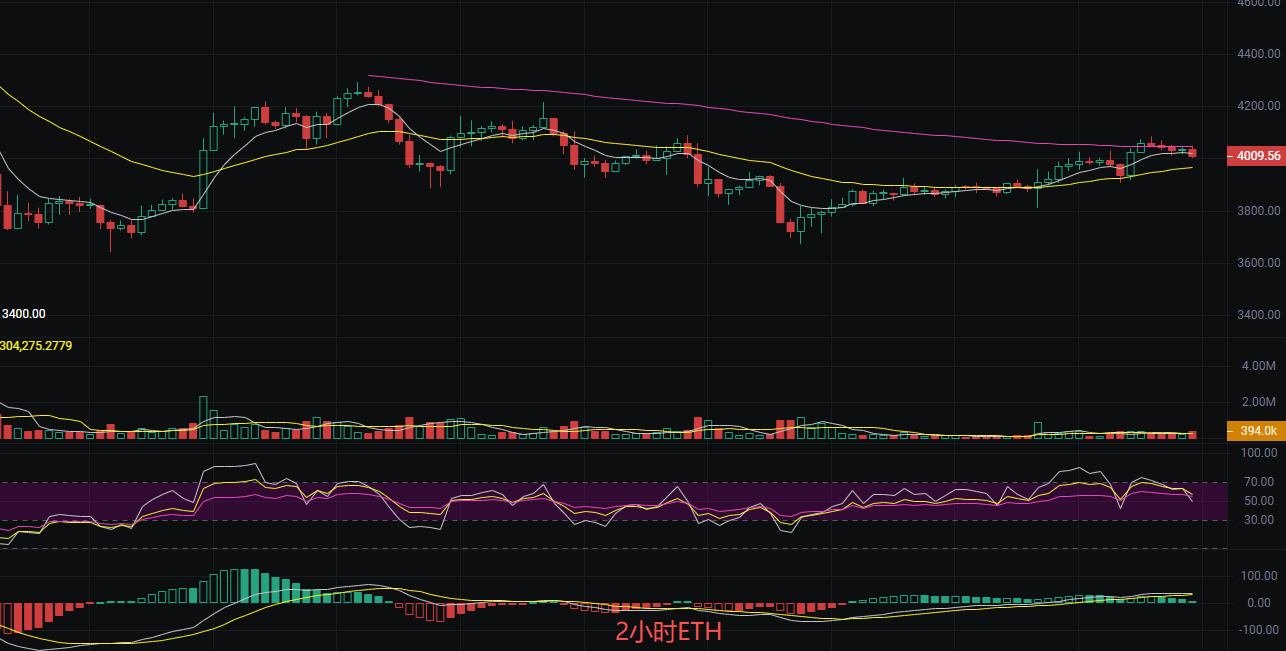
Short-term Point Reference:
- Short Entry Point: 4,100, Stop Loss: 4,150, Target: 4,000
- Long Entry Point: 4,000, Stop Loss: 3,950, Target: 4,100
The above content is exclusively original by Li Ying; please indicate the source when reprinting! Article publication review may have delays, and market conditions change rapidly. The above suggestions are for reference only, and risks are borne by the reader. I hope Li Ying's insights will be helpful to you!

The content of the article is time-sensitive and for reference only; risks are borne by the reader.
免责声明:本文章仅代表作者个人观点,不代表本平台的立场和观点。本文章仅供信息分享,不构成对任何人的任何投资建议。用户与作者之间的任何争议,与本平台无关。如网页中刊载的文章或图片涉及侵权,请提供相关的权利证明和身份证明发送邮件到support@aicoin.com,本平台相关工作人员将会进行核查。