Trading Philosophy: Look for trends in the long term, find entry points in the short term;
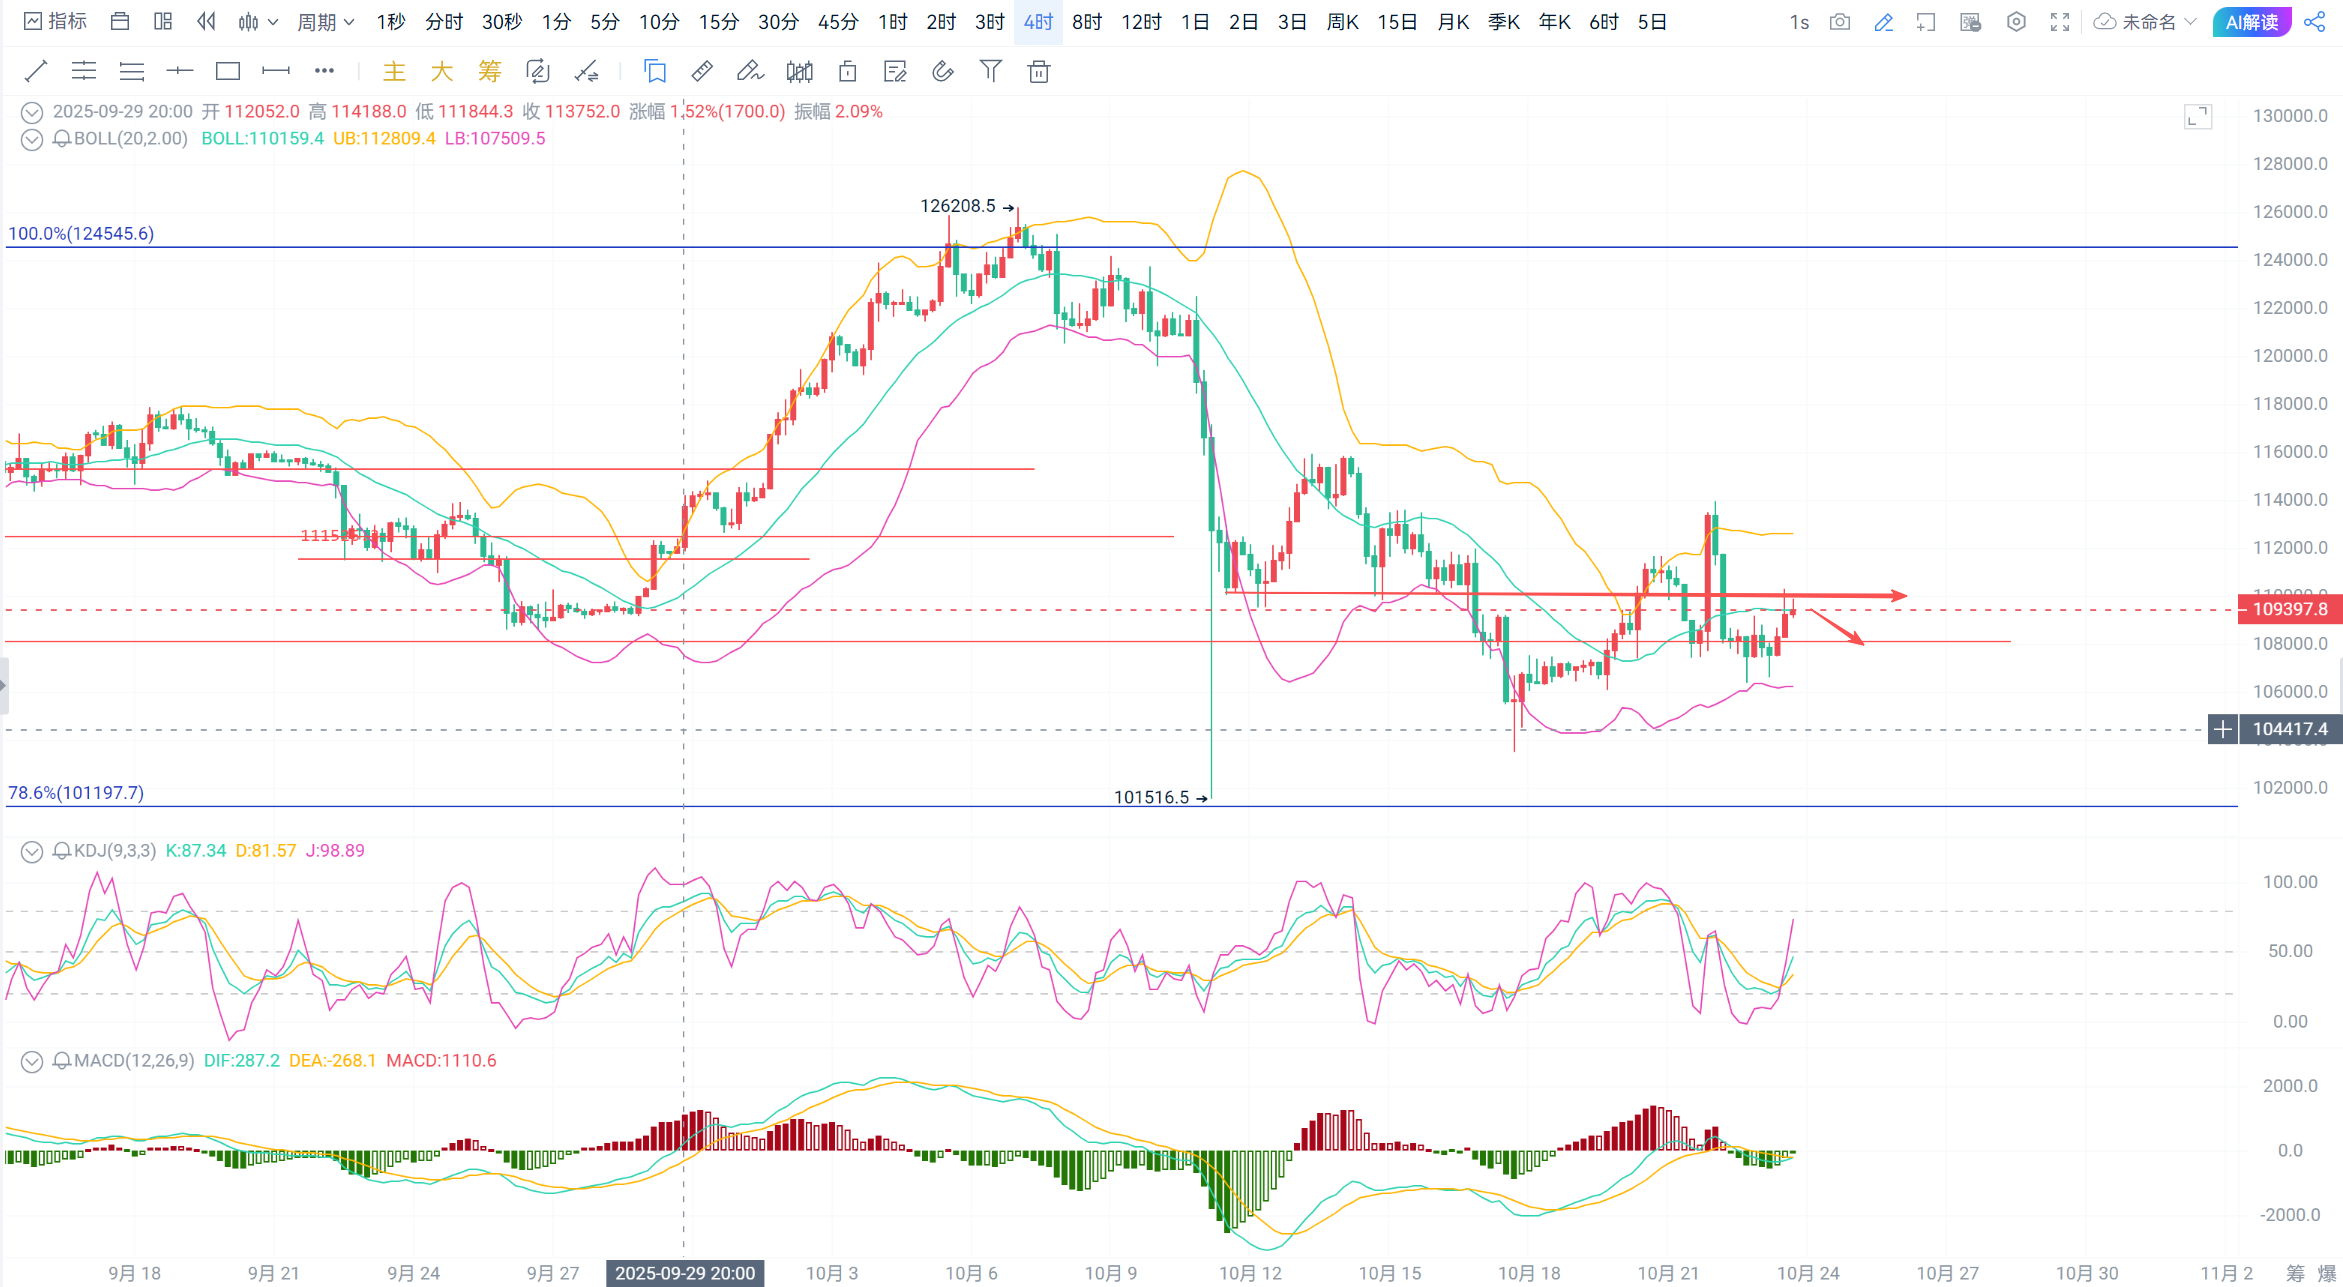
Technical Analysis: For Bitcoin, the daily chart shows a bullish candlestick around 107500, the Bollinger Bands continue to open downwards, the MACD moving averages are starting to flatten and move downwards, bearish volume continues to decrease, and the KDJ is starting to move upwards again. On the 4-hour chart, the Bollinger Bands are starting to flatten, the MACD moving averages are beginning to move upwards, bearish volume continues to decrease, and the KDJ line is starting to move upwards;
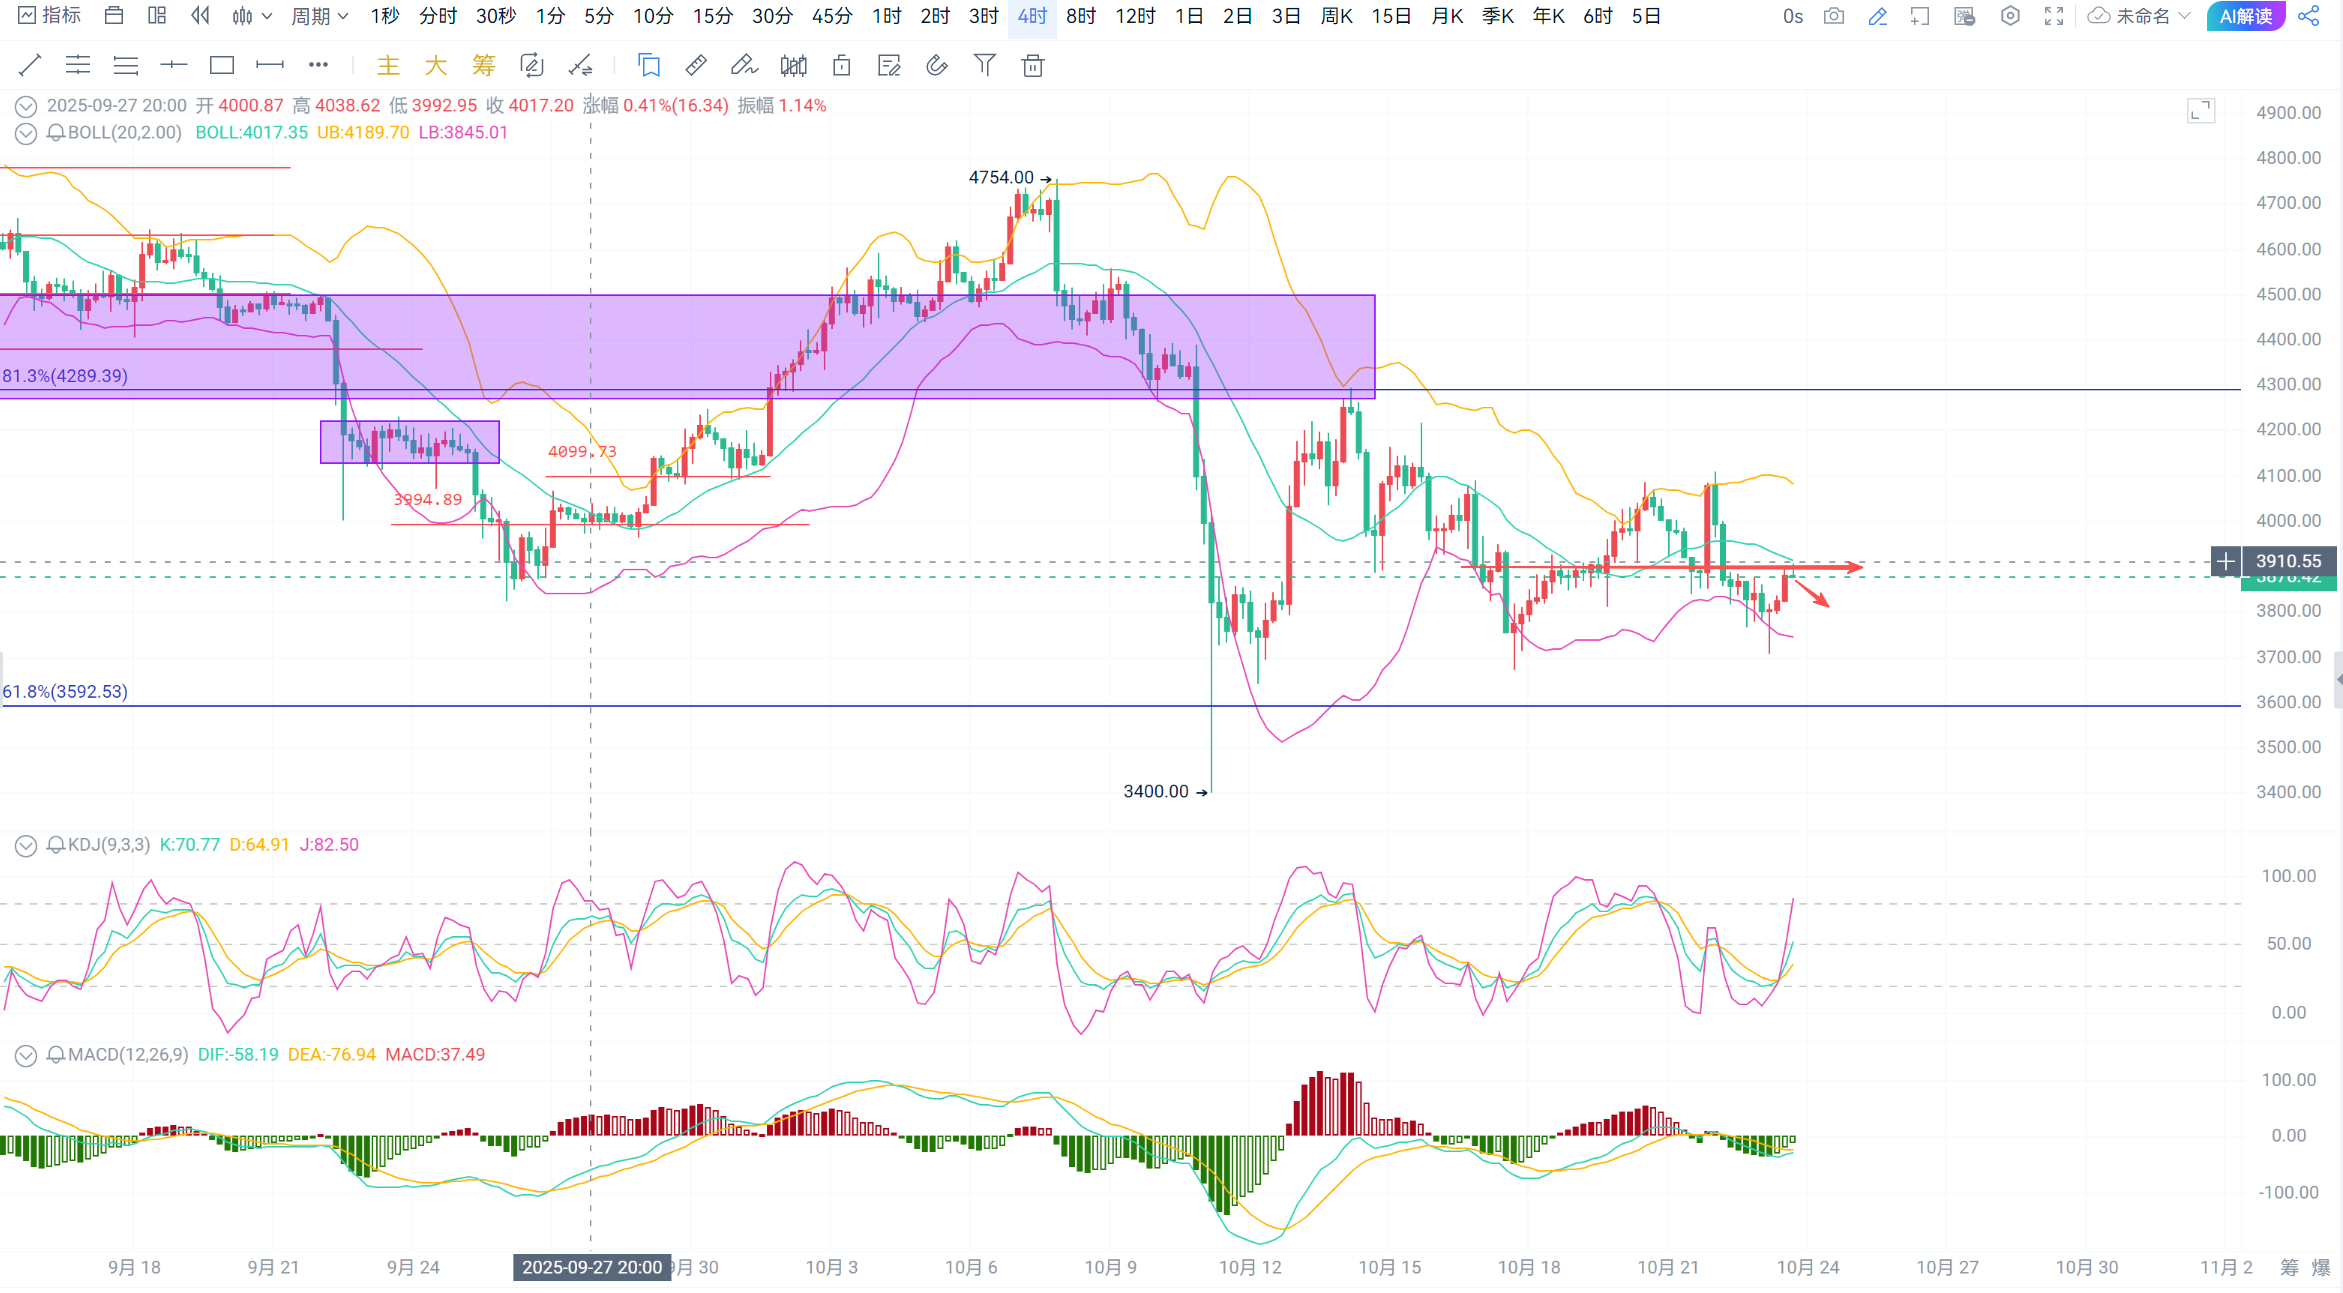
For Ethereum, the daily chart shows a doji candlestick around 3800, the Bollinger Bands continue to slowly open downwards, the MACD moving averages continue to flatten and move downwards, bearish volume continues to decrease, and the KDJ line is starting to flatten and move downwards. On the 4-hour chart, the Bollinger Bands are starting to open downwards, the MACD moving averages are beginning to flatten, bearish volume continues to decrease, and the KDJ line is starting to move upwards;
Currently, the market is fluctuating up and down, and the subsequent operation suggests shorting at high positions!
Operation Suggestion: Short at high positions!
Short Bitcoin at 109500-110000, target 108500-107500, stop loss at 111000;
Short Ethereum at 3880-3910, target 3800-3750, stop loss at 3960;
The strategy is time-sensitive, please refer to private real-time guidance for specifics!
Scan the QR code below to follow our WeChat public account for more real-time market updates!

免责声明:本文章仅代表作者个人观点,不代表本平台的立场和观点。本文章仅供信息分享,不构成对任何人的任何投资建议。用户与作者之间的任何争议,与本平台无关。如网页中刊载的文章或图片涉及侵权,请提供相关的权利证明和身份证明发送邮件到support@aicoin.com,本平台相关工作人员将会进行核查。