Analyst Chen Shu: 10.25 Yesterday's Strategy Correctly Focused on Breakout Levels, Bitcoin and Ethereum Trend Analysis
From the daily chart of Bitcoin, the price has basically stabilized above 110,000 after three consecutive daily gains. The daily resistance levels to watch are the highs of 114,000/114,500, as well as the weekly level of 113,500/114,000. On the hourly chart, after breaking above the MA256 daily moving average, it continues to operate above this line. The short-term trend is no longer solely downward; we need to first look for a rebound to the 114,000 level before considering short positions for a pullback.
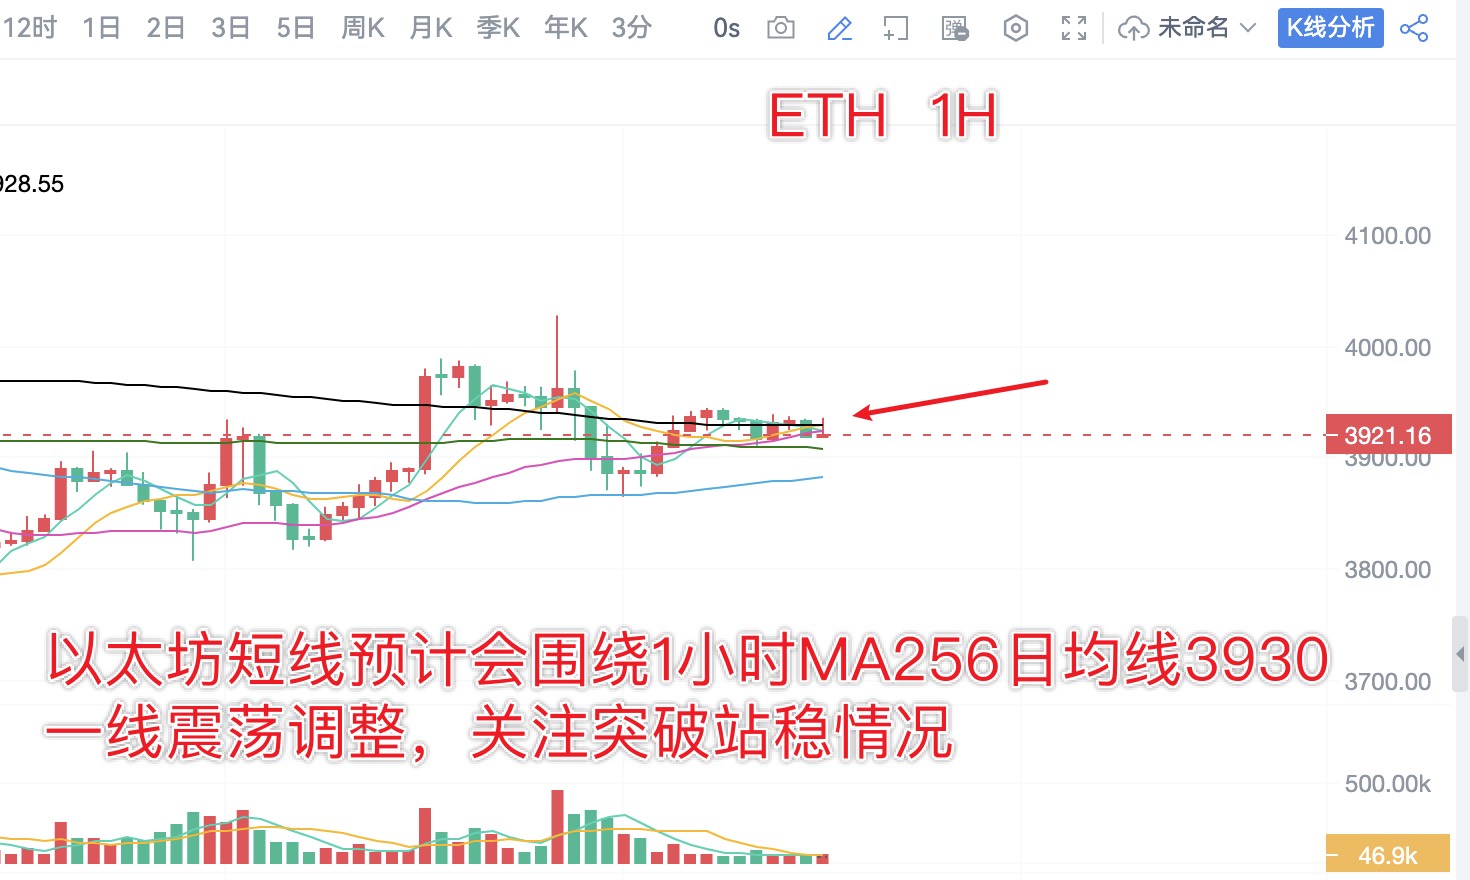
From the daily chart of Ethereum, there have been two consecutive red candlesticks with upper shadows, and the price is oscillating around the MA120 daily moving average at 3,940. In the short term, we should focus on this key level; if it stabilizes, we can expect further upward oscillation. Meanwhile, on the hourly chart, we are again testing the MA256 daily moving average resistance at 3,930, and we should pay attention to the breakout and stabilization at this level.
Midday Operation Thoughts (Written at: 13:00):
BTC: Long at 11.08, add to long on a pullback to 110,000, target 112,000/113,500; for the upper levels of 113,500/114,500, look for a 2,000-point pullback.
ETH: Long at 3,885, add to long on a pullback to 3,830, target 3,950/4,000; for the upper levels of 4,000/4,080, look for a short-term pullback.
The daily analysis strategy has a very high win rate! Analysis is not easy, and I hope everyone can give a free follow, save, like, and comment. Thank you all, and feel free to leave comments below; I will reply to each one.

免责声明:本文章仅代表作者个人观点,不代表本平台的立场和观点。本文章仅供信息分享,不构成对任何人的任何投资建议。用户与作者之间的任何争议,与本平台无关。如网页中刊载的文章或图片涉及侵权,请提供相关的权利证明和身份证明发送邮件到support@aicoin.com,本平台相关工作人员将会进行核查。