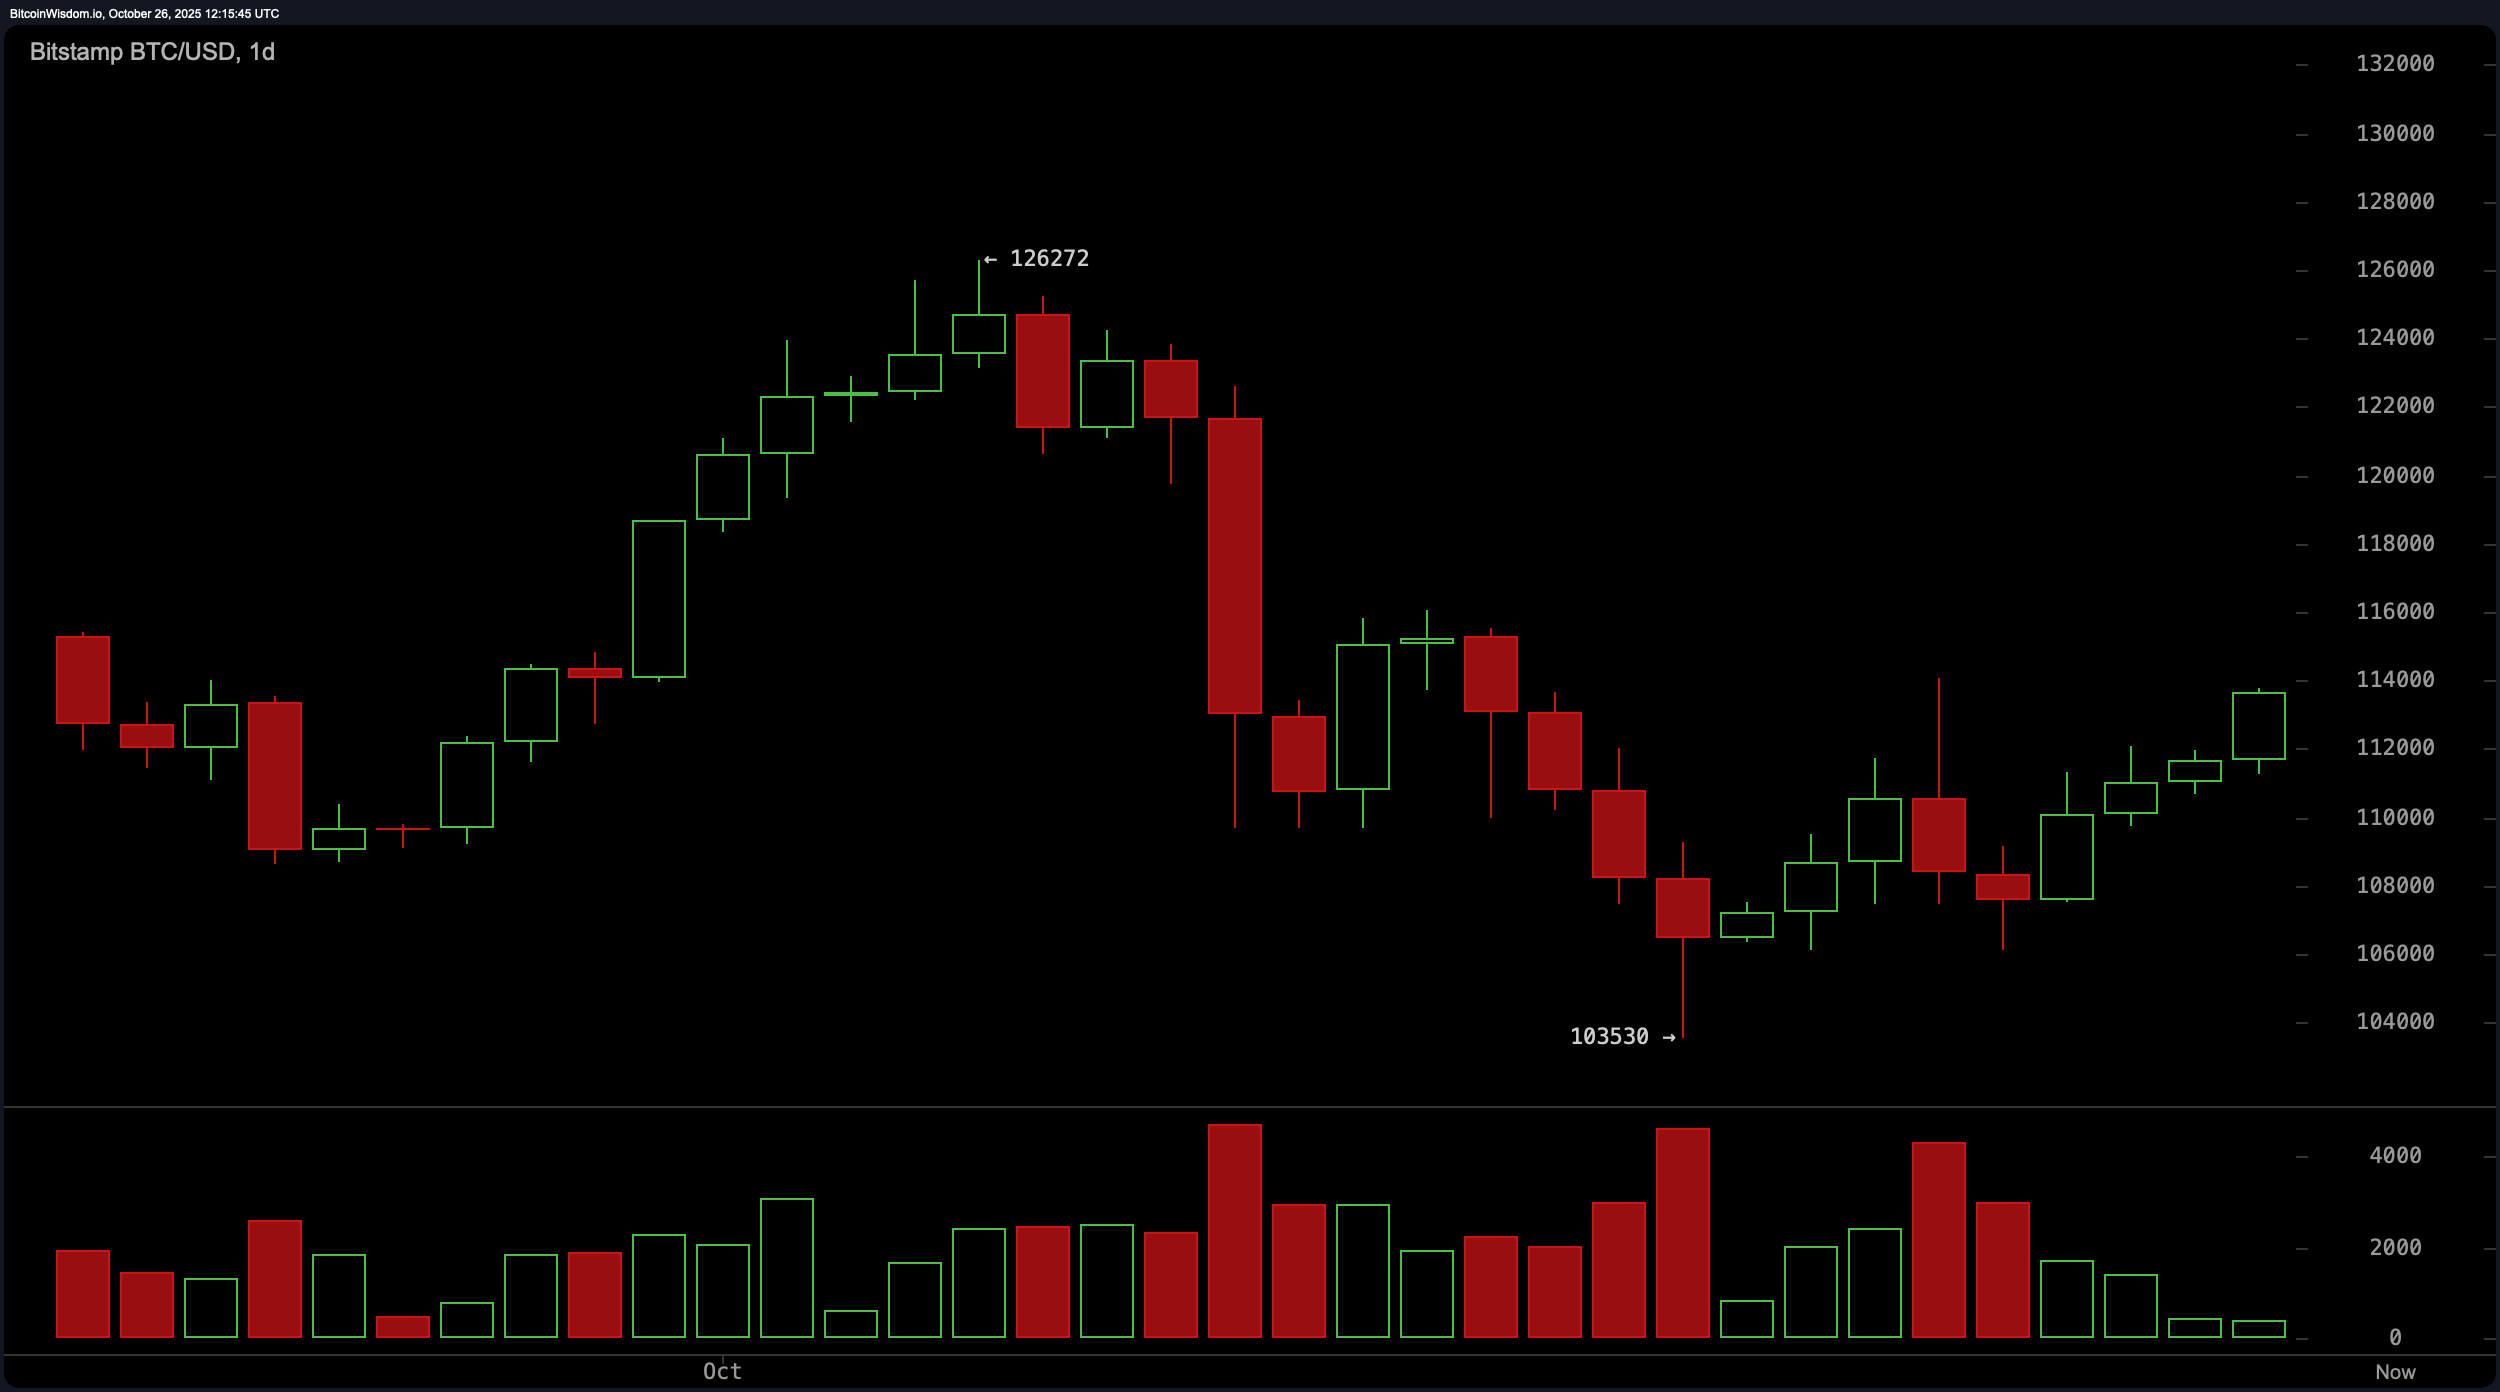
On the daily chart, bitcoin is recovering from a significant correction that saw the price retreat from a high near $126,272 to a low around $103,530. The rebound is forming a short-term uptrend, although volume data reveals a lack of strong buying conviction, suggesting the rally may not yet be fully supported by market participation.
Current daily candles show a continuation pattern, but the diminished volume points to a fragile trend that could face resistance near the $115,000–$116,000 region.

BTC/USD 1-day chart via Bitstamp on Oct. 26, 2025.
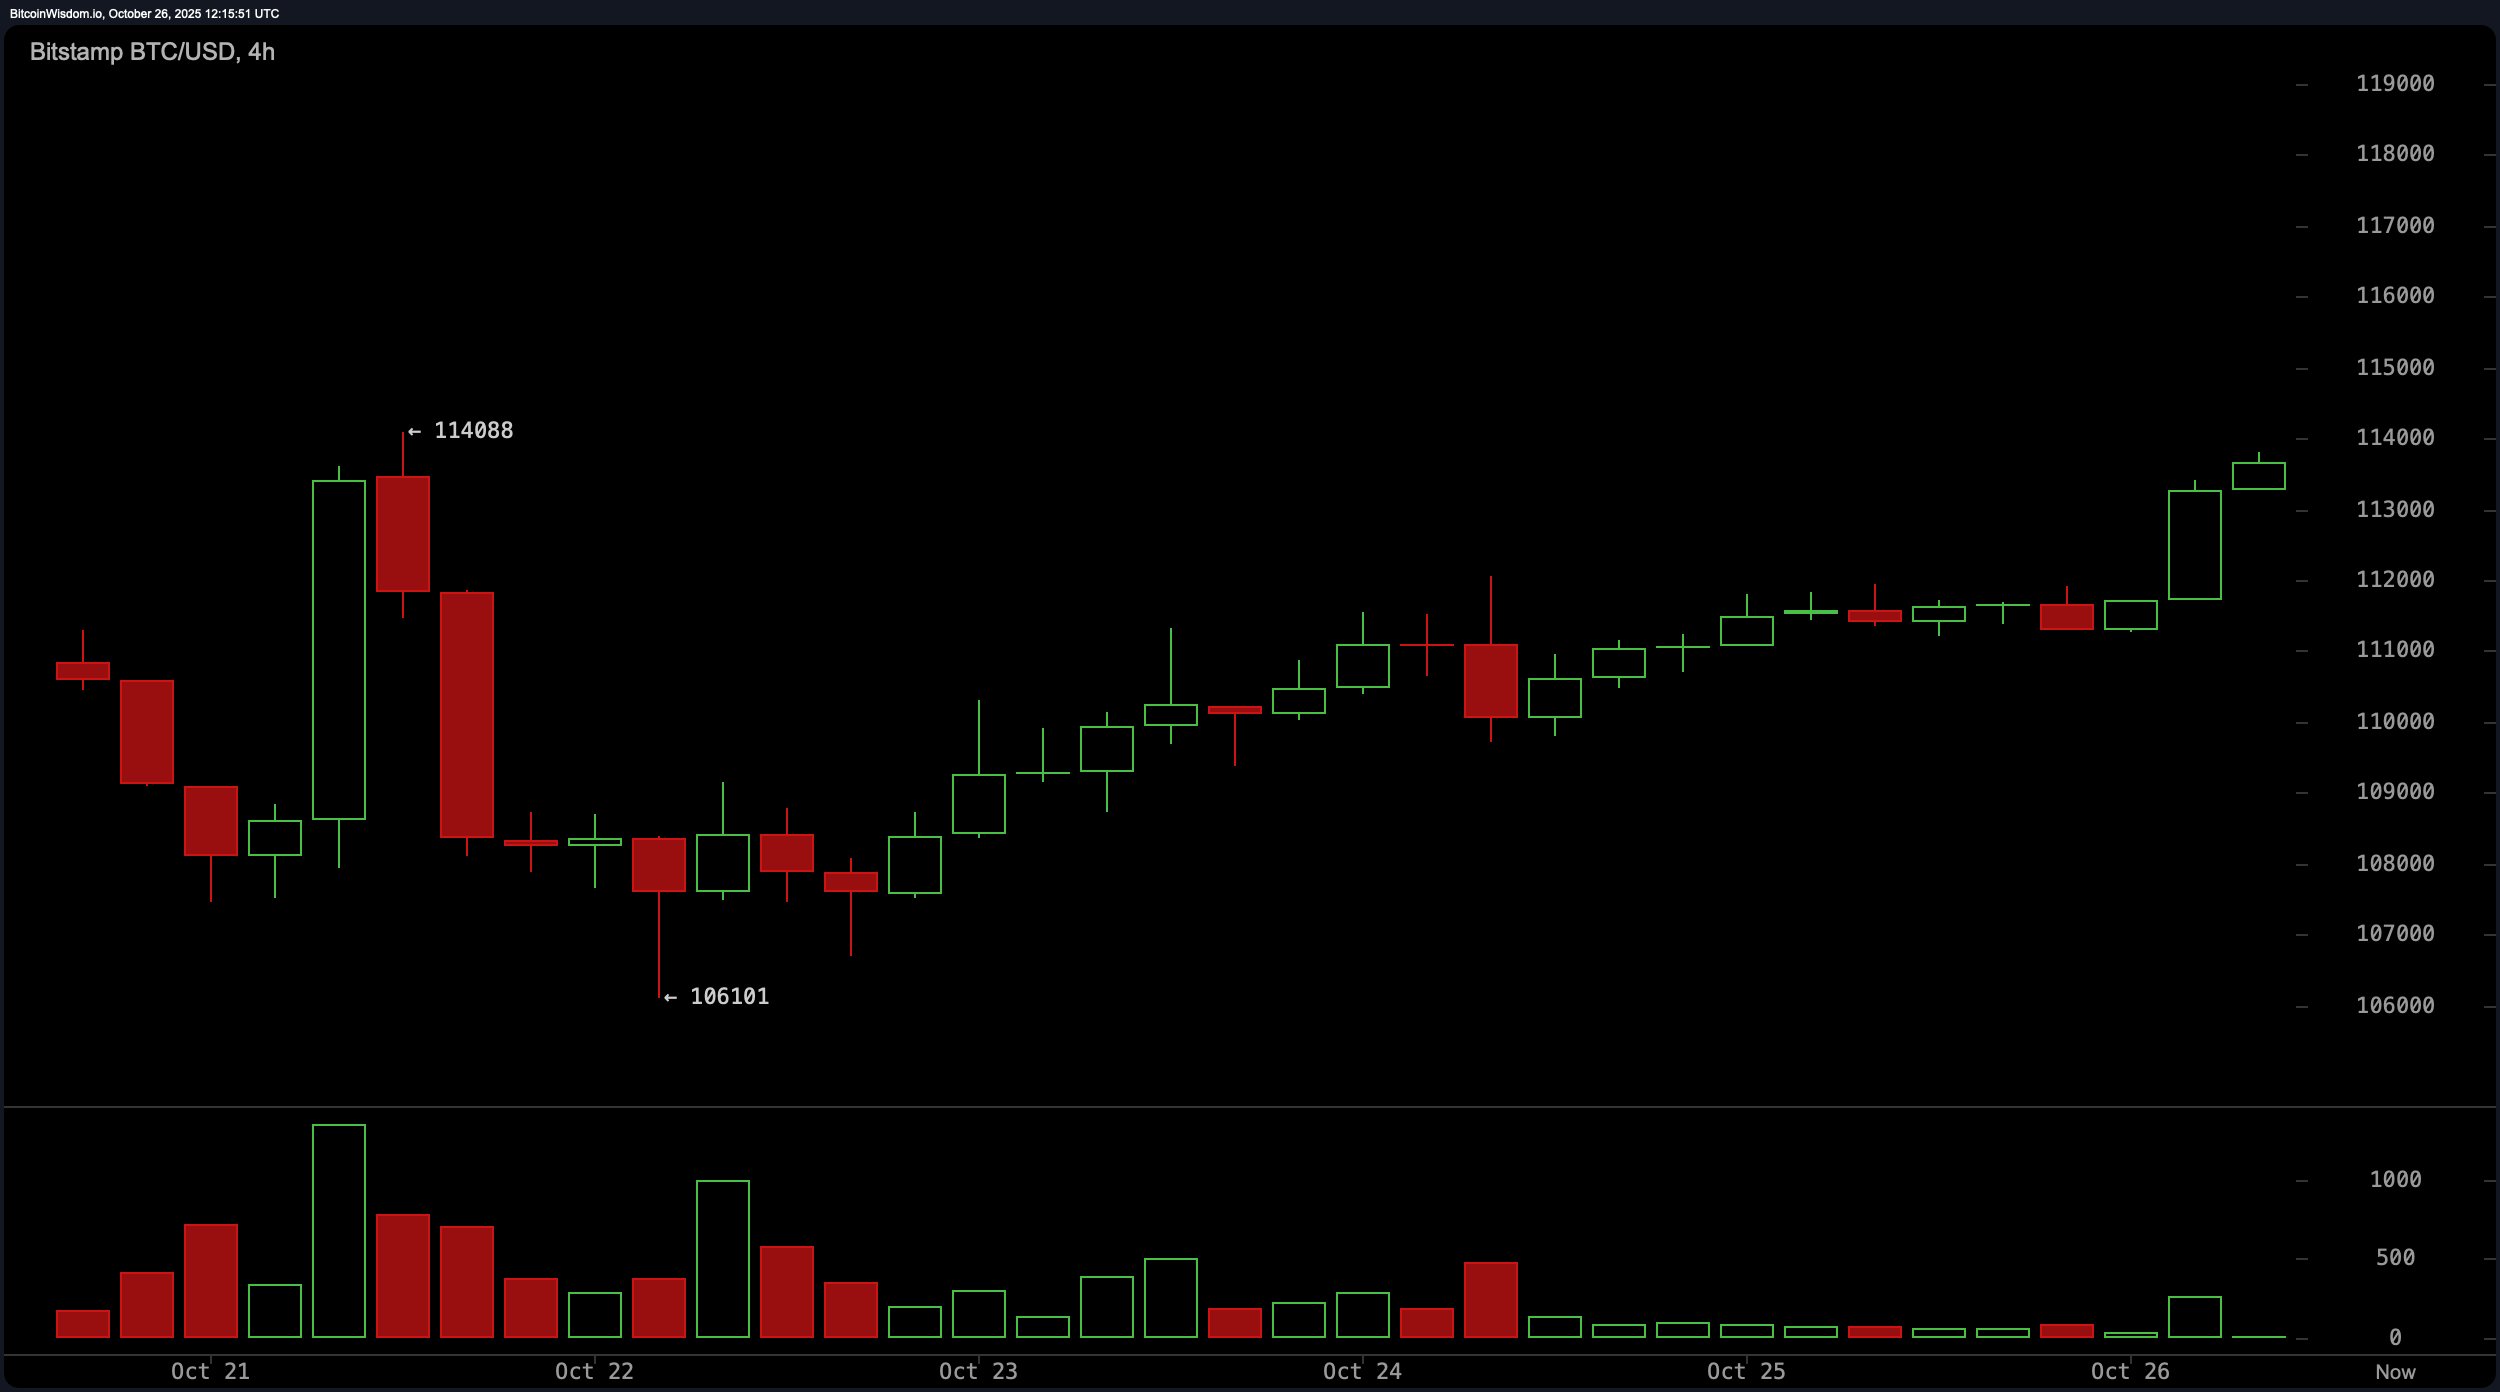
The 4-hour chart reveals a well-defined double bottom structure near $106,000, a technical pattern often interpreted as a potential reversal signal. Price action has since moved upward with small-bodied bullish candles and a notable breakout approaching $113,000, supported by a surge in volume. While the trend structure favors upward continuation, the movement lacks the acceleration typical of more aggressive rallies. Momentum may taper off as the price approaches previously tested resistance between $114,500 and $115,000, suggesting a possible consolidation or pause in the trend.

BTC/USD 4-hour chart via Bitstamp on Oct. 26, 2025.
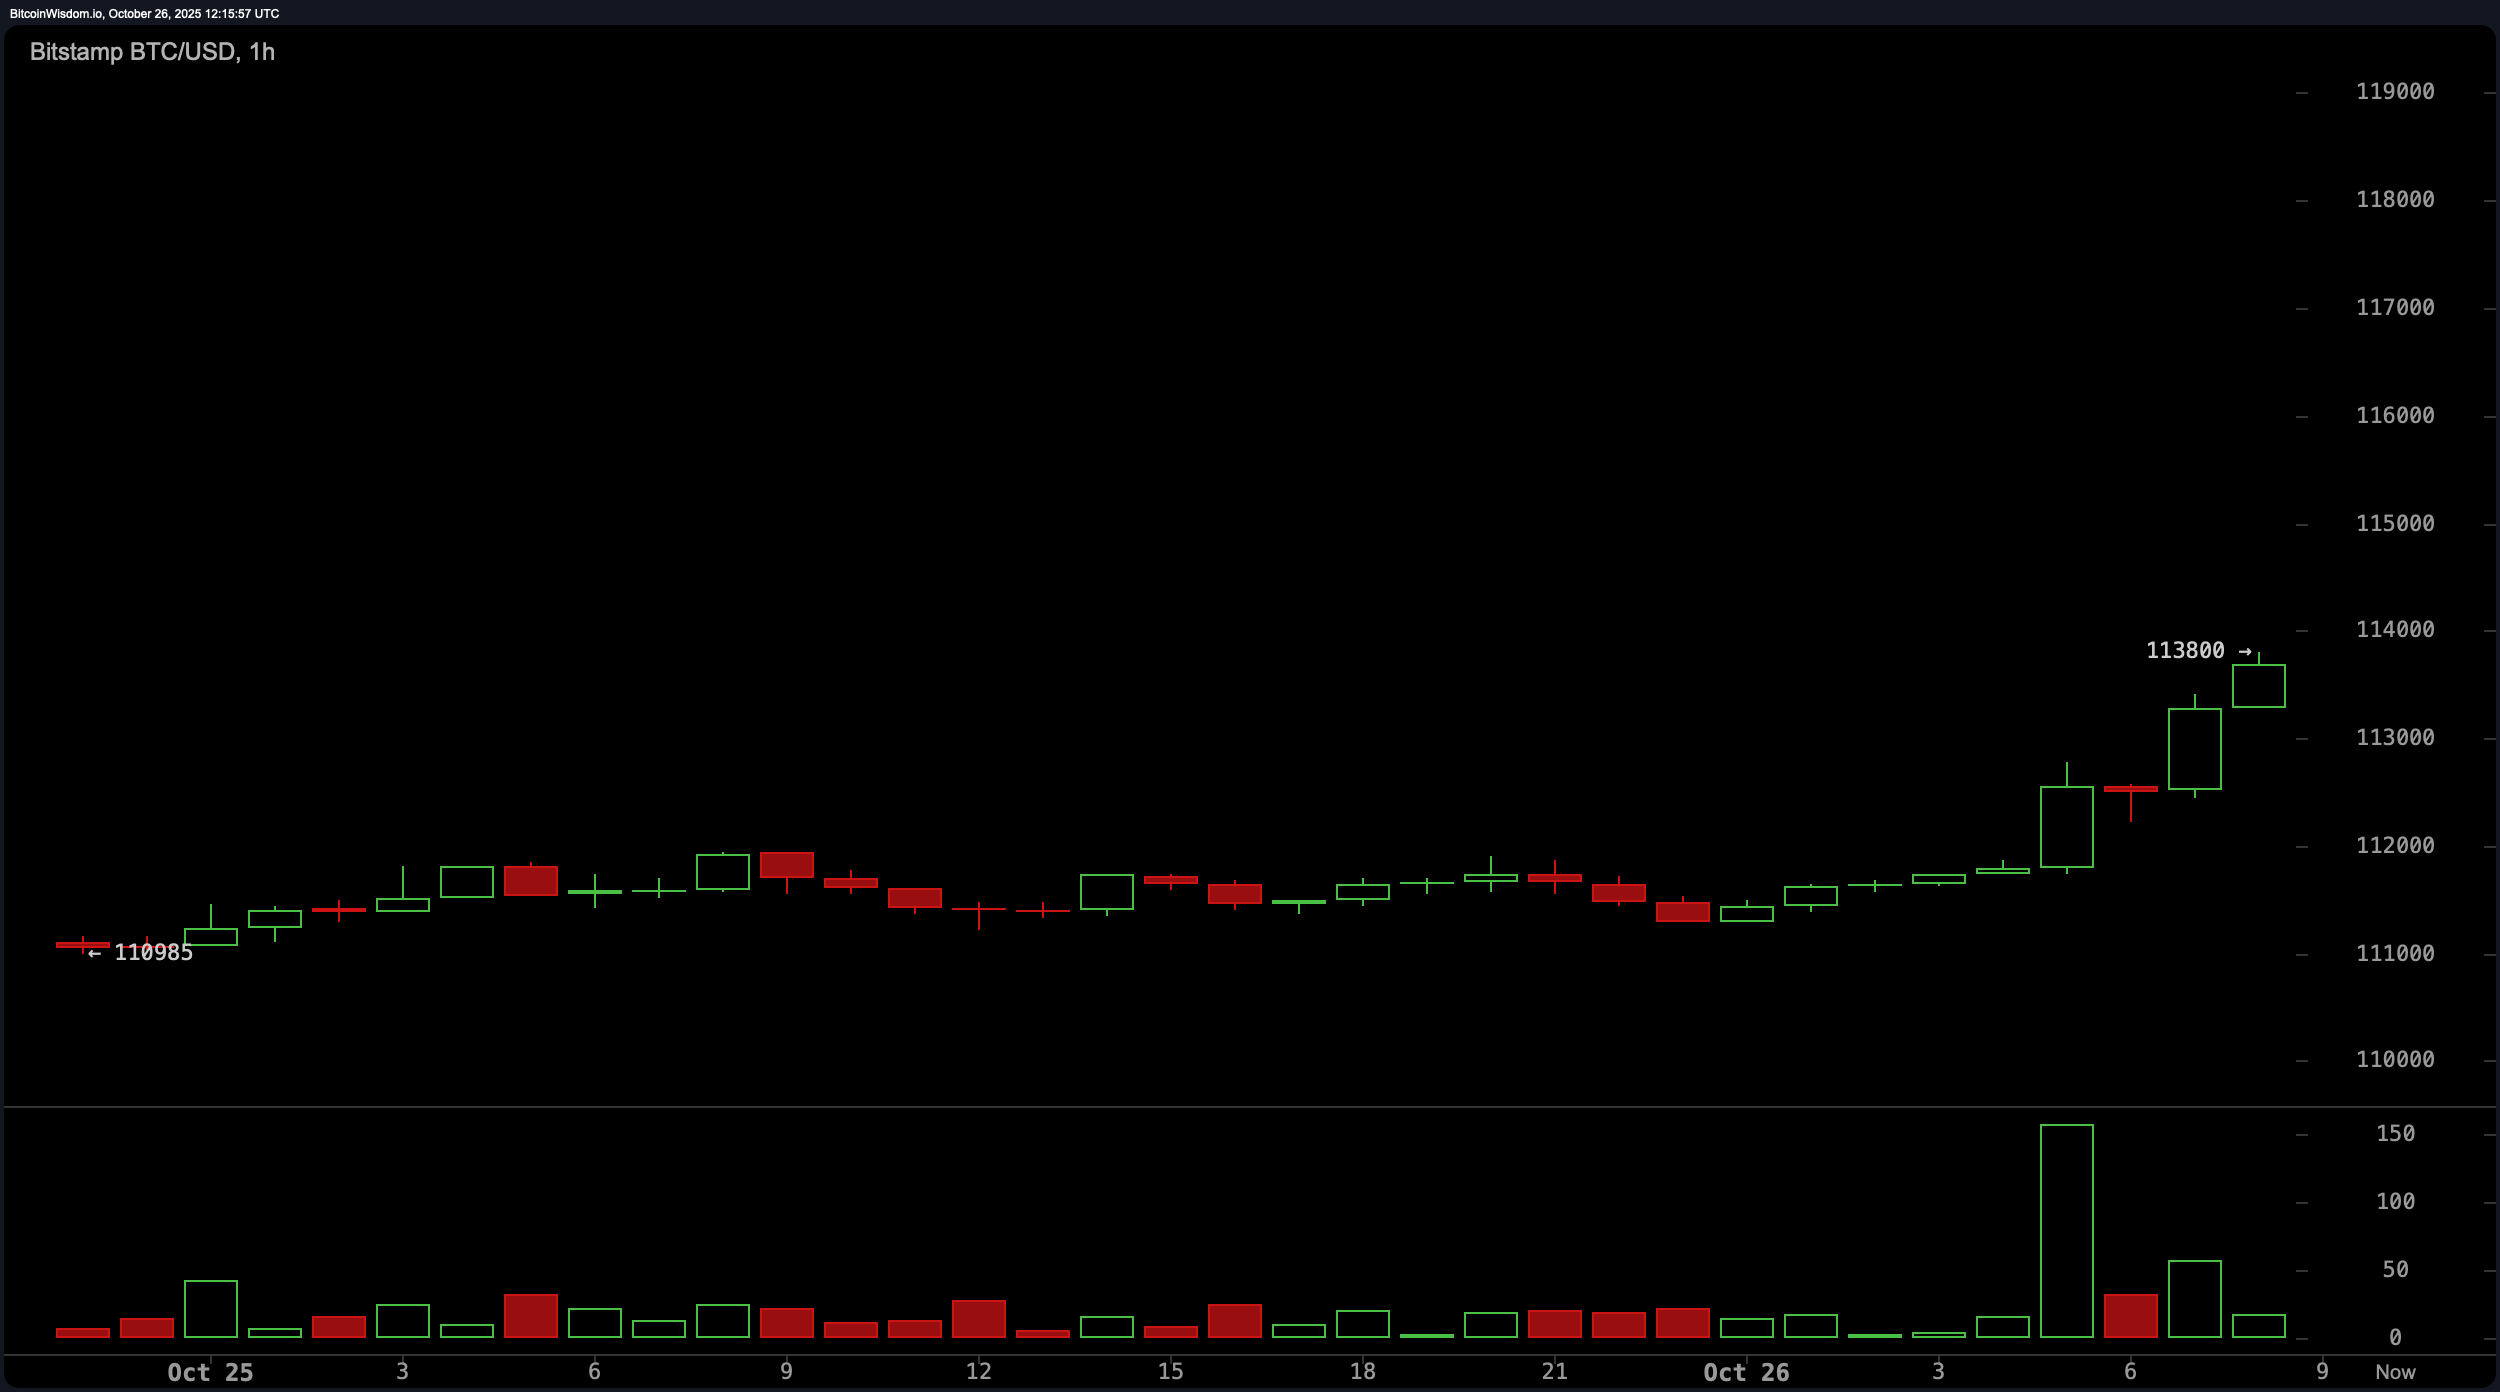
On the 1-hour chart, bitcoin has broken out from a previously range-bound pattern with a sharp thrust from $111,000 to $113,800, powered by high volume—a classic move often driven by breakout traders. The price is now consolidating above the breakout level, with potential support forming near $112,800 to $113,000. Should volume sustain, this level may serve as a launchpad for further short-term gains. However, any volume drop or rejection near $114,500 could signal exhaustion and open the door to short-term retracement.

BTC/USD 1-hour chart via Bitstamp on Oct. 26, 2025.
Oscillators remain largely neutral across the board, with the relative strength index (RSI) at 52 and the stochastic at 68, both indicating a lack of extreme momentum in either direction. The commodity channel index (CCI) holds at 4, while the average directional index (ADX) reads a low 19, further confirming a trend that is developing but not yet fully matured. However, positive momentum is observed, with the momentum indicator reading 5,174 and the moving average convergence divergence (MACD) level at -1,313—both suggesting a tilt toward positive price pressure.
Moving averages present a more bullish tilt across most timeframes, especially the exponential moving averages (EMAs), with the 10, 20, 30, 50, 100, and 200-period EMAs all trending above the current price level. Simple moving averages (SMAs), however, offer some resistance, particularly the 30, 50, and 100-period SMAs, which remain above the current price, implying friction as bitcoin attempts to maintain upward momentum. The alignment of EMAs below the current price generally reflects a supportive structure, though mixed SMA signals warn traders to tread carefully near historical resistance zones.
Bull Verdict:
With breakout confirmations on lower timeframes, bullish momentum from the momentum indicator and moving average convergence divergence (MACD), and a supportive alignment of exponential moving averages (EMAs), bitcoin appears poised to challenge upper resistance levels. Continued strength above $113,000 and a decisive push through the $115,000 zone could signal the next leg higher—pending volume cooperation.
Bear Verdict:
Despite recent gains, the rally’s soft volume and mixed simple moving average (SMA) signals suggest structural vulnerability beneath the surface. If bitcoin fails to hold above $113,000 or shows rejection near $113,500–$115,000, the recovery may stall, opening the door for a retest of lower support zones between $111,000 and $109,000.
- What is the current bitcoin price?
As of October 26, 2025, bitcoin is priced at $113,710. - What is bitcoin’s market cap today?
Bitcoin’s market capitalization stands at $2.25 trillion. - How much bitcoin was traded in the last 24 hours?
The 24-hour trading volume for bitcoin is $26.39 billion. - What is bitcoin’s intraday price range?
Bitcoin traded between $111,216 and $113,800 over the past 24 hours.
免责声明:本文章仅代表作者个人观点,不代表本平台的立场和观点。本文章仅供信息分享,不构成对任何人的任何投资建议。用户与作者之间的任何争议,与本平台无关。如网页中刊载的文章或图片涉及侵权,请提供相关的权利证明和身份证明发送邮件到support@aicoin.com,本平台相关工作人员将会进行核查。


