The daily chart (1D) offers a bird’s-eye view of a narrative pivot. After a grim descent from $4,759.9 to $3,379.5, ethereum began carving out a new chapter, printing higher lows and showing buyers clawing back control.
The current bullish candles are flirting with the $4,100–$4,200 resistance zone, a level ethereum has yet to conquer with conviction. Volume during this recovery phase is rising—green candles backed by swelling buy pressure suggest real muscle behind the move. The macro tone? If ethereum holds above $4,000, this could mark the early innings of a medium-term bullish stretch.
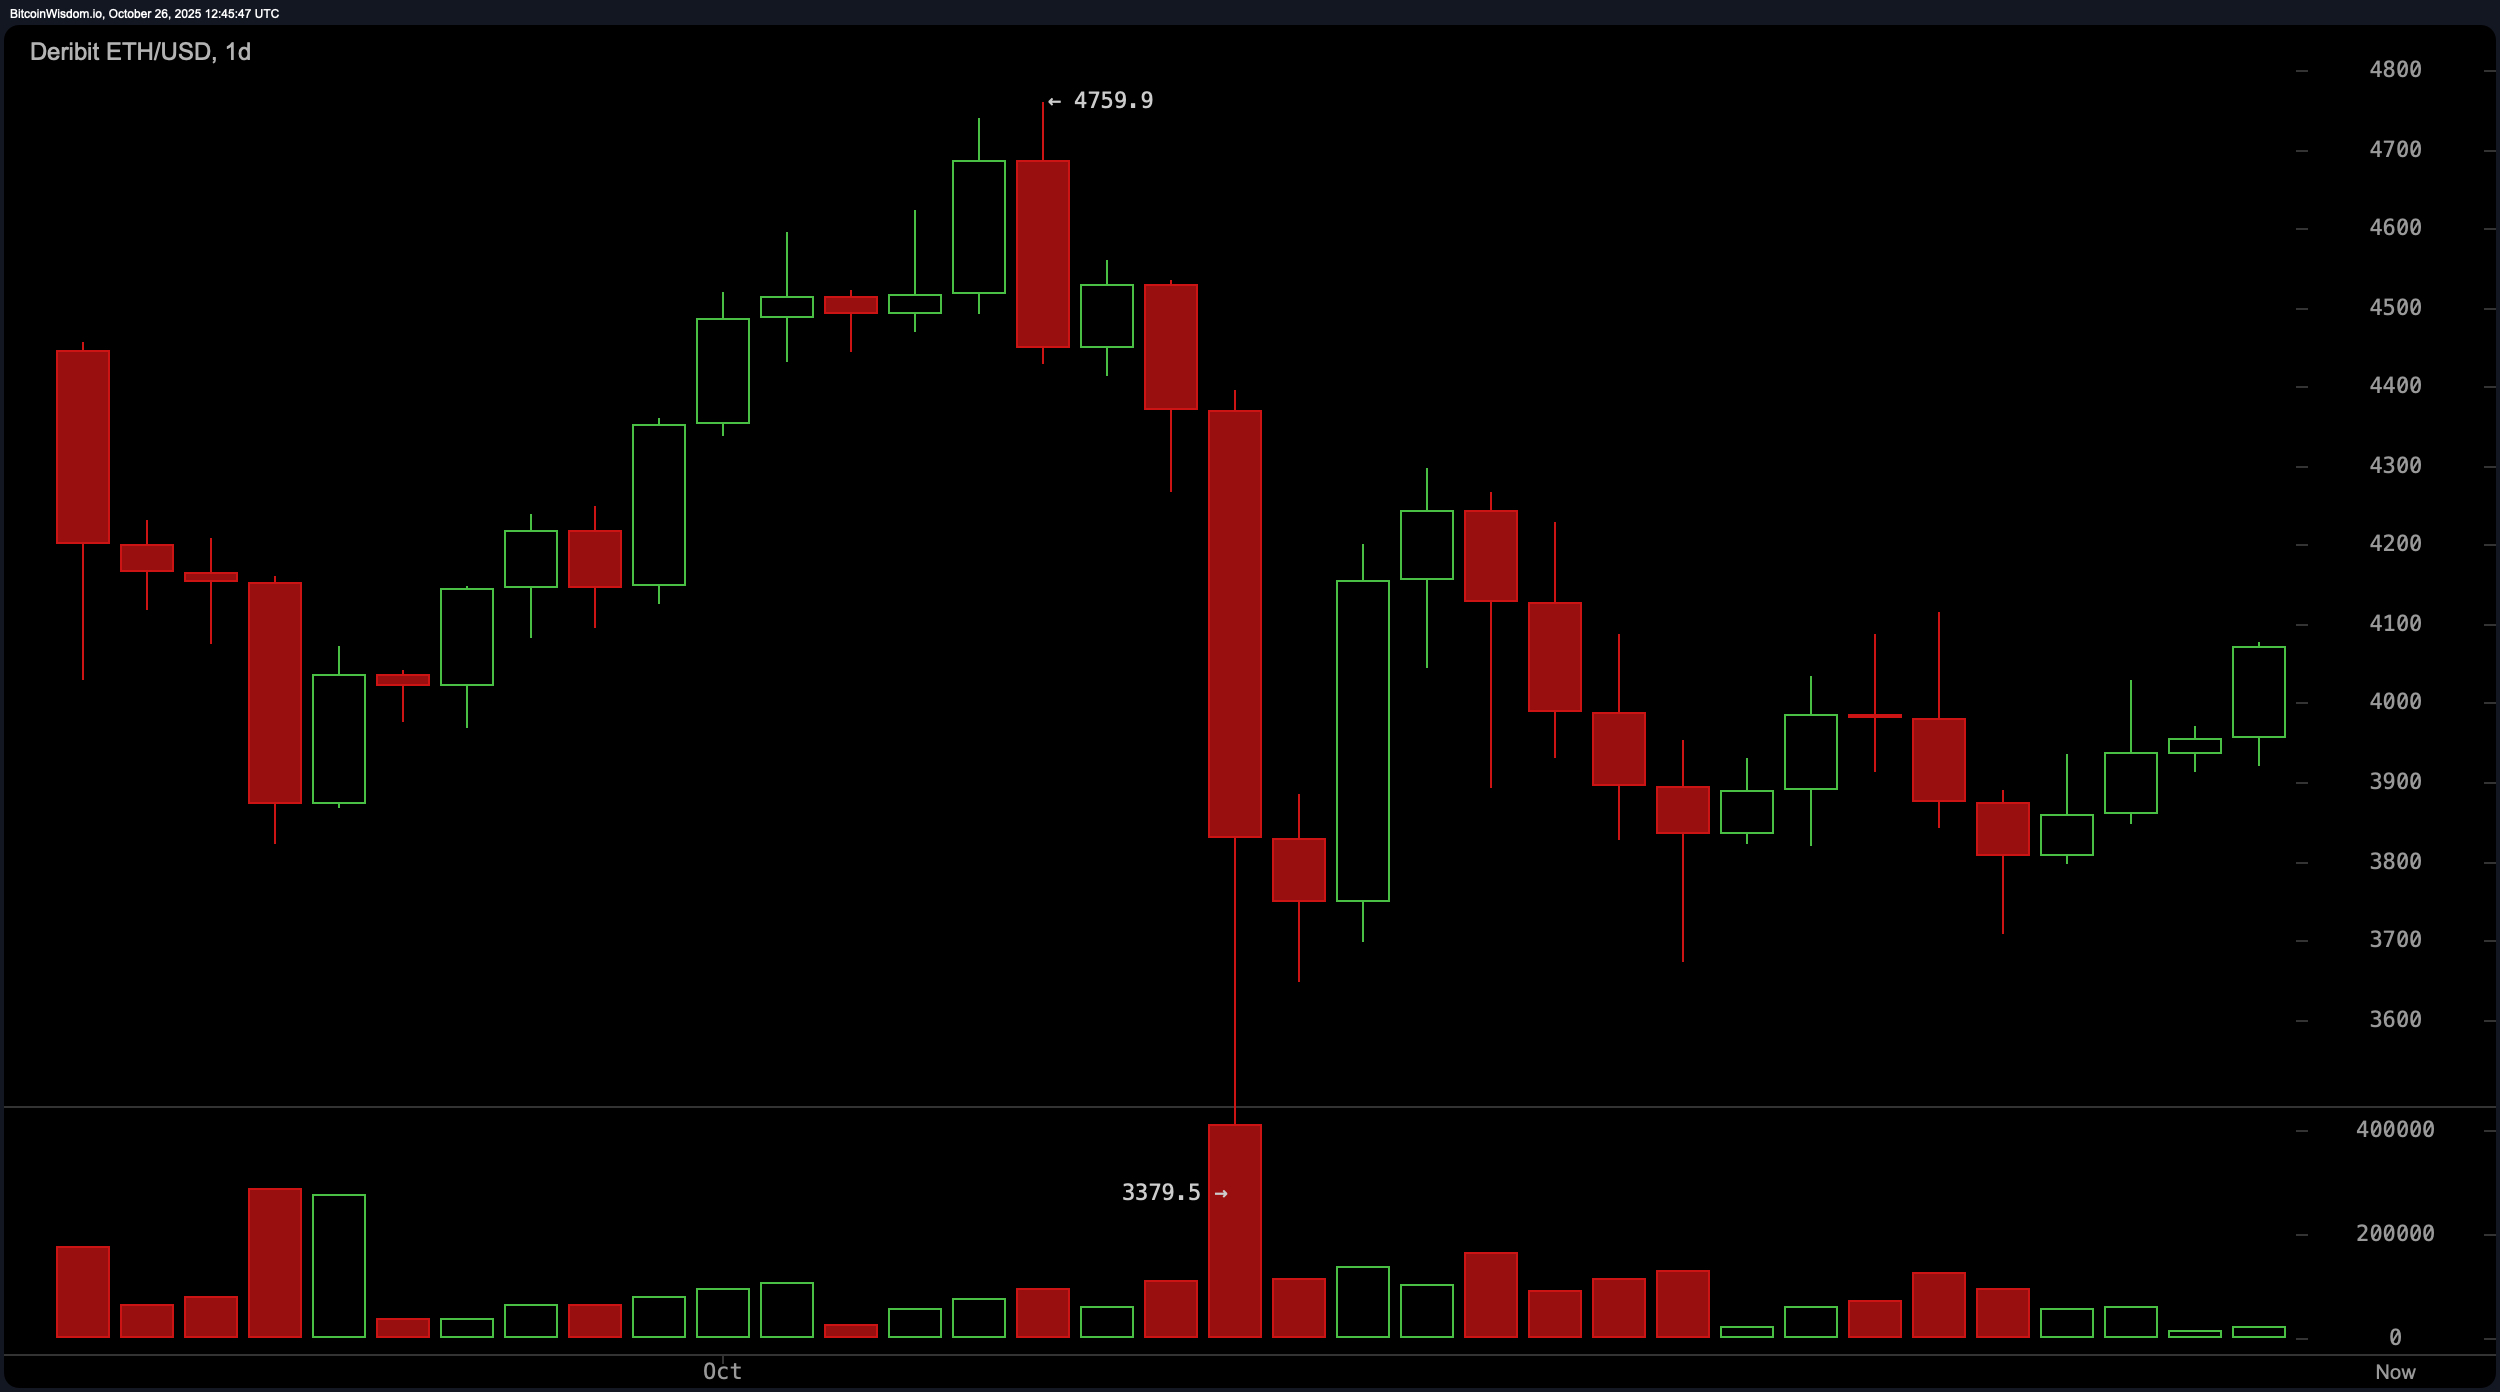
ETH/USD chart via Deribit, 1-day chart on Oct. 26, 2025.
Shifting to the 4-hour chart (4H), ethereum’s bounce off $3,708.1 has evolved into a rounded bottom pattern, a classic shape for a trend reversal—like a phoenix with digital feathers. The breakout above $3,950 came with high volume, signaling serious commitment from market participants. A clean structure of higher lows and surging candles aligns with a bullish setup, especially with momentum accelerating toward the next resistance at $4,100 and $4,200. The short-term target here remains conservative, hovering around that same resistance level. But traders should note the importance of maintaining above $3,875 to validate the structure.
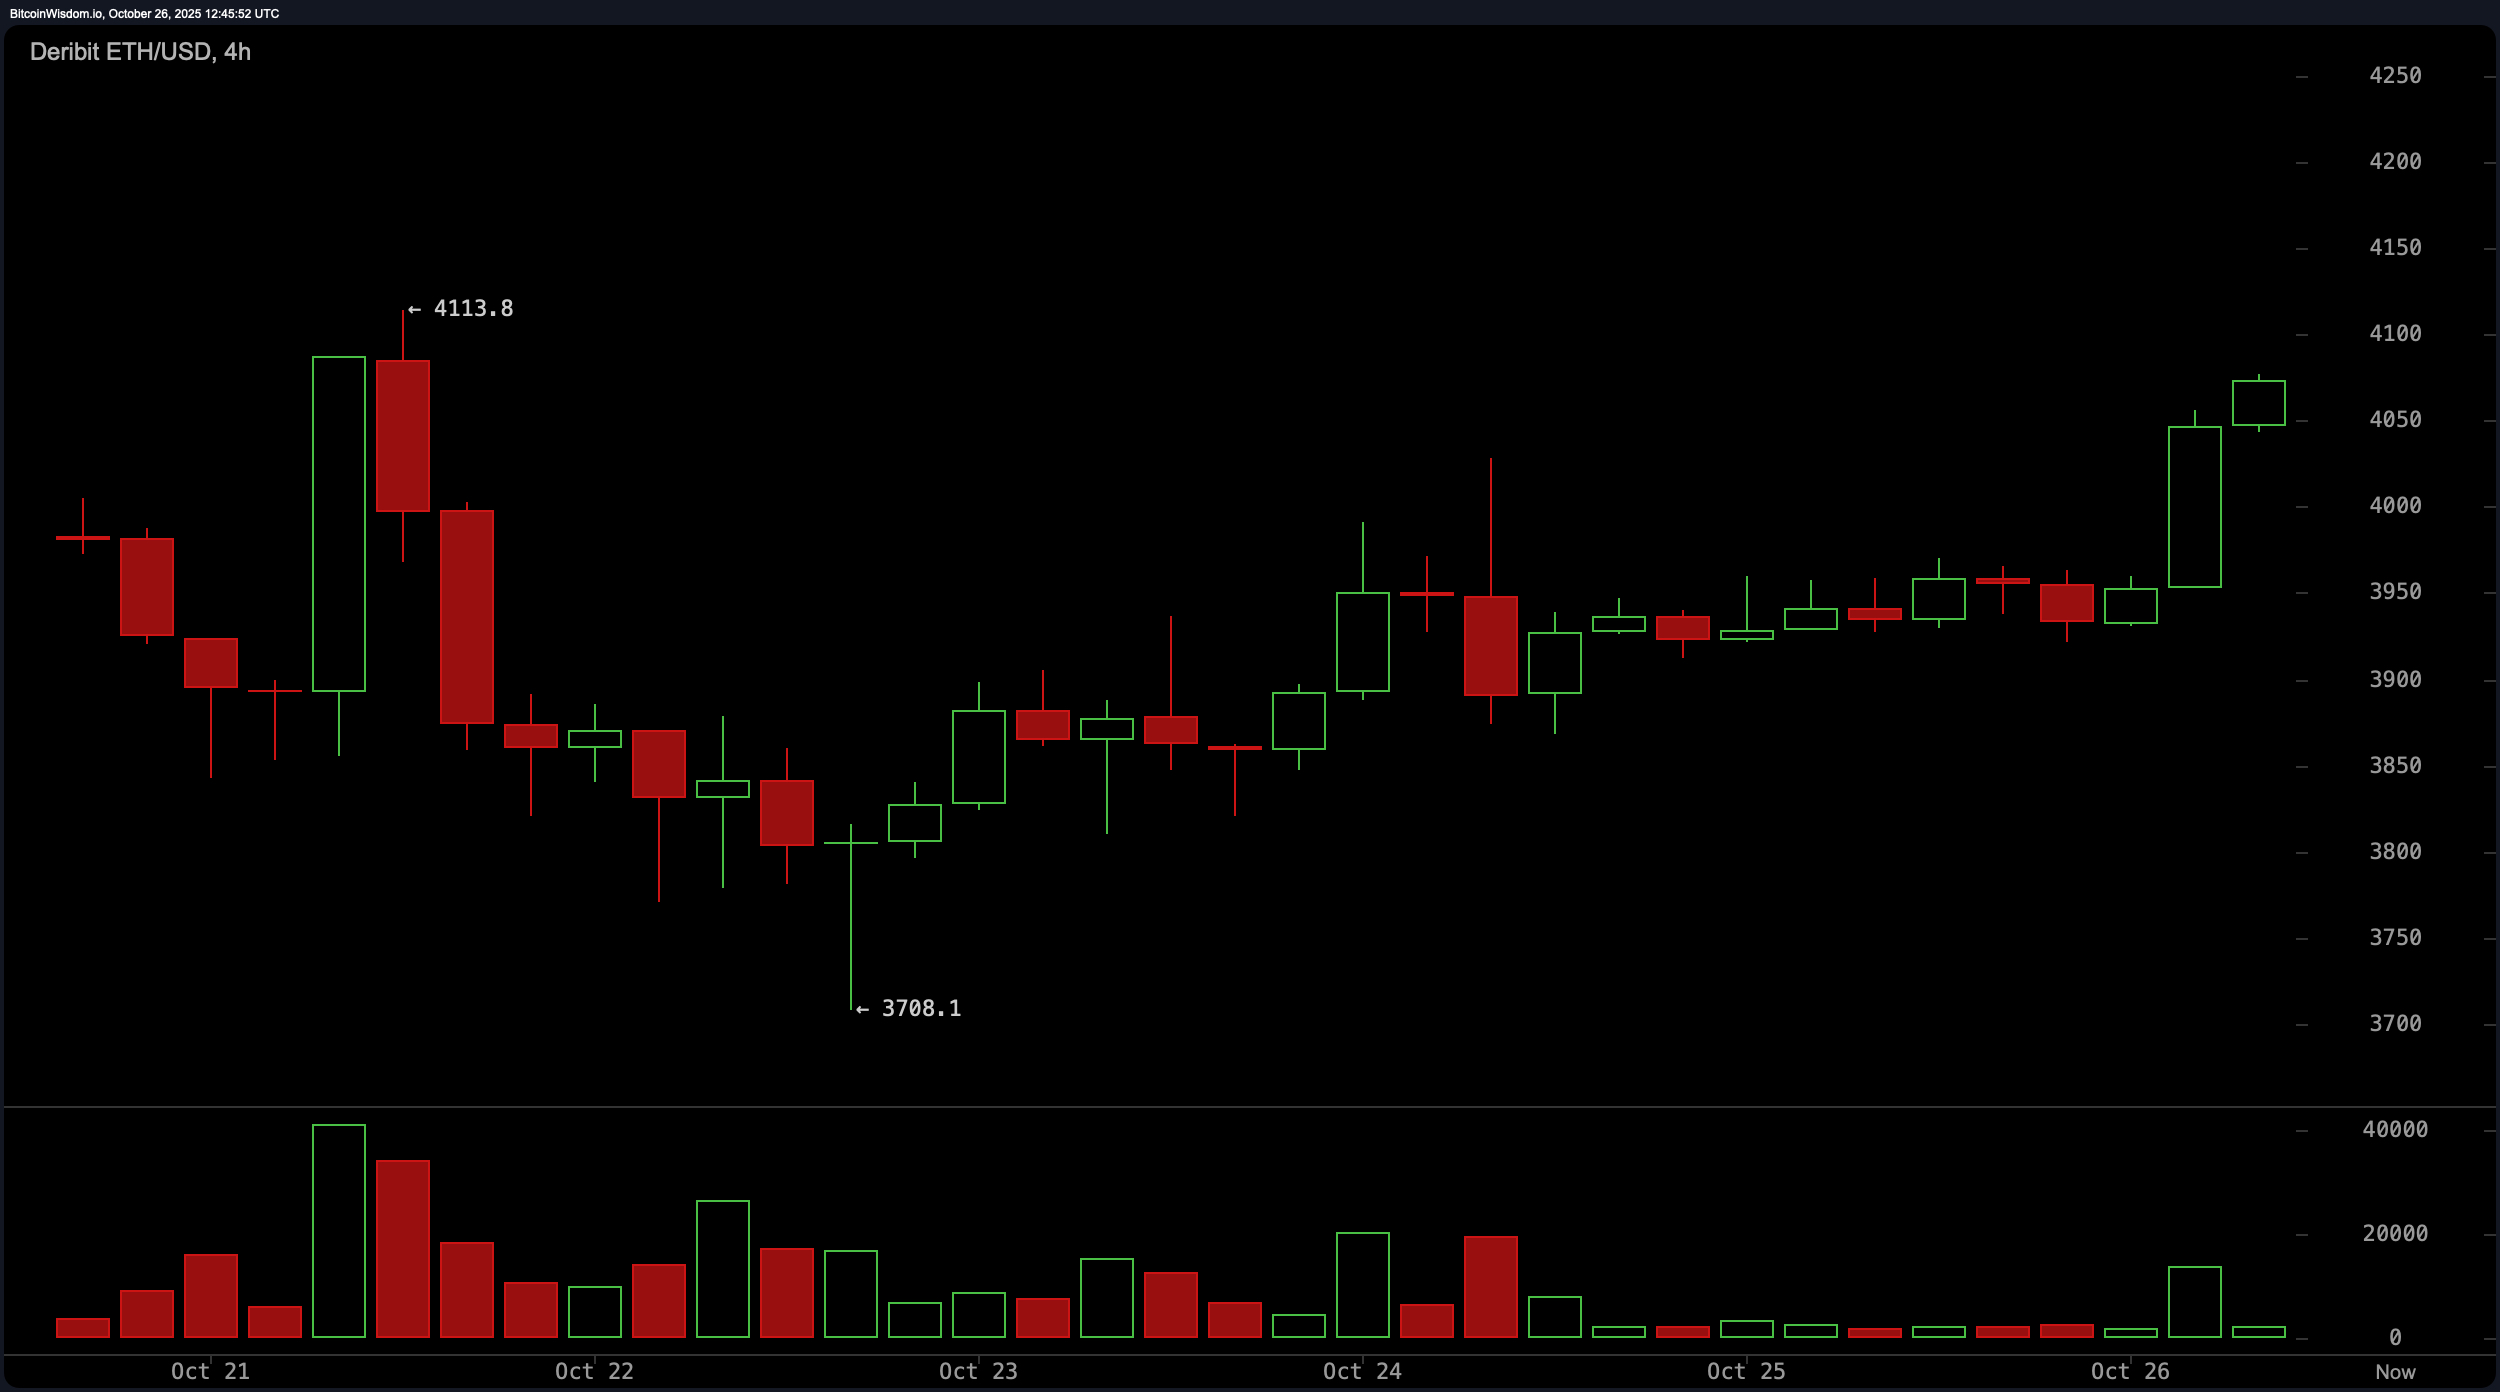
ETH/USD chart via Deribit, 4-hour chart on Oct. 26, 2025.
On the 1-hour chart (1H), ethereum is all gas, no brakes. It surged toward the session high of $4,081.9, riding a burst of early-session enthusiasm. The structure is textbook: a buildup of smaller candles morphing into large green breakouts, supported by a solid spike in volume. However, it’s not immune to short-term frothiness. A pullback to the $4,000–$4,025 range could provide a strategic re-entry, especially if the price consolidates before another leg up. With tight risk control below $3,985, scalpers may find the $4,090–$4,100 zone ripe for action.
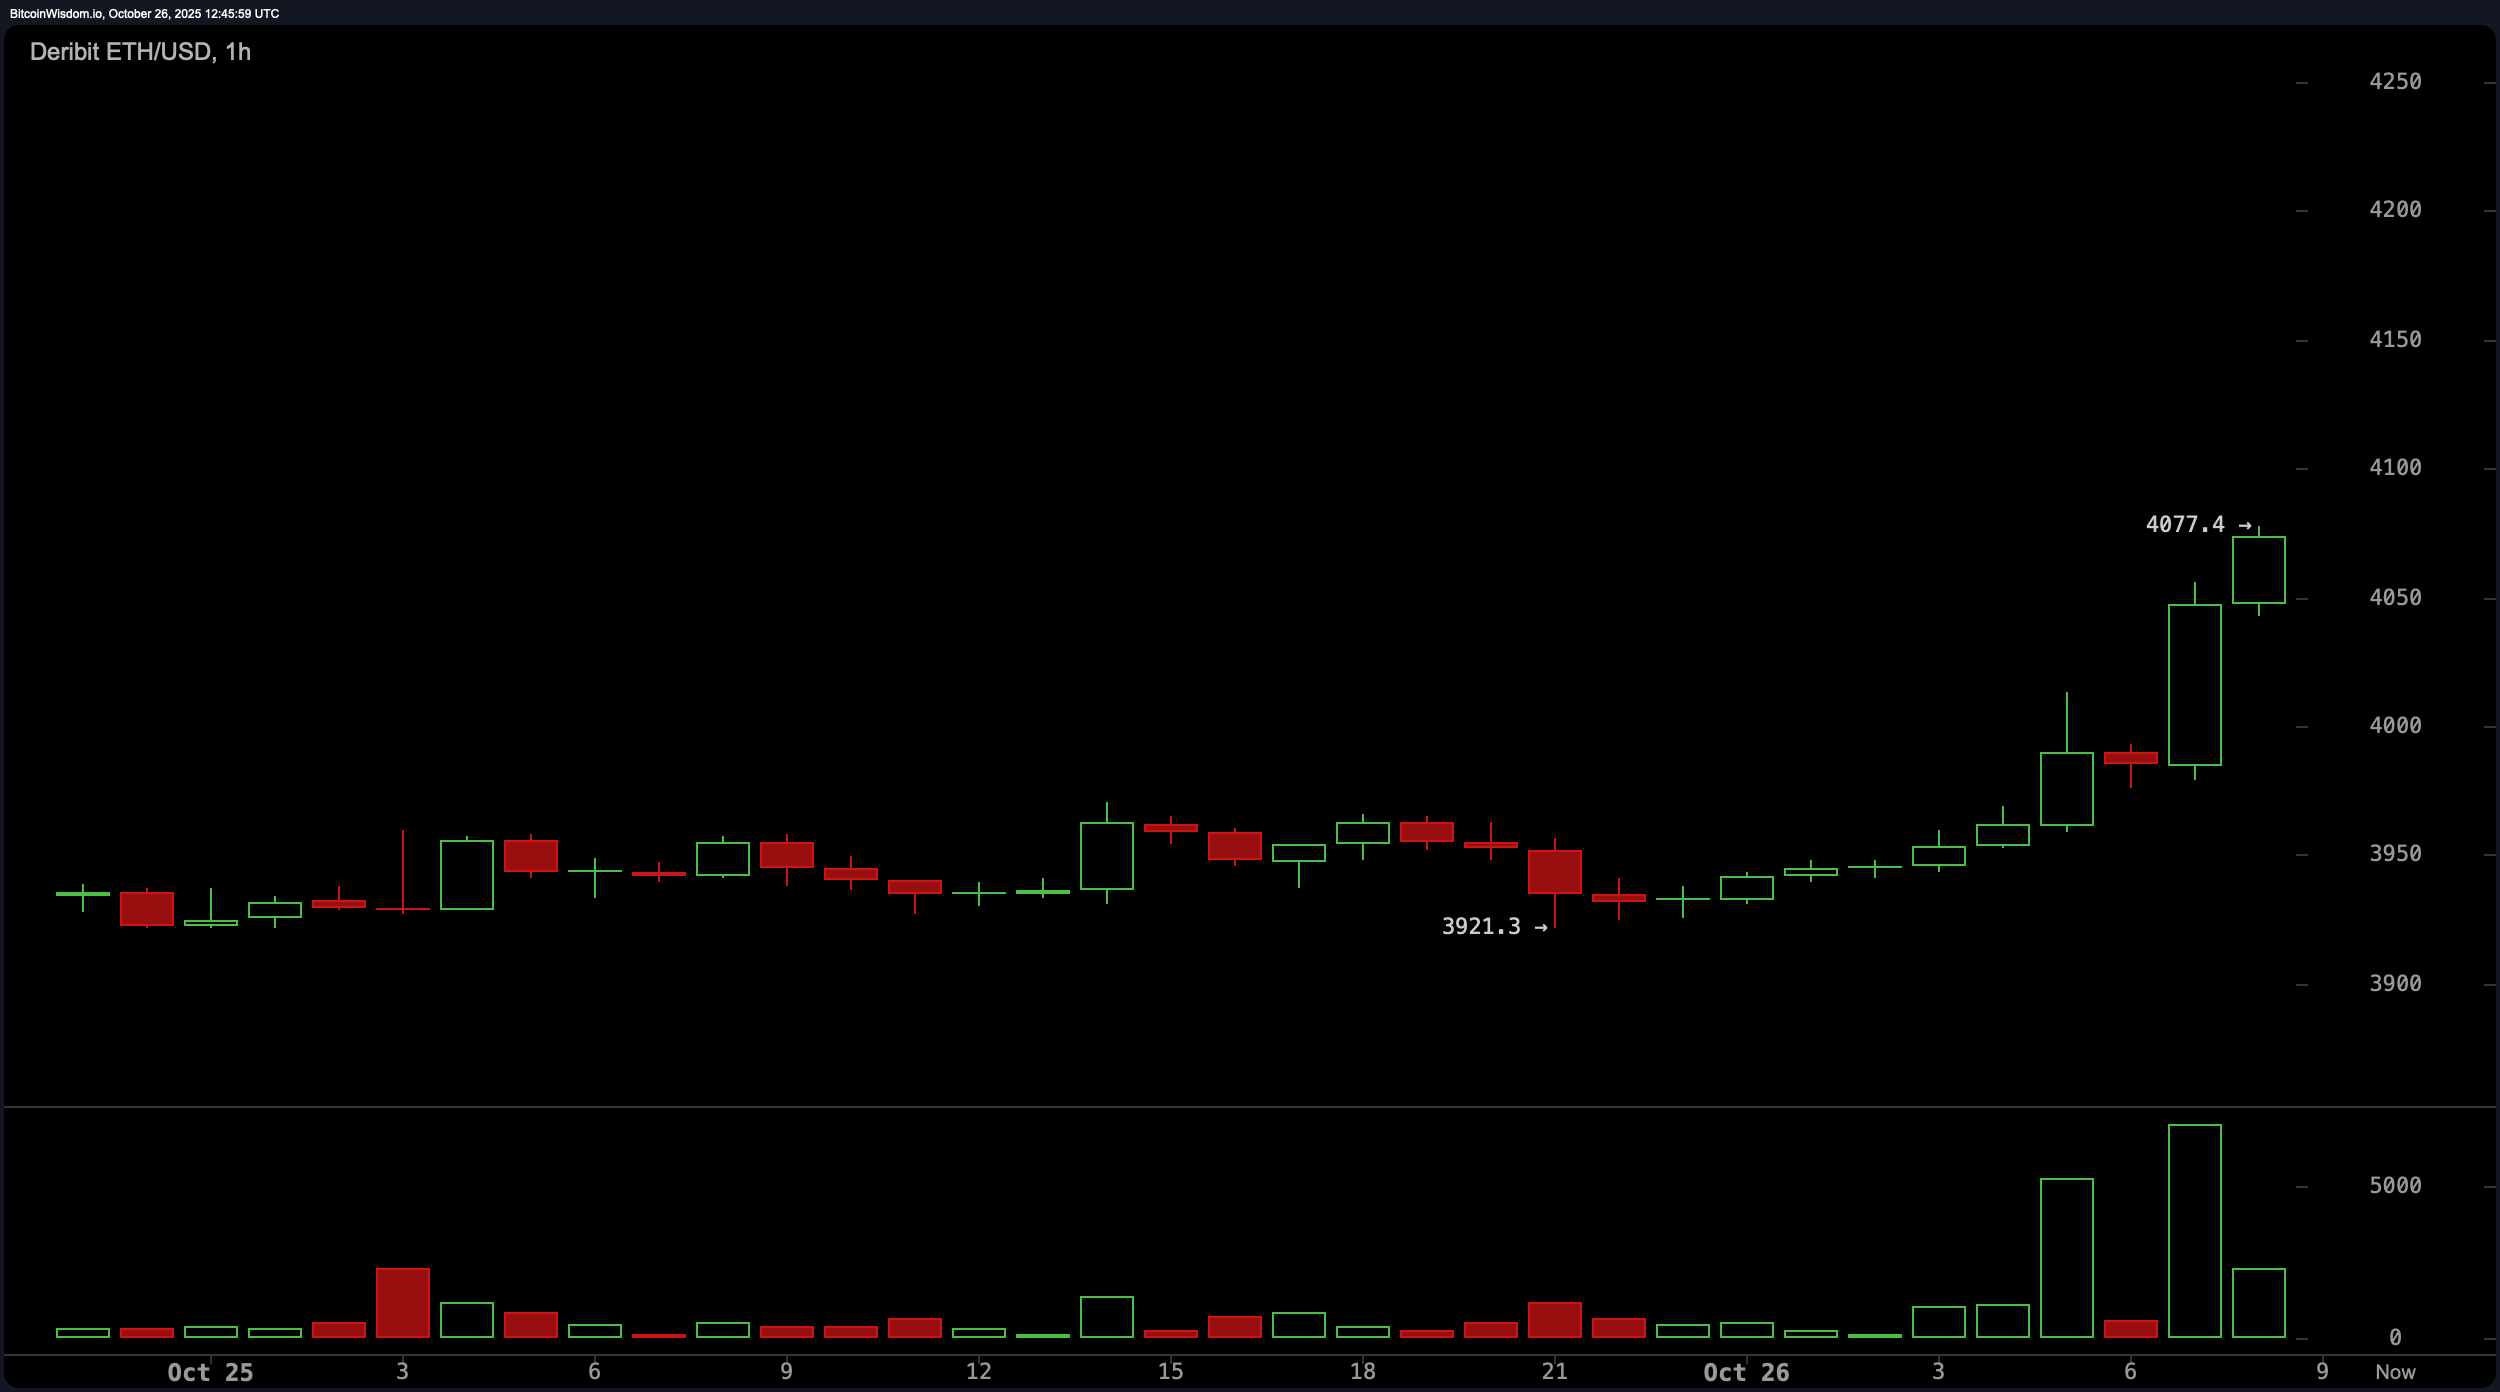
ETH/USD chart via Deribit, 1-hour chart on Oct. 26, 2025.
Oscillators paint a neutral-to-positive tone. The relative strength index (RSI) sits at 49.5—neither overbought nor oversold, leaving the door open. The stochastic oscillator mirrors this with a mild 50.2, and the commodity channel index (CCI) holds a flat −4.9. The average directional index (ADX) at 21.1 suggests trend strength is still soft, so directional commitment may take time to solidify. The awesome oscillator reads −210.8, indicating short-term weakness is giving way. Meanwhile, momentum sits strong at 161.6, and the moving average convergence divergence (MACD) is perched at −91.5, both suggesting upside initiative is in play.
Moving averages, however, are less harmonious. The short-term exponential moving average (EMA 10) at $3,961.7 and simple moving average (SMA 10) at $3,917.3 support the upside narrative. EMAs and SMAs for 20 periods also lean positive. But once you stretch to the 30, 50, and 100-period averages, the tune changes—bearish signals reemerge. The 30-period simple moving average sits at $4,136.4 and the 50-period EMA at $4,124.2, both pointing down. This mixed bag underscores ethereum’s current dilemma: strong short-term enthusiasm facing down entrenched resistance above.
In summary, ethereum is showing signs of recovery, but it’s not cruising past $4,100 without a challenge. The multi-timeframe setup skews bullish for now, yet the resistance zone above remains a test of market conviction and staying power.
Bull Verdict:
If ethereum maintains momentum above the $4,000 threshold and pushes through the $4,100–$4,200 resistance zone on strong volume, the stage could be set for a sustained upward move. With short-term indicators aligned and buyer interest returning, the market may be gearing up for a breakout rather than a fade.
Bear Verdict:
Despite recent gains, ethereum remains boxed in below a stubborn resistance ceiling, with long-term moving averages still flashing red. If volume falters and price fails to close above $4,100 decisively, the current rally may fizzle into another lower high in a broader consolidation cycle.
- Where is ethereum trading now?
Ethereum is currently priced at $4,059 with resistance near the $4,100–$4,200 zone. - Is ethereum showing bullish momentum?
Yes, short-term charts indicate upward momentum supported by rising volume. - What’s the key support level to watch?
Key support sits around $3,875, with $4,000 acting as a short-term pivot. - What could signal a breakout?
A decisive close above $4,200 on strong volume would confirm bullish continuation.
免责声明:本文章仅代表作者个人观点,不代表本平台的立场和观点。本文章仅供信息分享,不构成对任何人的任何投资建议。用户与作者之间的任何争议,与本平台无关。如网页中刊载的文章或图片涉及侵权,请提供相关的权利证明和身份证明发送邮件到support@aicoin.com,本平台相关工作人员将会进行核查。