Today is the last day of October 30th, let's take a look at the overall market trend.
In the early morning, a meeting in Buffett's time clearly sent a bearish signal, turning good news into bad news, which will likely leave many small retail investors feeling confused.
Why is it still falling despite interest rate cuts? Many times in the trading field, one must adhere to a principle: buy the expectation, sell the fact. However, the moment good news is realized often marks the beginning of bad news.
Now, let's return to the charts. From the daily chart perspective, the overall bearish pattern is clearly not over yet, and the double top position has not been well established.
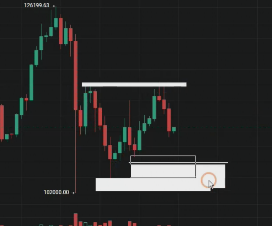
Therefore, the rebound is still primarily bearish. So, at what specific position can we go long? Currently, if we talk about Bitcoin, to establish a bullish trend, it must stabilize above 113,700. Only by holding this position can the bullish trend continue.
If it breaks through this position again, then obviously we can go long on the pullback.
If this position cannot be reached, then the current pullback to 112,000 and 111,260 are all short positions.
From the current overall structure, the position is very clear, with a pullback and a search for a bottom, so it is evident that the lower area to seek a bottom is around this region, specifically the range of 107,500-106,700.
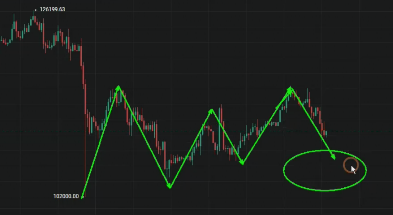
If it can break down again here
Then it is clear that it will need to go down to the positions of 103,500-102,000 to seek a bottom.
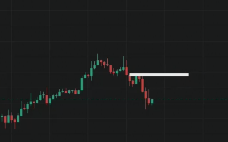
Ethereum is currently basically the same as Bitcoin; the daily chart's bearish perspective has not completely emerged. In the smaller timeframe, it attempted to touch 4030 twice yesterday but failed to break through.
Next, for Ethereum to establish a bullish trend, it must first break the 4030 level. Only after breaking 4030 can it continue to push upward.
If it cannot break 4030, then this position will revert to the previous rebound.
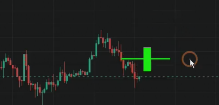
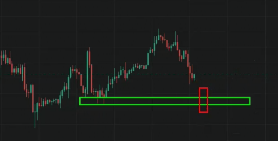
Looking at the hourly chart, the current rebound area, which is 3947-3958, is where we can enter short positions. This means that before breaking 4030, these positions are all for shorting. Until it breaks through the resistance levels one by one, it can then push upward.
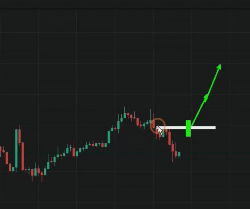
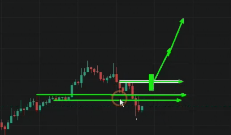
From where? From above 4030, it can push upward again to establish a bullish trend. Before it can break out of these positions, Ethereum will similarly need to seek a bottom in the lower area, with the bottom being around 3,710 to 3,750, which is the current visible bottom-seeking position.
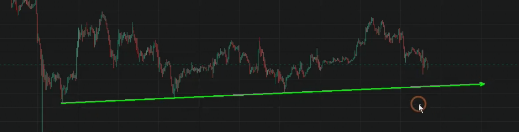
Only after it can break through can we choose a direction. If it breaks down again below 3,700, it will have to return to the previous black swan point, which is around 3,400 to seek a bottom.
So currently, the bearish pattern remains unchanged, and we still maintain a mindset focused on shorting. Therefore, for some small retail investors and new partners who are unsure about the direction and struggle to pinpoint positions, you can follow the public account BTC-ETH Crypto.

免责声明:本文章仅代表作者个人观点,不代表本平台的立场和观点。本文章仅供信息分享,不构成对任何人的任何投资建议。用户与作者之间的任何争议,与本平台无关。如网页中刊载的文章或图片涉及侵权,请提供相关的权利证明和身份证明发送邮件到support@aicoin.com,本平台相关工作人员将会进行核查。