The Federal Reserve made a key decision at 2 AM today, with Chairman Powell announcing a 25 basis point rate cut, bringing the federal funds rate range to 3.75%-4%. He also announced the cessation of balance sheet reduction starting December 1, effectively pausing quantitative tightening.
Although these two decisions clearly indicate a more accommodative stance, the subsequent press conference delivered a heavy blow to the market. He stated that further rate cuts in December are not a foregone conclusion and are not set in stone. Following this news, the market's expectation of a rate cut in December dropped from 90% to 71%.
At the same time, Powell mentioned in the press conference that the U.S. economy is caught in a dual risk scenario, with slowing job growth and a slight increase in the unemployment rate, indicating weakening growth momentum. However, core inflation remains high at 2.8%, above the 2% target.
After Powell's dovish then hawkish remarks were released, U.S. stock market trends diverged, with the S&P index's gains narrowing, the Dow Jones index falling by 0.16%, and the Nasdaq index rising by 0.55%. In contrast, Bitcoin briefly spiked to $109,145 at the time of the announcement, and although it rebounded, it faced a second bottom test, dropping to a low of $107,817 by noon today, with the price at the time of writing being $108,255.
Bitcoin Four-Hour Chart
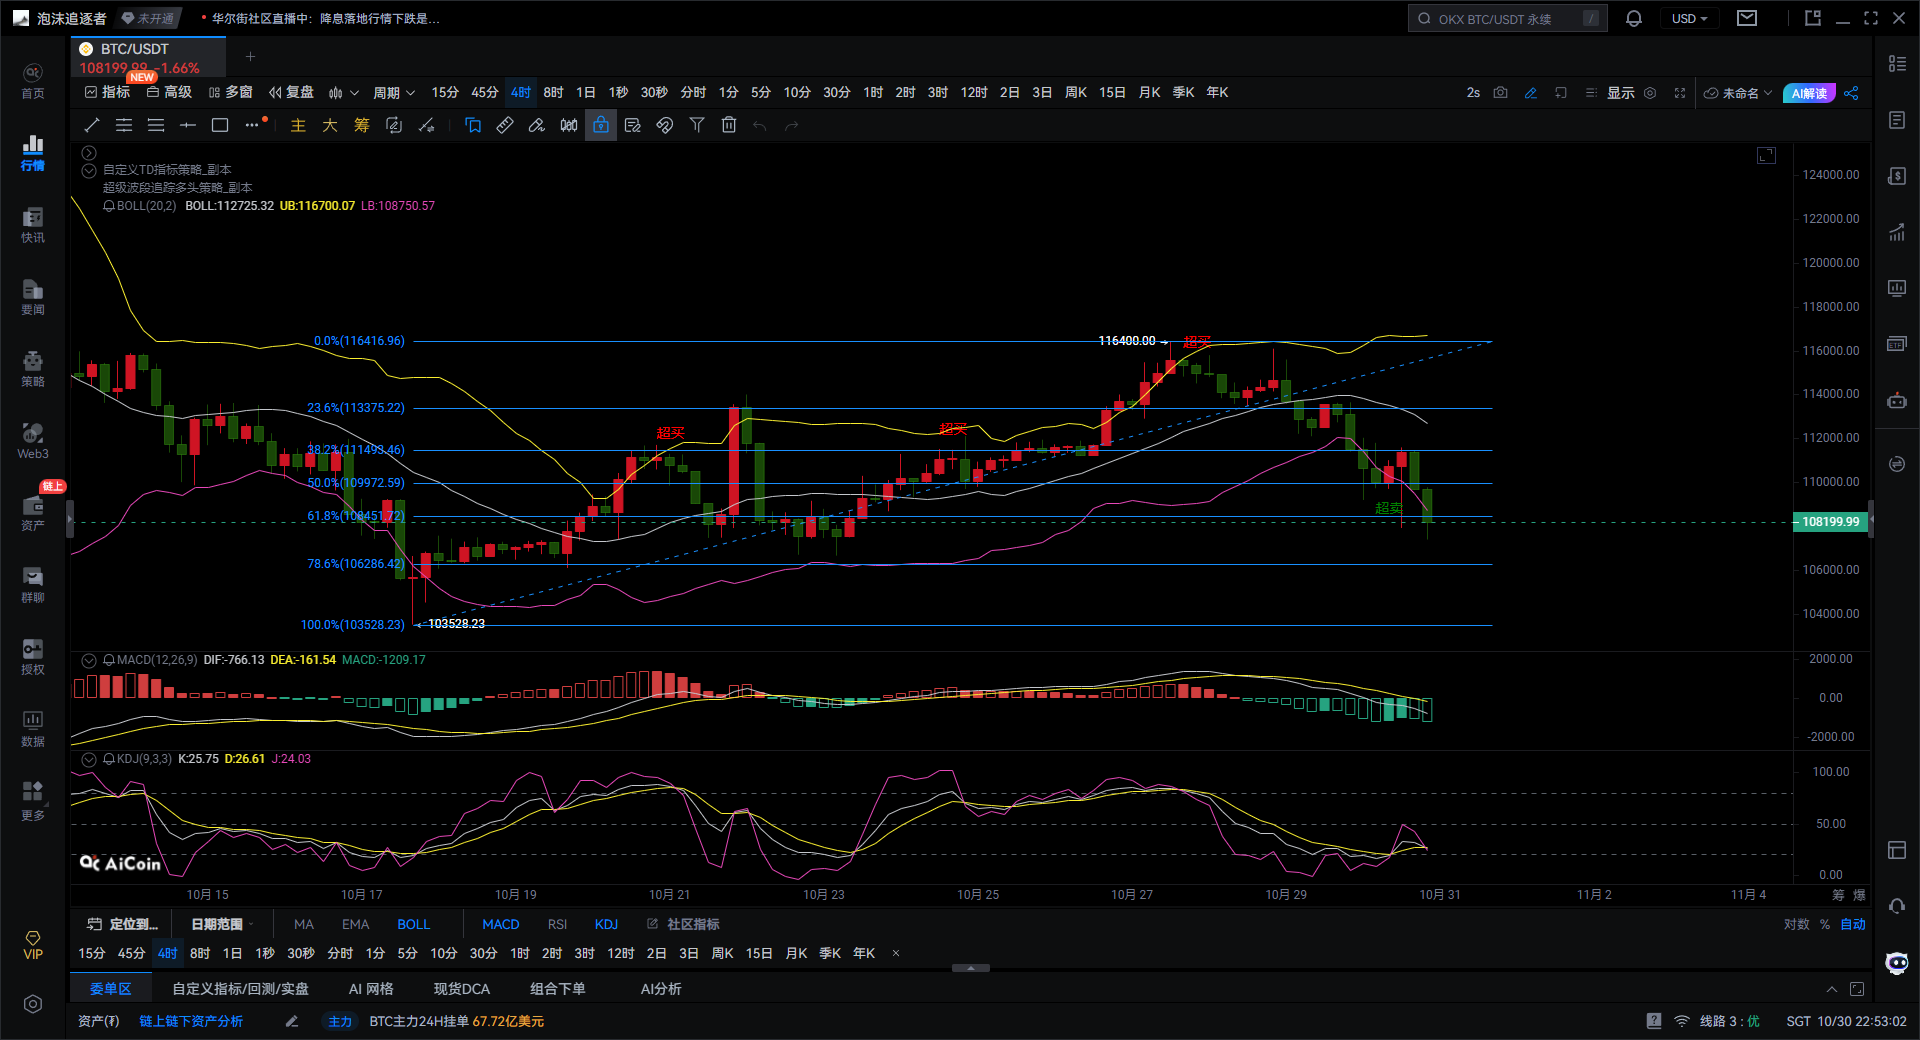
Bitcoin's price is currently around $107,851, located near the 61.8% Fibonacci support line, which is a key strong support area in the medium-term upward trend. The Fibonacci line starts at $103,582 and ends at $116,416. If the price holds this position, a technical rebound may occur, targeting the range of $110,000 to $111,500. The first key support is at $107,850, and the second support is at $106,286. If it breaks below the 61.8% support, it may test the 78.6% retracement level, and if that fails, the upward structure will be broken, turning into a medium-term decline. Short-term resistance is at $110,000 and $111,500, and only a firm hold above $111,500 could lead to a reversal.
The Bollinger Bands show a clear downward opening, indicating increased volatility and that the market is in an adjustment cycle. The upper band is about $116,700, far from the current price, while the middle band around $111,700 has been breached and is now a resistance for rebounds. The lower band is near $107,000, with limited short-term downward space. The price has shown signs of rebounding after touching the lower band multiple times, but if it cannot return above the middle band, the overall trend remains weak. The Bollinger Bands indicate a potential oversold rebound in the short term, but a breakthrough of the middle band is needed to confirm a trend reversal.
In the MACD indicator, the DIF line is at -766, and the DEA line is at -161, both below the zero axis. Although the MACD green histogram has shortened, it continues to exist, and the distance between DIF and DEA is converging, indicating weakening bearish momentum, which may lead to a short-term rebound. The key is whether a golden cross can form; if it does, it will confirm a rebound signal.
The KDJ indicator is in the oversold zone, with K line value around 25, D line value around 26, and J line value around 24, showing signs of a potential golden cross, indicating short-term buying interest. A golden cross signal in the oversold zone usually brings a technical rebound, but the current trend is bearish, and the rebound may only be corrective. If the KDJ line breaks above the 50 midline, the rebound will be further confirmed.
In summary, Bitcoin's price has retraced from a high of $116,400 to the 61.8% Fibonacci support, coinciding with the lower Bollinger band. The MACD bearish momentum is diminishing, and KDJ is oversold, indicating that it is in the late stage of a decline and may see a short-term rebound. However, there is significant pressure above, with key support around $107,800, and the rebound may show a consolidation confirmation pattern.
Based on the above analysis, the following suggestions are provided for reference:
Short-term suggestion: If the price holds above $107,800 and a golden cross signal forms in KDJ, a light long position can be taken, targeting $110,500-$111,500, with a stop loss set below $107,000. If it breaks below $107,000, the rebound has failed, and one should wait or consider a short position.
Medium-term suggestion: If it effectively stabilizes above $111,500 and a golden cross signal forms in MACD, it can confirm the establishment of a stage bottom, targeting $113,000-$115,000. If it continues to oscillate near the lower band, one should be cautious of a potential second bottom test.
Giving you a 100% accurate suggestion is not as valuable as providing you with the right mindset and trend; teaching someone to fish is better than giving them fish. The suggestion may help you earn temporarily, but learning the mindset will help you earn for a lifetime!

Writing time: (2025-10-30, 22:50)
(Written by - Master Says Coin) Disclaimer: Online publication has delays, and the above suggestions are for reference only. Investment carries risks; proceed with caution!
免责声明:本文章仅代表作者个人观点,不代表本平台的立场和观点。本文章仅供信息分享,不构成对任何人的任何投资建议。用户与作者之间的任何争议,与本平台无关。如网页中刊载的文章或图片涉及侵权,请提供相关的权利证明和身份证明发送邮件到support@aicoin.com,本平台相关工作人员将会进行核查。