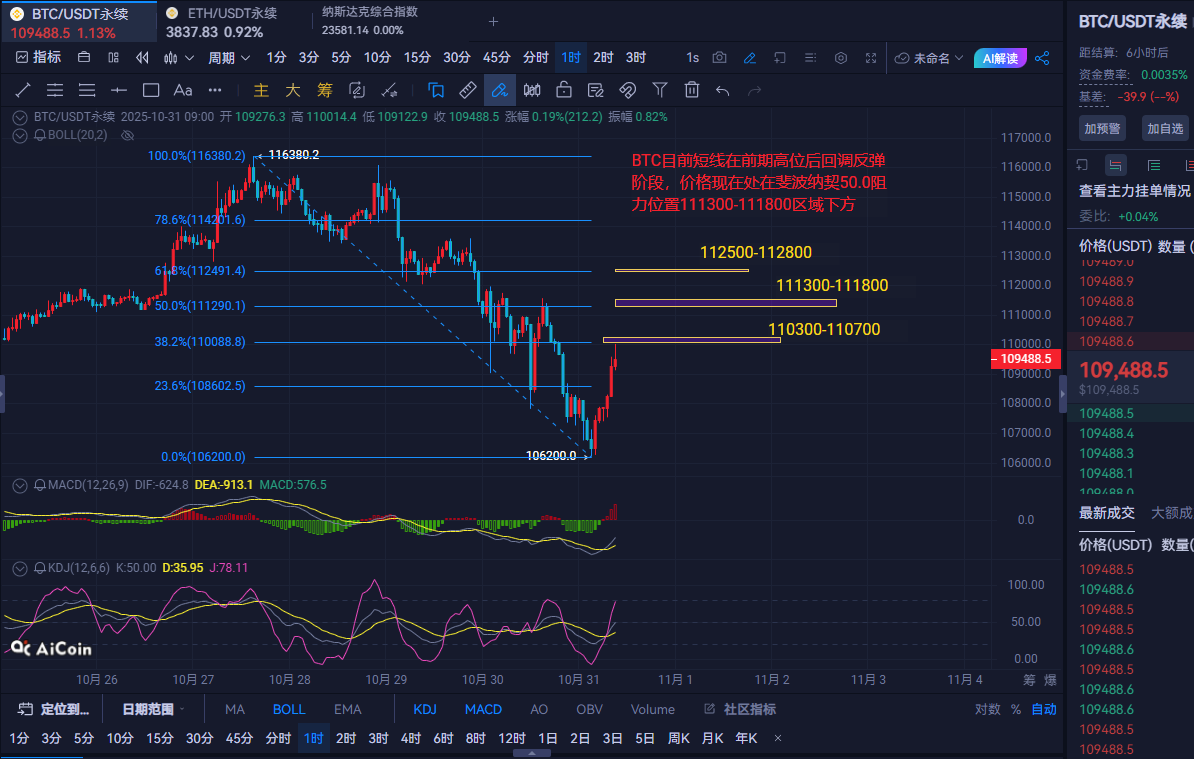
Intraday Analysis: From the current market perspective, Bitcoin's daily and weekly charts show continuous volume increase, with an overall bearish trend. The market has repeatedly tested key support areas and has consistently broken through previous lows, with bearish momentum dominating. The chart exhibits typical descending structural characteristics; however, there have been multiple rebounds near the support level of 106300 on the daily chart, and a W double bottom pattern is currently forming. If, in the last three days of this week, it can break through the 50.0 resistance level in the 1-hour chart around the 111300-111800 area and the 61.8 level at 112500-112800, then there is a high probability of pushing above 115000 next week.
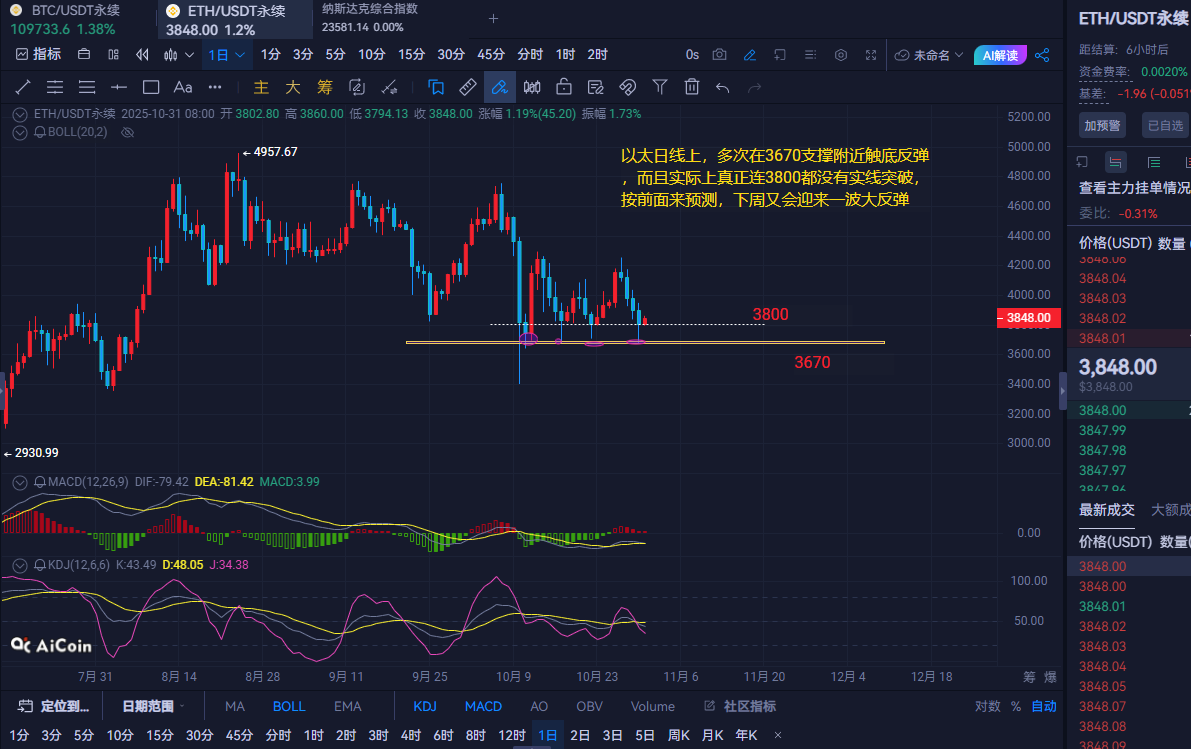
Ethereum's recent candlestick chart shows a trend of oscillating downward, with the price gradually retreating from a high of 4253 to a low of around 3670. On October 30 and 31, there was a slight rebound, but overall it remains within a descending channel. However, the daily chart indicates that 3800 has not been genuinely broken through, and there have been multiple rebounds from below, suggesting strong support below. For an upward breakout, pay attention to the resistance around 3880-3910.
Trading Suggestions: For Bitcoin, consider going long near the 108800-108300 area, with a stop loss at 107800, targeting around 110300-110700. If it breaks through, look for levels around 111300-111800; if it doesn't break, consider going short.
For Ethereum, consider going long near the 3780-3750 area, with a stop loss at 3720, targeting around 3880-3910. If it breaks through, look for levels around 3965-3995; if it doesn't break, consider going short.
This strategy is for reference only; please invest cautiously and secure profits. (For real-time updates, follow the public account: Ethereum Kai)
免责声明:本文章仅代表作者个人观点,不代表本平台的立场和观点。本文章仅供信息分享,不构成对任何人的任何投资建议。用户与作者之间的任何争议,与本平台无关。如网页中刊载的文章或图片涉及侵权,请提供相关的权利证明和身份证明发送邮件到support@aicoin.com,本平台相关工作人员将会进行核查。