On the evening of the 29th, before the interest rate announcement data was released, I predicted that once the Bitcoin price broke below the support level of 111,000, it would test the 106,000 level again. This morning, the market validated this prediction as the price touched the 106,200 level and initiated a rebound.
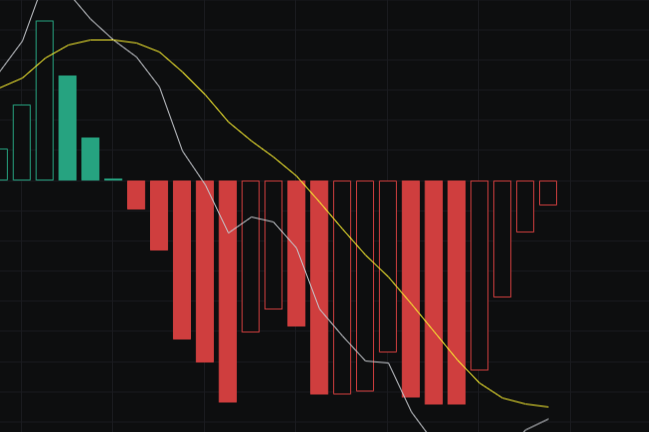
Currently, after four consecutive bearish daily candles, the MACD energy bars have started to shrink. The KDJ has shown a tendency towards a death cross and is diverging downwards. The MA5 and 10-day moving averages have formed a crossover, and the MA30-day moving average is showing signs of a turn. Due to the decline over the past few days, there is a gap of nearly 2000+ between the price and the MA5-day moving average. It is expected that the price will test the MA5-day moving average resistance around 110,800 today. This position is also a short-term dividing line between bulls and bears. If it breaks through, it will test the mid-term resistance at 113,500. However, from the 3-5 day perspective, the current price is still at a dominant low, and the short-term and mid-term trends have not reversed. It is expected that if Bitcoin rebounds without forming a breakthrough, it will decline again.
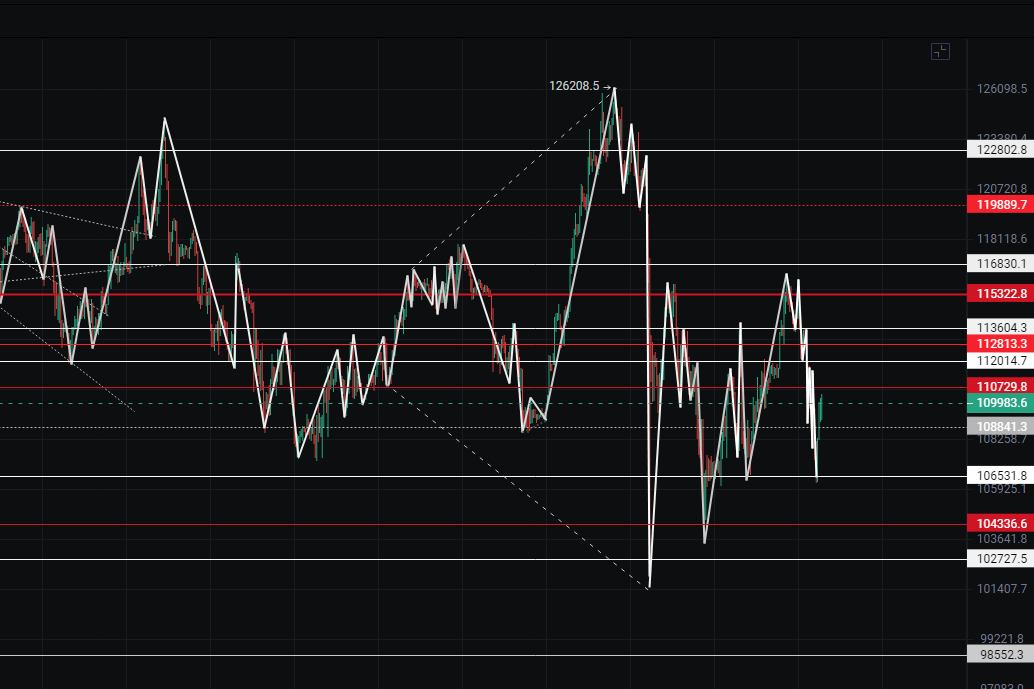
From the 12-hour perspective, Bitcoin has formed some support after touching the lower Bollinger Band. Although the TD indicator has reached TD6 and various indicators are leaning towards bearish divergence, the 106,000 level has been tested multiple times in the past two weeks, indicating a strong accumulation area below. The 106,000 level is also a key bottom support on the weekly chart, and if it cannot be effectively broken in the short term, the market will continue to oscillate within a range.
On the 4-hour chart, after the TD indicator reached TD13 this morning, a rebound sentiment emerged, leading to a low open and high close on the daily chart. Currently, the MACD indicator on the 4-hour chart shows a slowdown in bullish sentiment, while the KDJ has shown a slight upward trend. The MA5 and 10-day moving averages, along with the Bollinger Bands, still exhibit a downward pressure pattern. Combined with the hourly chart, the current market still leans towards a corrective oscillation trend. Today, it is crucial to monitor whether the key resistance level of 110,000-110,800 can be effectively broken. The support level is still around 106,300-102,000. For today's operations, my personal view is to focus on short-term trading around high points, with low points as a supplementary strategy.
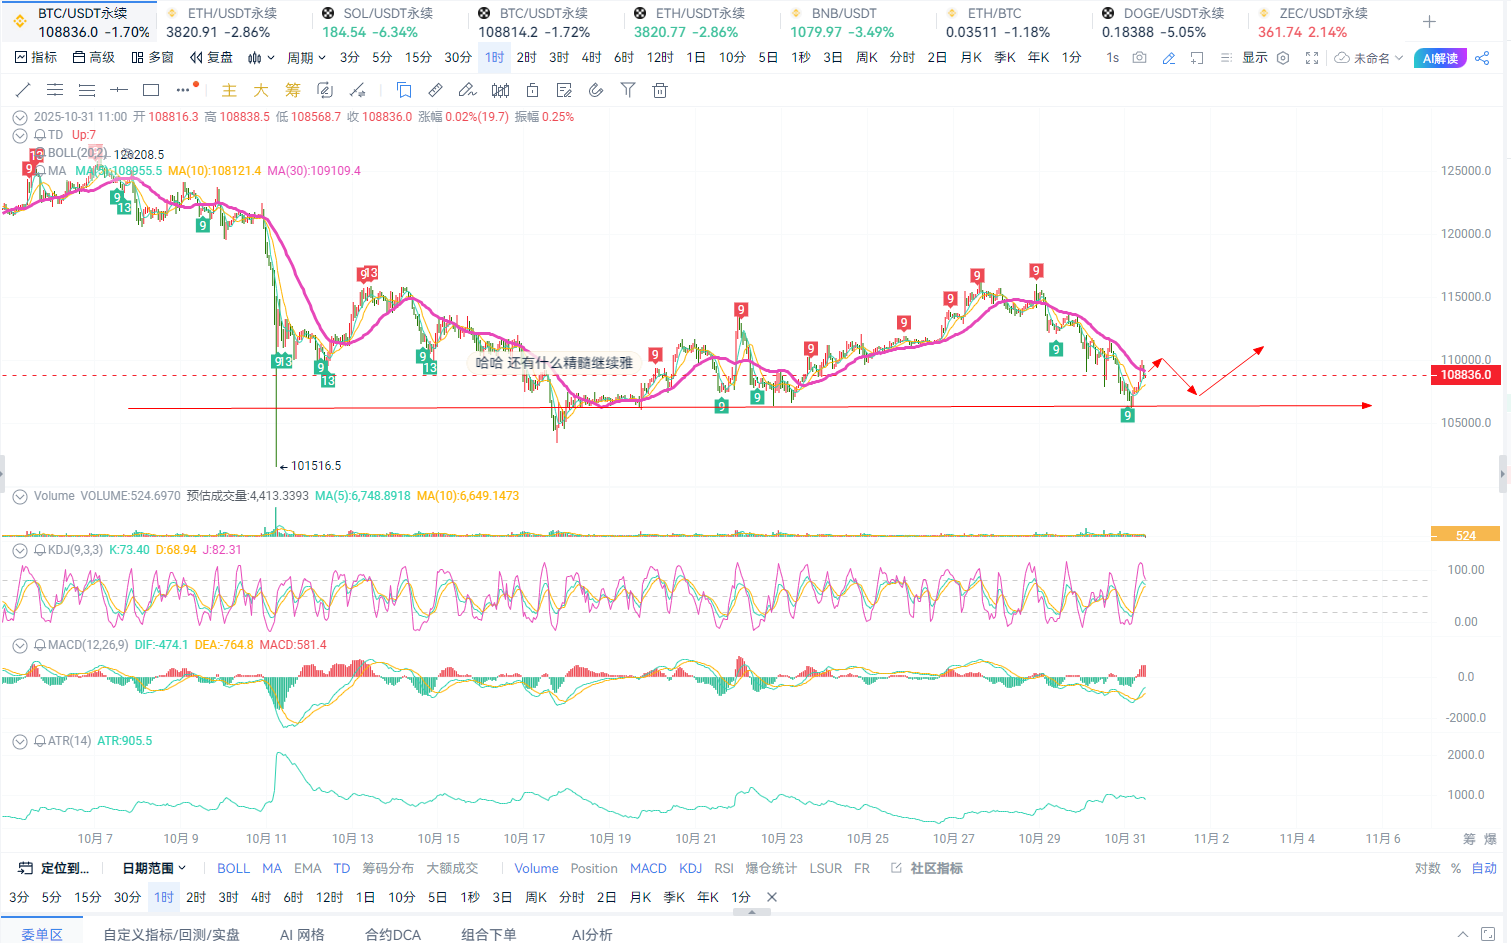
Trading suggestion: Short at 110,000-111,000. Target: 108,500-106,500. Stop loss at 111,400.
For long positions, consider entering in batches at 107,000-106,000. Target: 109,000-110,500. Stop loss down by 500 points.
Ethereum is currently following the overall trend of Bitcoin, with a noticeable bias towards bullish sentiment. Although the short-term trend is following Bitcoin's rebound, there is still strong resistance above, with pressure levels around 3,860-3,920. Support levels are around 3,680-3,400. The overall market still leans towards a downward oscillation, and my personal strategy remains focused on high rebounds, with low positions as a supplementary approach.
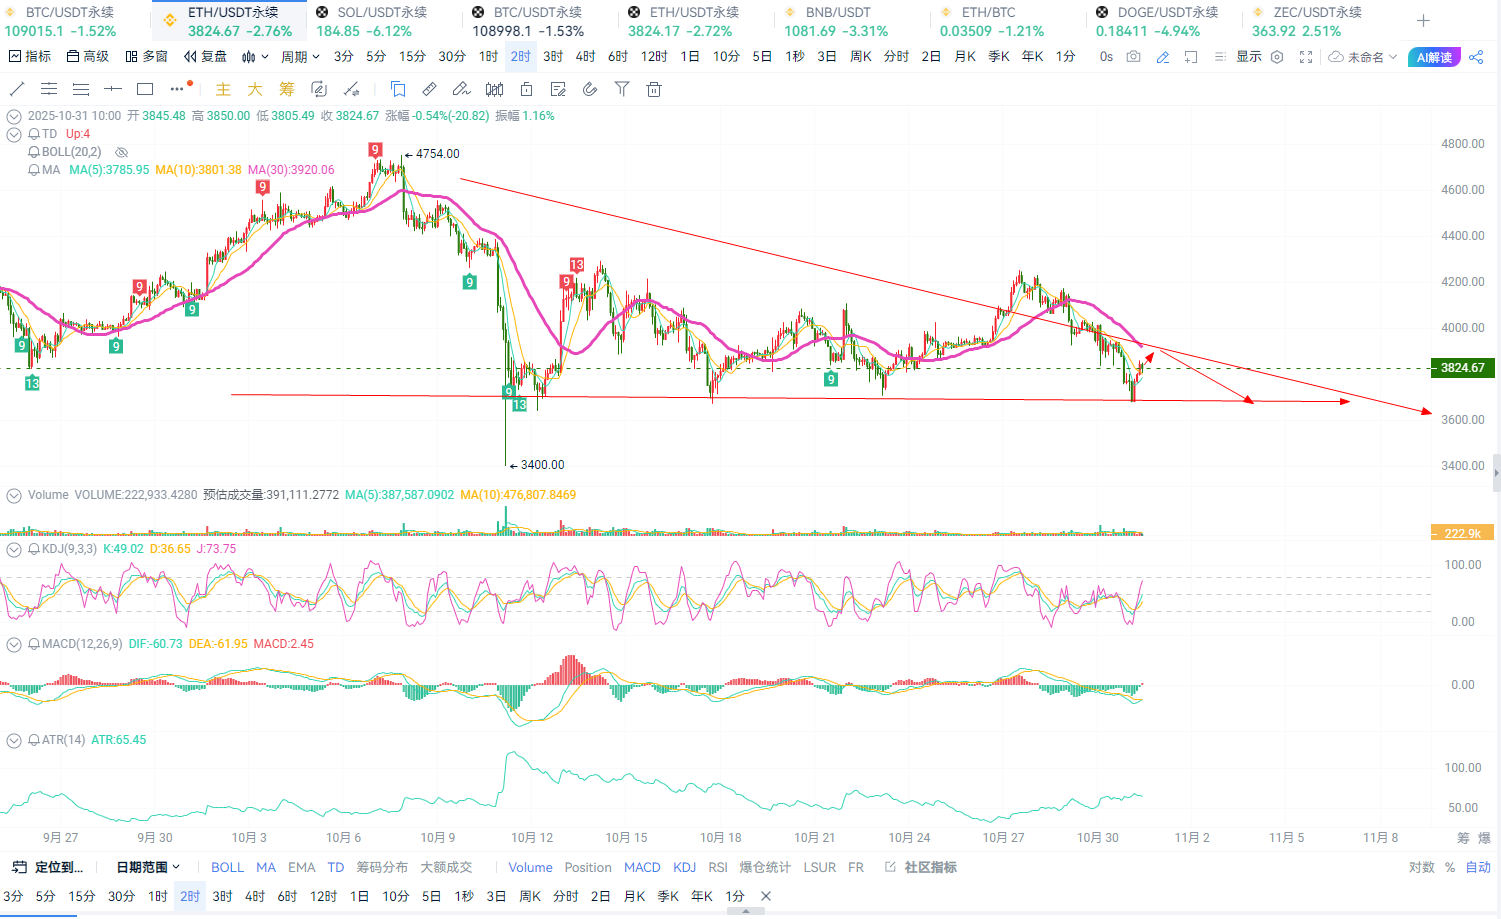
Trading suggestion: Short at 3,850-3,890. Target: 3,780-3,710. Stop loss at 3,920.
For long positions, consider entering at 3,770-3,730. Target: 3,850-3,900.
The current trend is expected to be sufficient, and I will continue to follow up.
My personal views are for reference only. There may be delays in article review and push notifications, and the market changes rapidly. Specific entry and exit points should be based on real-time guidance, and caution is advised when entering the market.
Writing articles and analysis is not easy; I welcome everyone to like and support. A scientific and reasonable trading system, along with position control and risk management techniques, can help you reach greater heights! It will guide you out of confusion and darkness! Just like you, who are still indecisive at this moment, quickly scan the QR code to follow for surprises and real-time market analysis.

免责声明:本文章仅代表作者个人观点,不代表本平台的立场和观点。本文章仅供信息分享,不构成对任何人的任何投资建议。用户与作者之间的任何争议,与本平台无关。如网页中刊载的文章或图片涉及侵权,请提供相关的权利证明和身份证明发送邮件到support@aicoin.com,本平台相关工作人员将会进行核查。