Cryptocurrency Market Overview
According to CoinGecko data, from October 7 to October 20, 2025, the cryptocurrency market exhibited characteristics of structural adjustment and accelerated integration of infrastructure amid significant volatility. In terms of market performance, BTC bottomed out at $102,100 on October 11 and stopped falling, showing an overall pattern of "low-level consolidation and short-term rebound"; ETH rebounded from a low of about $3,680 on October 13 to encounter resistance above $3,980. 【1】
On the ecological front, the number of new developers on Ethereum reached 16,181, continuing to rank first in the Web3 ecosystem, followed closely by Solana and Bitcoin, as developers continued to concentrate on highly compatible and scalable public chains. The macro risk-averse atmosphere drove the market capitalization of tokenized gold to rise to $3.28 billion, while stablecoins played a key role in providing liquidity support amid market fluctuations. Tether and Circle collectively issued approximately $74 billion during the same period, pushing the total supply of global stablecoins to exceed $301.5 billion, setting a historical high.
In the DeFi sector, JustLend DAO's TVL rose to $7.82 billion, and Aave's newly launched stablecoin RLUSD reached a supply of 448 million tokens, indicating a rapid return of funds to leading protocols. The Starknet ecosystem showed significant recovery, with the number of blocks exceeding 3 million and staking scale surpassing 600 million STRK, launching Bitcoin staking and institutional incentive programs centered around "BTCFi," driving TVL and stablecoin scale to new highs. The prediction market sector continued to heat up, with Polymarket receiving a $2 billion investment from ICE and launching a stock "up/down" prediction market, with active wallet numbers exceeding 56,000; Kalshi, in collaboration with Robinhood, saw trading volume reach $1.44 billion, setting a historical high.
Meanwhile, Taiwanese company OwlTing listed on Nasdaq, and asset management giant Amundi launched a cryptocurrency ETF, indicating that the institutionalization process continues to accelerate. Overall, the market has significantly reduced risk exposure after deleveraging, with risk-averse funds still actively circulating in the market, and the focus of funds and narratives gradually shifting towards the mid-to-long-term main line of "high-performance infrastructure + compliant assetization," with BTCFi and prediction markets becoming the core focus of a new round of structural capital flow and market consensus.
Overview of Recent Price Fluctuations
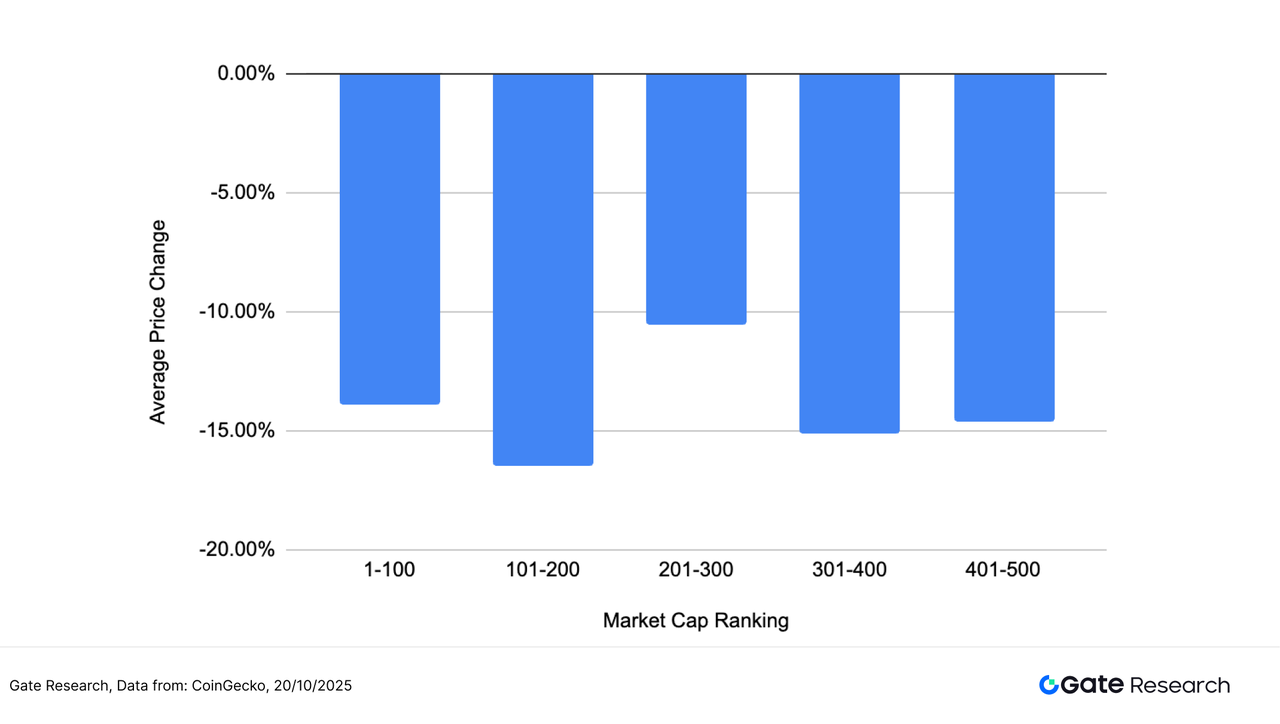
This article groups and analyzes the top 500 tokens by market capitalization, observing their average price changes from October 7 to October 20.
The overall average decline was -14.13%, indicating that the market remains in an adjustment phase after consecutive pullbacks. There are significant performance differences between different market capitalization ranges, structurally showing characteristics of "relative resilience in the mid-range, with deeper declines at both ends." Among them, tokens ranked 201–300 had the smallest decline at only -10.51%, indicating that mid-sized assets exhibit relative resilience in volatile markets; in contrast, the 101–200 range saw a decline of -16.48%, the weakest among the five groups. Top assets (1–100) averaged a decline of -13.92%, while mid-to-lower tier assets (301–400 and 401–500) declined by -15.12% and -14.63%, respectively, indicating that funds have not significantly concentrated in specific tiers, with the overall market still characterized by high volatility and cautious trading.
Overall, this period's market continues the consolidation pattern after deleveraging, with mid-cap tokens showing relative resilience, while top and bottom assets adjusted more deeply due to greater liquidity and risk-averse sentiment fluctuations. The market capitalization structure reflects a phase of fund observation and sector differentiation, indicating that the market is waiting for new liquidity catalysts and macro signals.
Note: The market capitalization distribution is based on CoinGecko data, grouping the top 500 tokens by market capitalization into segments of 100 (e.g., ranks 1–100, 101–200, etc.), calculating the price changes of tokens within each group from October 7 to October 20, 2025, and computing the average for each group as an indicator of average price change for that market capitalization range. The overall average decline (-14.13%) is the unweighted average of the individual price changes of the top 500 tokens.
Figure 1: The overall average decline is -14.13%, with tokens ranked 201–300 showing relative strength, declining about -10.51%
Top Gainers and Losers
In the past two weeks (from October 7 to October 20), the cryptocurrency market experienced significant volatility, with funds continuously rotating between different narrative sectors, leading to sharp price fluctuations for certain tokens.
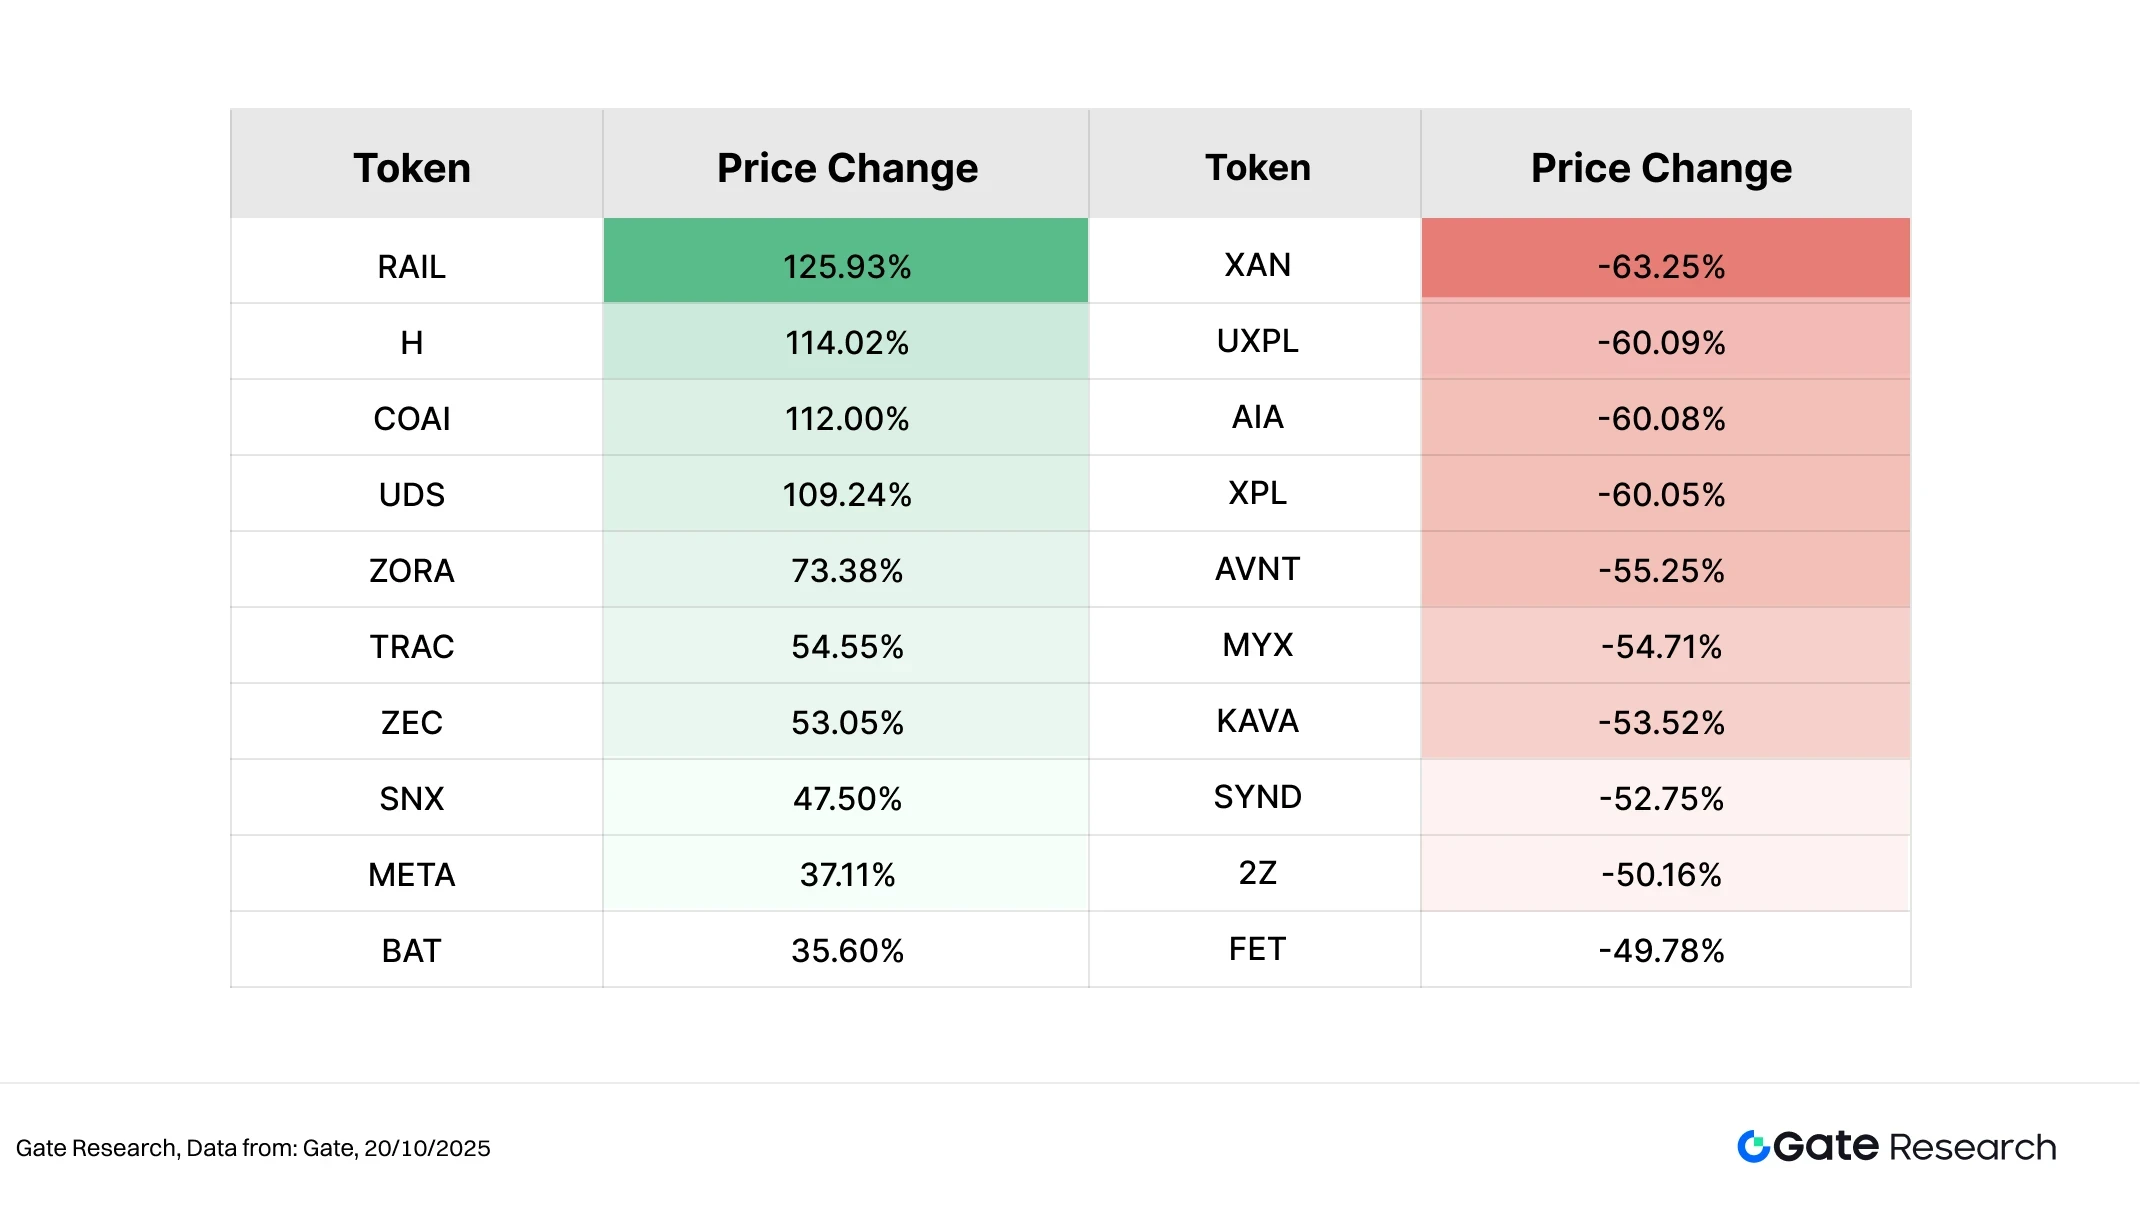
Top Gainers: Privacy Narrative Resurgence, RAIL Leads the Market
RAIL, the native token of the decentralized privacy protocol Railgun, surged over 125% in the past two weeks. Railgun focuses on privacy trading solutions based on zero-knowledge proofs (ZK-SNARK), allowing users to conduct completely private transfers and transactions on Ethereum and its compatible chains. In mid-October, the official announcement stated that its total privacy trading volume exceeded $4 billion (with $1.6 billion from 2025), and it confirmed that the Privacy & Compliance Summit 2025 would be held on November 19, triggering strong market expectations for the resurgence of the privacy narrative. As discussions on regulatory compliance heat up and funds accelerate back into the privacy sector, RAIL has become a standout representative in the privacy space.
Additionally, H (+114.02%) and COAI (+112.00%) followed closely behind, with the former benefiting from the expansion of the on-chain gaming ecosystem, while the latter attracted attention due to the AI + data computing concept, reflecting a preference for mid-to-small-cap projects with strong narratives.
Top Losers: XAN Leads the Decline, Fund Return and Short-term Profit Taking Pressure the Trend
In contrast, XAN (-63.25%) showed the most significant decline on the loser board. This token had previously experienced a rapid rise but subsequently lacked sustained catalysts and trading support, leading funds to gradually return to mainstream assets, with prices significantly retreating from their highs. As market risk-averse sentiment increased and short-term profit-taking rose, XAN became the token with the largest correction this period. Others like UXPL (-60.09%), AIA (-60.08%), and XPL (-60.05%) also saw significant declines, largely due to previous excessive gains and a retreat in market enthusiasm.
Overall, this period's market style exhibited structural characteristics of "the simultaneous advancement of privacy narratives and AI ecosystems, with corrections in overheated themes." Privacy projects gained favor from funds due to compliance framework discussions and increased on-chain trading volume, while short-term speculative targets were quickly cleared amid volatility. In the future, market focus may continue to revolve around the long-term themes of "privacy compliance" and "AI application integration."
Figure 2: RAIL increased by 125.93%, benefiting from the resurgence of the privacy narrative and expectations for the November privacy compliance summit
Market Capitalization Ranking and Price Change Relationship
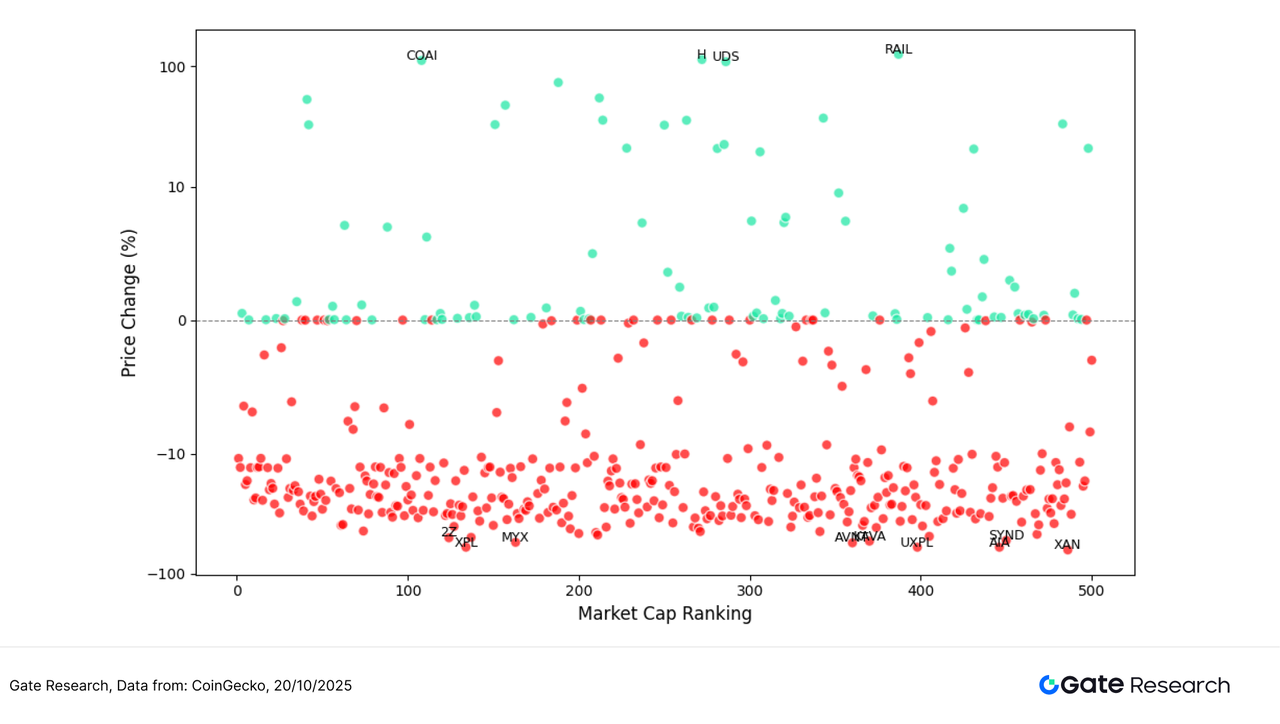
To observe the structural characteristics of token performance in this round of market fluctuations, this article presents a scatter plot of the top 500 tokens by market capitalization. The horizontal axis represents market capitalization ranking (the further left, the larger the market cap), while the vertical axis represents price changes from October 7 to October 20. Each dot in the figure represents a token, with green indicating an increase and red indicating a decrease.
From the overall distribution, the number of declining tokens significantly exceeds that of increasing tokens, indicating that the market remains in an adjustment phase. Most tokens' declines are concentrated in the -10% to -20% range, while those with gains exceeding 50% are relatively rare and mostly found in the mid-to-lower market capitalization ranges, reflecting that market funds are concentrated in more volatile mid-to-small-cap assets.
Among the top gainers, RAIL (+125.93%), H (+114.02%), and COAI (+112.00%) performed the best. RAIL benefited from the warming of the privacy narrative and expectations surrounding the "Privacy & Compliance Summit 2025," becoming a leading representative in the privacy sector; H and COAI gained market favor due to their AI and innovative application concepts.
In contrast, tokens with larger declines were mostly concentrated in previously overheated or low liquidity projects, including XAN (-63.25%), UXPL (-60.09%), and AIA (-60.08%), which generally experienced profit-taking and fund withdrawals after short-term surges.
Overall, market sentiment remains cautious, with funds leaning towards short-term speculation and thematic rotation, particularly highlighting the volatility and risk characteristics of mid-to-small-cap projects. Mainstream assets maintain relative stability, with significant structural market characteristics.
Figure 3: Among the top 500 tokens by market capitalization, the number of declining tokens dominates, with outstanding gains concentrated mainly in the mid-to-lower market capitalization ranges, indicating a preference for high-elasticity and strong narrative assets
Top 100 Market Capitalization Rankings
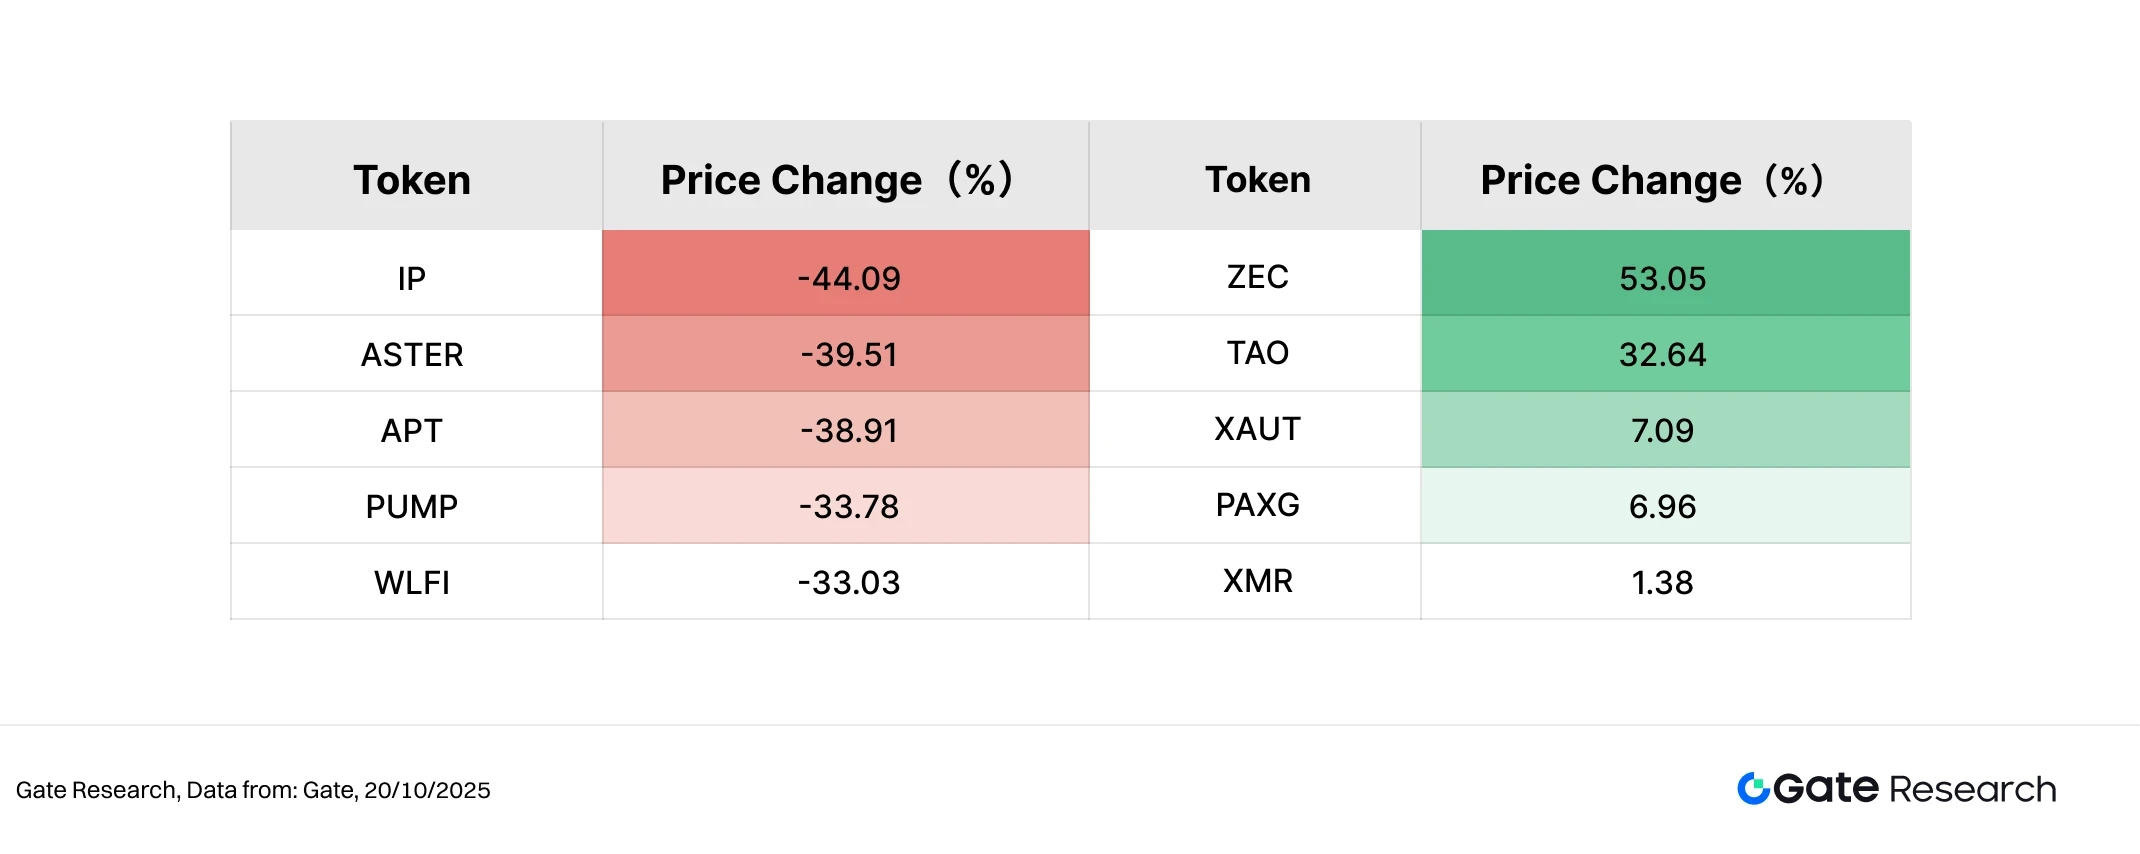
In this round of volatile market conditions, the top 100 tokens by market capitalization showed significant performance differentiation, with mainstream assets remaining stable overall, while certain projects with narrative support or risk-averse attributes stood out. Among the top five gainers, ZEC (+53.05%) led the way, driven by the warming of the privacy sector and increased market attention on decentralized privacy protocols; as a representative project of decentralized AI networks, it continued to perform with high enthusiasm; PAXG (+6.96%) and XAUT (+7.09%) were driven by rising gold prices and increased risk-averse sentiment, becoming representatives of stable income ranges; XMR (+1.38%) maintained a slight upward trend supported by the privacy narrative. Overall, the top gainers are mostly concentrated in the themes of "privacy + real asset anchoring."
In contrast, some popular projects on the loser board experienced deeper corrections. IP (-44.09%) had the largest decline, mainly affected by the fading of previous speculative enthusiasm and fund withdrawals; ASTER (-39.51%) and APT (-38.91%) also saw significant adjustments, indicating weakening fund momentum in the mainstream public chain sector; PUMP (-33.78%) and WLFI (-33.03%) were dragged down by a retreat in community speculation, facing short-term performance pressure. Overall, among the top 100 tokens, funds are more inclined towards assets with risk-averse and long-term narrative support, while high Beta projects and meme concept tokens have seen significant volatility.
Figure 4: Among the top 100 tokens by market capitalization, ZEC and TAO lead the gains, while PAXG and XAUT see slight increases supported by risk-averse sentiment; IP, ASTER, and APT have the largest declines, reflecting a phase of market risk preference retreat
Analysis of Recent Volume Performance
Trading Volume Growth Analysis
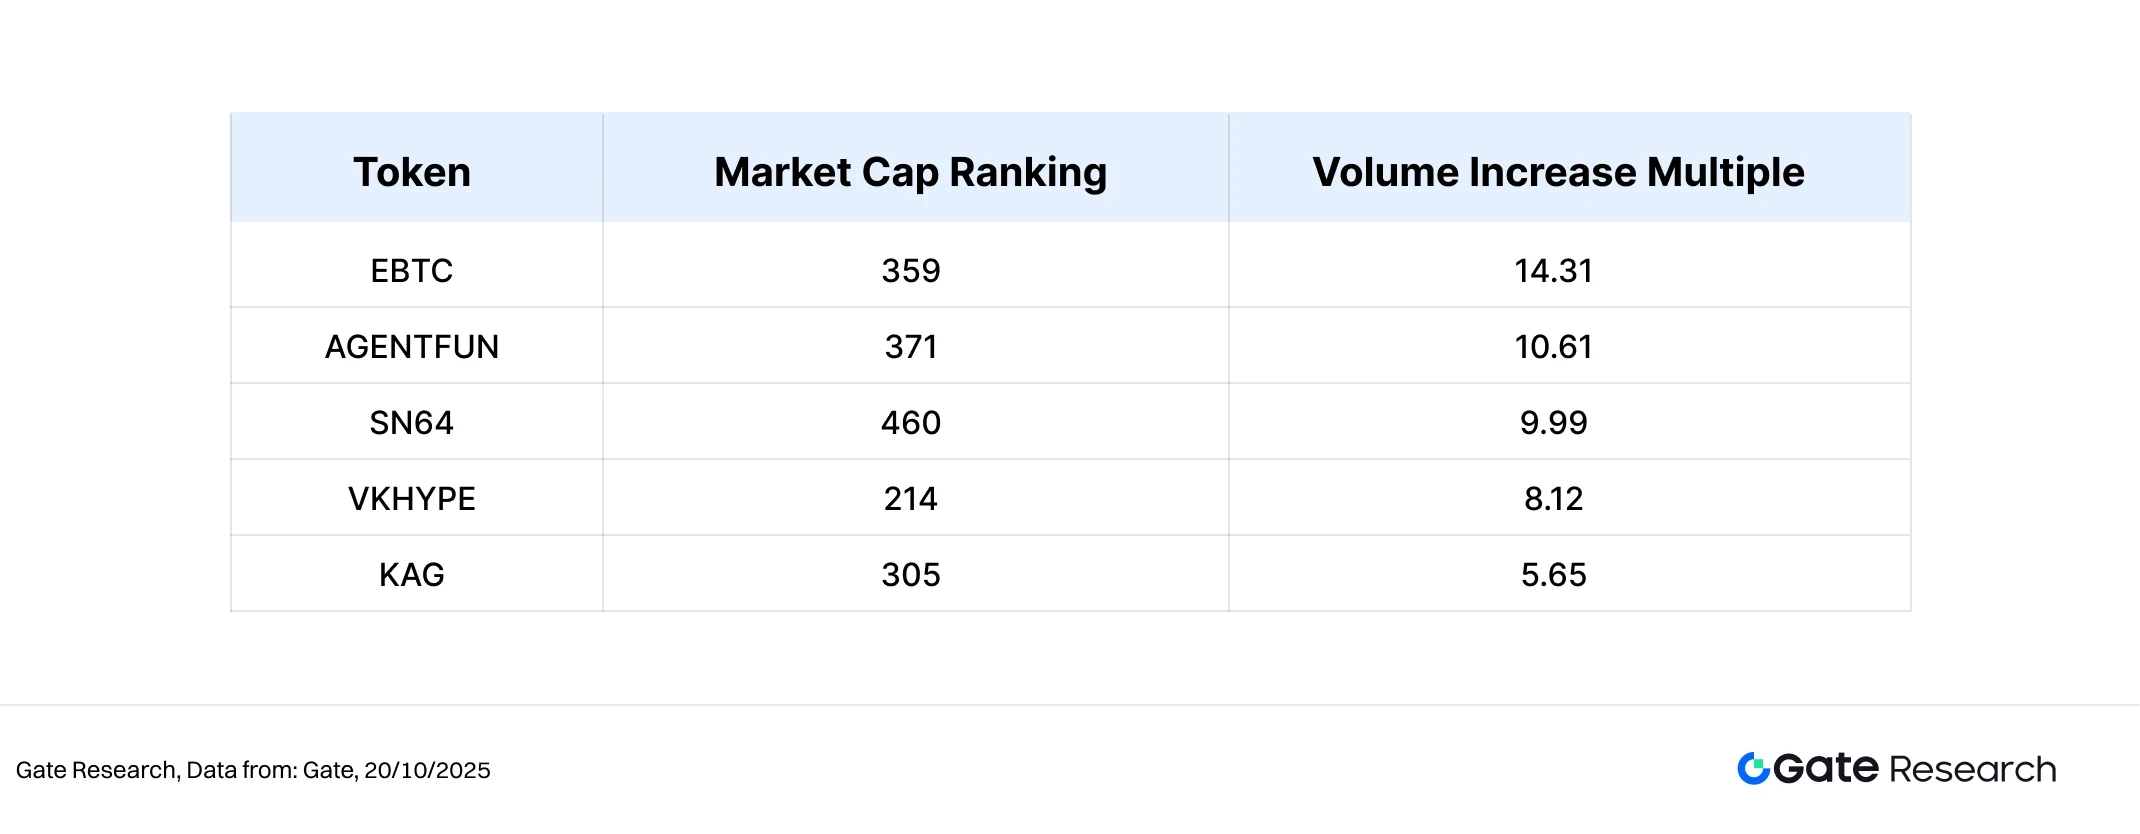
Beyond price performance, this article further analyzes the trading volume changes of certain tokens to observe market activity and the level of capital participation. Using the trading volume before the market started as a baseline, the growth multiples are calculated and compared with the price rebound during the same period to assess market attention and short-term capital trends.
Data shows that EBTC, AGENTFUN, SN64, VKHYPE, and KAG are the five projects with the most significant trading volume growth this period. Among them, EBTC's trading volume increased by 14.31 times, and although its price still fell by -9.72%, the volume increase indicates a significant rise in market sentiment and active short-term trading; AGENTFUN also recorded a volume increase of 10.61 times, but its price dropped by -27.52%, indicating that capital is concentrated on short-term speculation, lacking sustained support.
In contrast, SN64 performed the best, with trading volume expanding by 9.99 times and its price rebounding by 33.18%, demonstrating a typical "volume-price resonance" structure, showing strong market consensus and sentiment; KAG also saw a trading volume increase of 5.65 times while slightly rebounding by 7.30%, with capital inflow stabilizing; VKHYPE, despite an 8.12 times increase in volume, still saw its price drop by -17.57%, indicating that capital quickly retreated after brief participation.
Overall, the projects with increased volume this period are mostly concentrated in the mid-to-low market capitalization range, with significant increases in capital activity, but price performance is differentiated, reflecting that the market is still in a phase of short-term rotation and sentiment speculation. Continuous volume expansion may not necessarily lead to simultaneous price increases, but it often indicates potential capital interest and opportunities for thematic development.
Figure 5: Tokens like EBTC, AGENTFUN, and SN64 saw significant increases in trading volume this period, with SN64 achieving volume-price resonance, becoming a representative project attracting capital in the mid-to-lower market capitalization range.
Volume Changes and Price Analysis
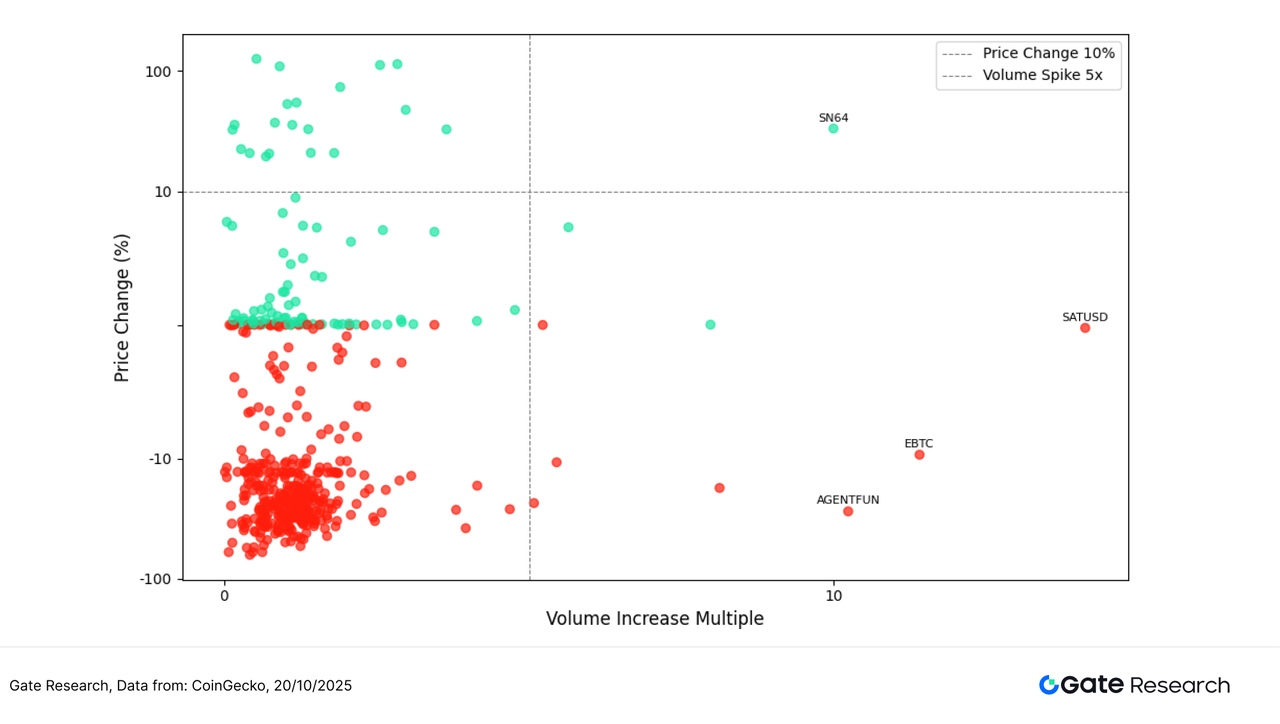
Building on the observation of projects with unusual trading volume, this article further combines price performance to create a scatter plot of volume increase multiples (Volume Increase Multiple) and price changes (Price Change %). The horizontal axis represents the growth multiple of a token's trading volume compared to the baseline period over the past two weeks, while the vertical axis represents the percentage change in price during the same period, using a symmetric logarithmic coordinate axis to clearly present the structural relationship between "volume increase" and "price change."
From the chart, it can be seen that the upper right quadrant is populated with core targets that have significantly increased trading volume and simultaneously rising prices, representing the main direction of capital focus in the market's structural rotation. Among them, SN64 stands out, with trading volume increasing nearly 10 times and price rising over 30%, likely stimulated by news that Chutes AI became the largest open-source inference service provider on OpenRouter, leading to high market attention on its ecological narrative, forming a volume-price resonance structure driven by the "AI + decentralized inference" trend.
In contrast, although EBTC and AGENTFUN saw volume increases of 14.31 times and 10.61 times respectively, their prices still recorded declines of -9.72% and -27.52%, indicating that the rise in trading volume did not lead to a price reversal, with a strong atmosphere of short-term trading in the market. SATUSD also recorded high volume but weak price performance, reflecting that some capital is concentrated on arbitrage or short-term hedging operations.
Overall, projects in the upper right quadrant generally have clear information catalysts, strong community support, and good liquidity, making them key targets for concentrated capital rotation in this round of market activity; while the lower right quadrant reflects a "volume without price increase" pattern, indicating insufficient capital following interest. The market overall remains in a phase driven by events and thematic enthusiasm.
Figure 6: SN64 falls into the upper right quadrant, forming a significant volume increase and price rise structure driven by AI infrastructure narratives and ecological news; EBTC and AGENTFUN, while showing significant volume increases, did not see a corresponding price rebound.
Correlation Analysis
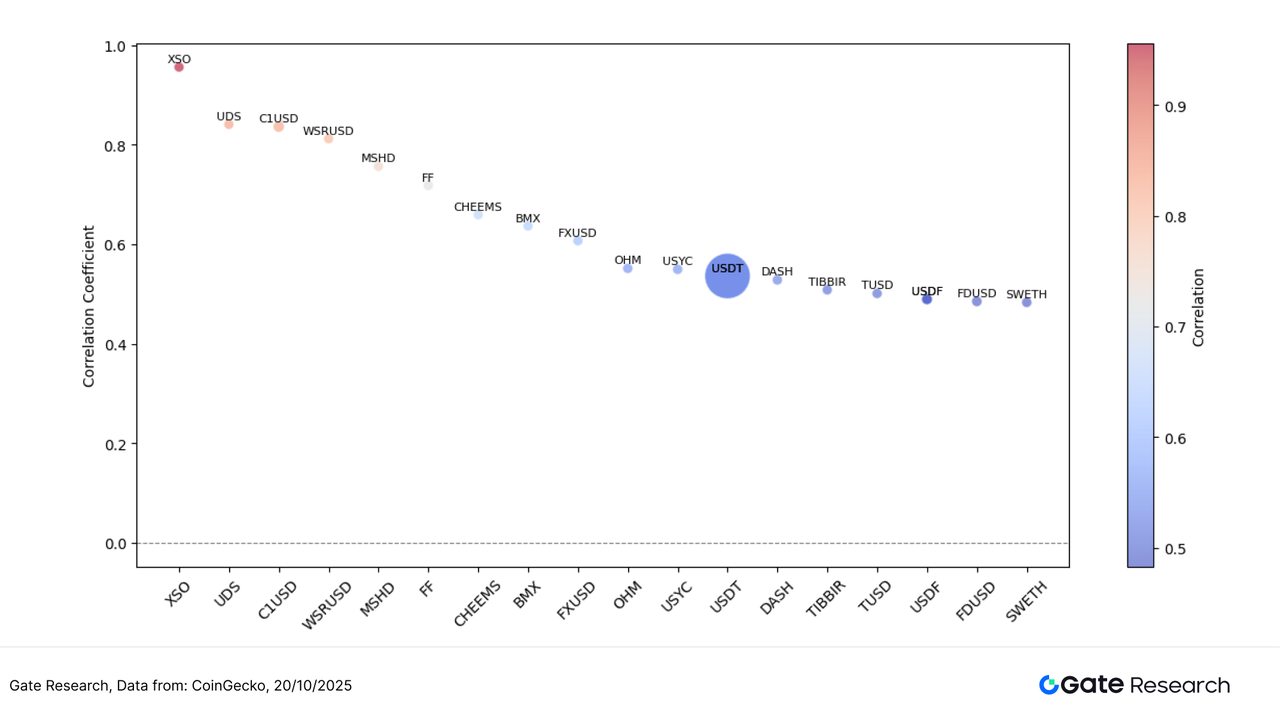
After exploring the linkage between trading volume and price performance, this article further analyzes the systematic correlation between the two from a statistical perspective. To measure the impact of capital activity on price fluctuations, the "trading volume growth rate / market capitalization" is used as a relative activity indicator, and its correlation coefficient with price changes is calculated to identify the types of tokens most susceptible to capital-driven movements in the current market.
From the chart, it can be seen that the correlation coefficients of most tokens are concentrated in the 0.7–0.9 range, showing a strong positive correlation, indicating that there is generally a linkage effect between increased trading volume and price fluctuations. The color of the bubbles represents the strength of correlation (red indicates higher, blue indicates lower), while the size of the bubbles reflects the market capitalization of the tokens.
Among them, XSO, UDS, and C1 USD have the highest correlation coefficients, close to 0.9–1.0, indicating that these mid-to-small-cap assets are highly likely to trigger simultaneous price fluctuations when trading volume increases, making them typical high-elasticity "volume-price linked" tokens; in contrast, stablecoin assets like USDT, TUSD, and FDUSD have relatively lower correlations (around 0.7–0.75), mainly due to their price anchoring characteristics leading to limited volatility, but they still exhibit structural influence during liquidity cycles.
Overall, the market shows a clear "correlation stratification" structure: mid-to-small-cap tokens exhibit strong volume-price linkage and high volatility, while large-cap or stablecoin assets have lower correlations and stable trends. This characteristic reflects that capital prefers high-elasticity targets for short-term operations, while stablecoins and mainstream assets primarily serve liquidity and risk-averse functions.
Figure 7: Mid-to-small-cap tokens like XSO and UDS show the highest correlation between trading volume and price fluctuations, exhibiting strong volume-price linkage; stablecoins like USDT, TUSD, and FDUSD show lower correlations, reflecting a more robust market structure characteristic.
The current cryptocurrency market continues to exhibit a structural rotation pattern, with market sentiment gradually recovering amid fluctuations, and the characteristics of volume-price linkage significantly enhanced. Mid-to-small-cap tokens like RAIL, COAI, and H have achieved strong rebounds through narrative catalysts and increased trading volume, becoming the focus of short-term capital speculation; SN64 has attracted capital attention due to Chutes AI topping OpenRouter as an open-source inference service provider, showing clear volume-price resonance. In contrast, while EBTC and AGENTFUN recorded significant volume increases, their price performance remains weak, indicating a growing concentration of capital flow.
In addition to trading conditions, several potential airdrop projects are also being actively promoted, covering popular directions such as AI blockchain, Web3 community incentives, stablecoin deposits, and decentralized node networks. If users can grasp the rhythm and continue to participate in interactions, they are likely to secure positions in the turbulent market, obtaining token incentives and airdrop qualifications. The following section will outline four noteworthy projects and participation methods to assist in systematically positioning for Web3 dividend opportunities.
Airdrop Hot Projects
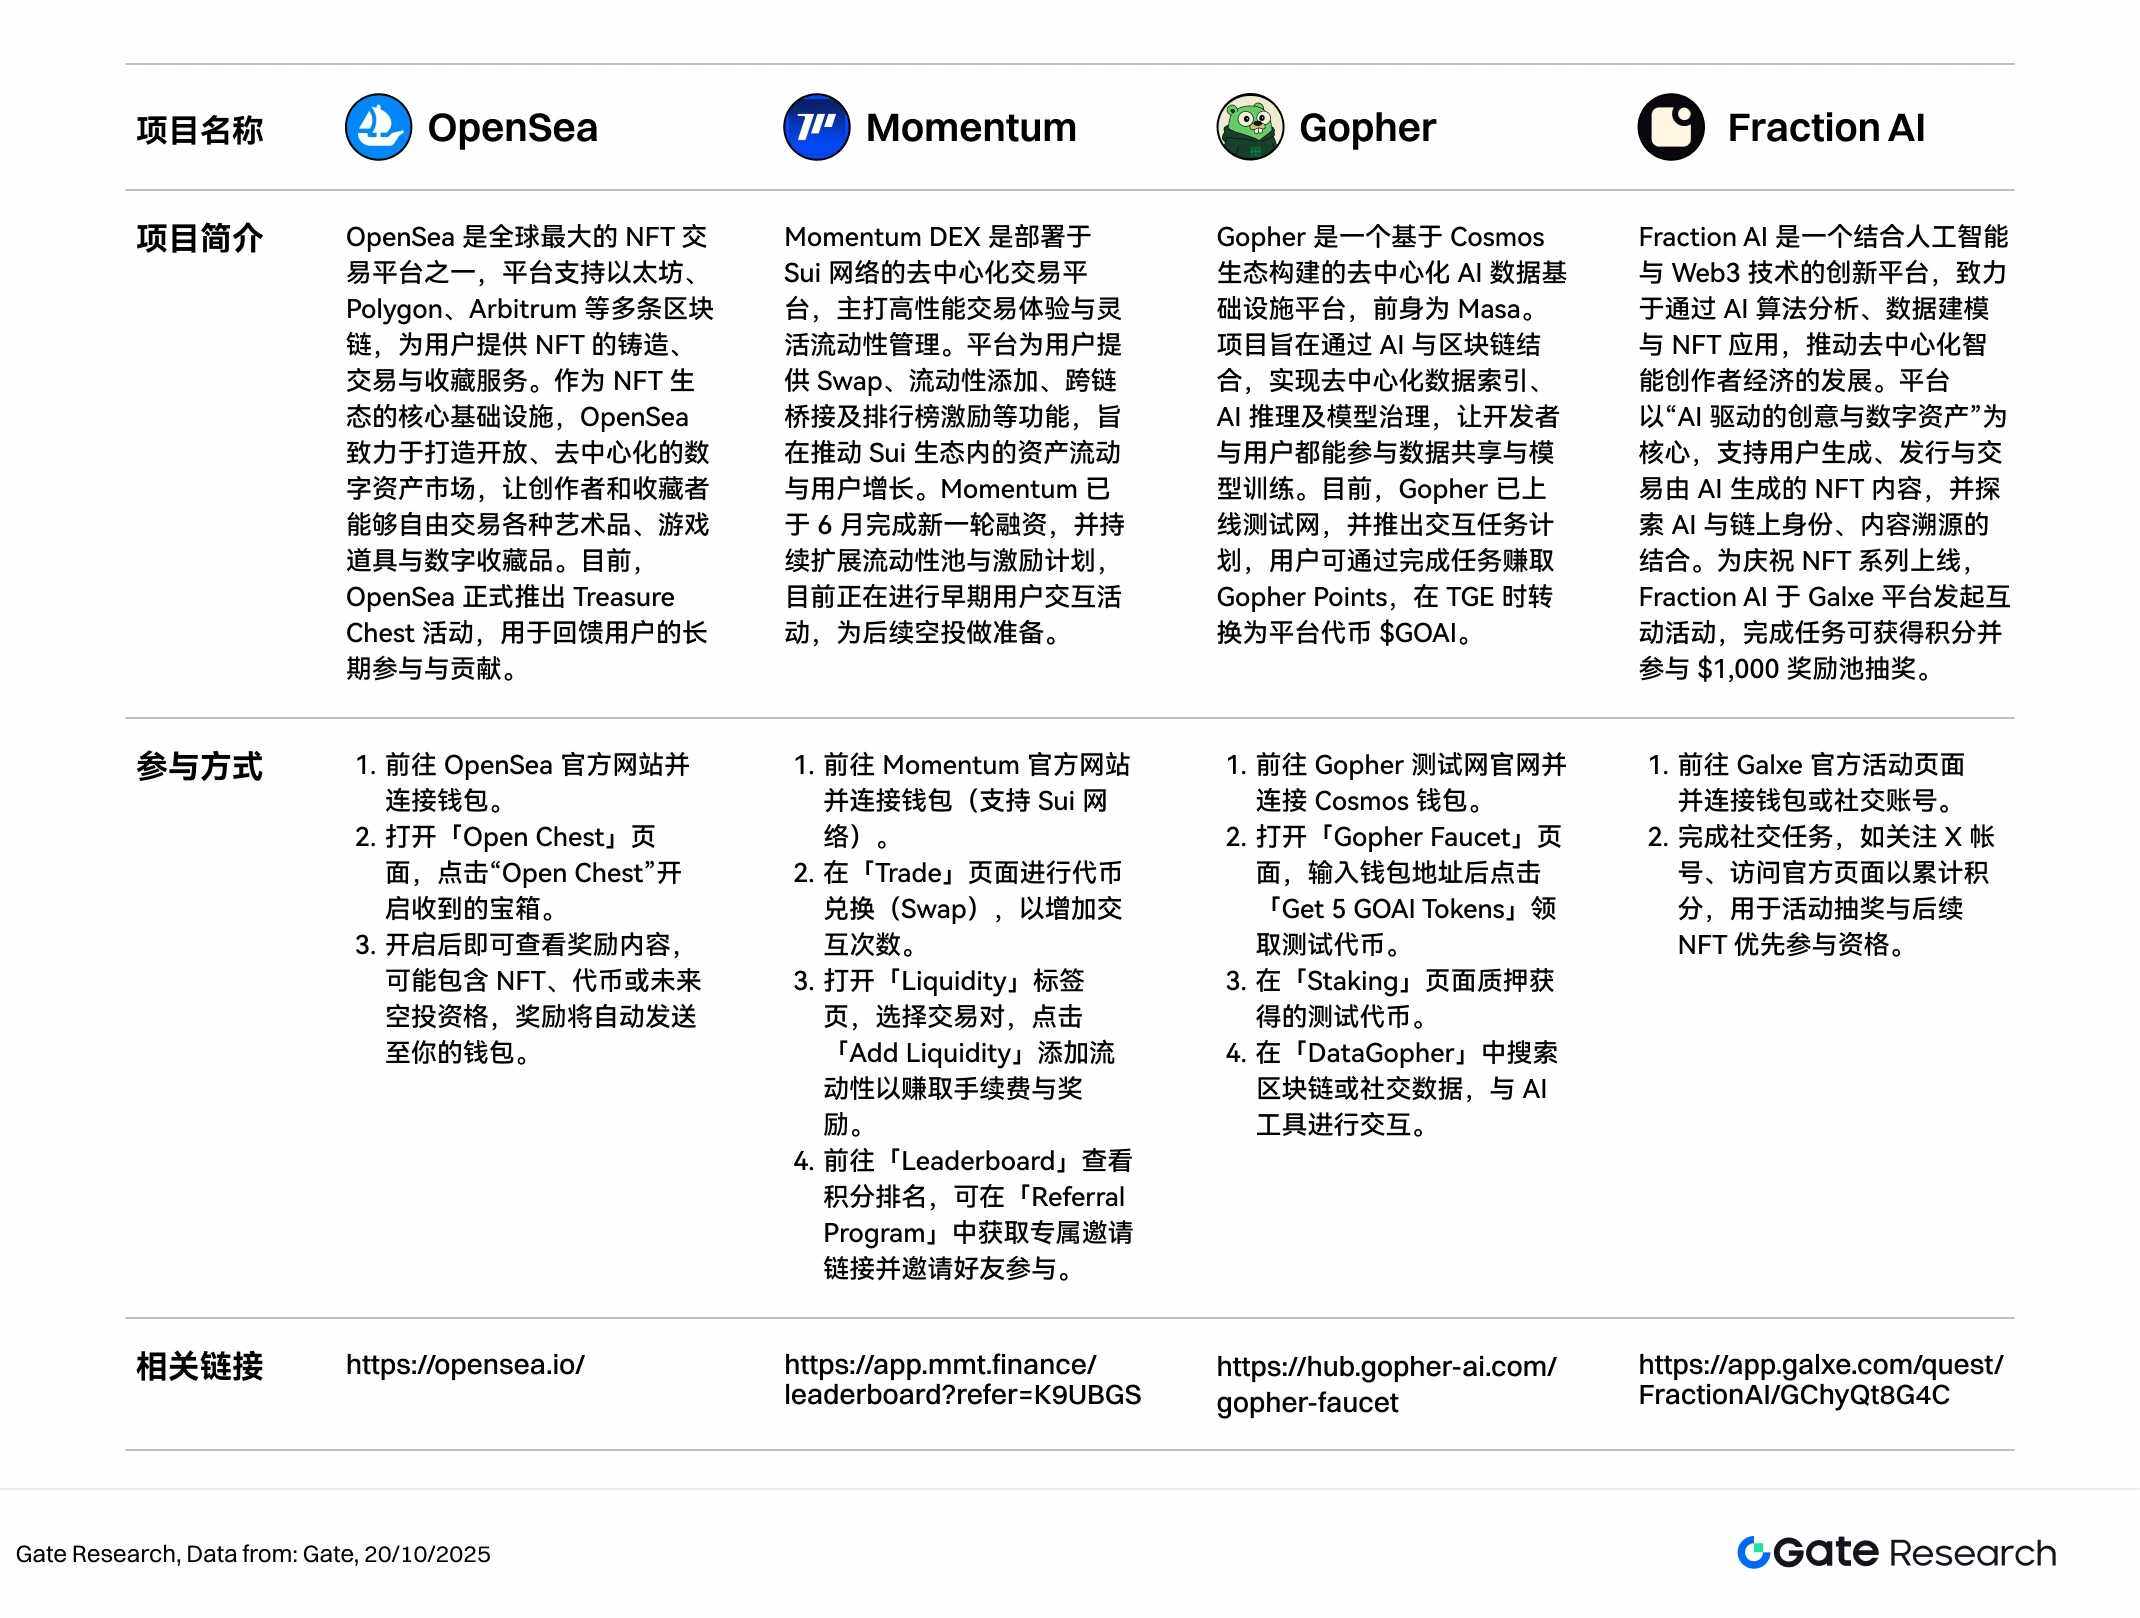
This article compiles a list of airdrop potential projects worth focusing on from October 7 to October 20, 2025, including OpenSea (the world's largest NFT trading platform), Momentum DEX (a decentralized trading platform deployed on the Sui network), Gopher (a decentralized AI data infrastructure based on the Cosmos ecosystem), and Fraction AI (a Web3 platform combining artificial intelligence and NFT creation), among several early-stage projects. Users can accumulate participation records through wallet connections, task completions, trading interactions, and staking operations to qualify for subsequent airdrops or token distributions.
OpenSea
OpenSea is one of the largest NFT trading platforms globally, supporting multiple blockchains such as Ethereum, Polygon, and Arbitrum, providing users with NFT minting, trading, and collection services. As a core infrastructure of the NFT ecosystem, OpenSea is committed to creating an open and decentralized digital asset market, allowing creators and collectors to freely trade various artworks, game items, and digital collectibles. Currently, OpenSea has officially launched the Treasure Chest event to reward users for their long-term participation and contributions. 【2】
Participation Method:
Visit the official OpenSea website and connect your wallet.
Open the "Open Chest" page and click "Open Chest" to unlock the received treasure chest.
After opening, you can view the reward contents, which may include NFTs, tokens, or future airdrop qualifications, and rewards will be automatically sent to your wallet.
Momentum
Momentum DEX is a decentralized trading platform deployed on the Sui network, focusing on high-performance trading experiences and flexible liquidity management. The platform provides users with features such as Swap, liquidity addition, cross-chain bridging, and leaderboard incentives, aiming to promote asset flow and user growth within the Sui ecosystem. 【3】Momentum completed a new round of financing in June and continues to expand liquidity pools and incentive programs, currently conducting early user interaction activities in preparation for future airdrops.
Participation Method:
Visit the official Momentum website and connect your wallet (supports Sui network).
Go to the "Trade" page to exchange tokens (Swap) to increase interaction frequency.
Open the "Liquidity" tab, select a trading pair, and click "Add Liquidity" to add liquidity to earn fees and rewards.
Visit the "Leaderboard" to check your points ranking, and you can obtain a unique referral link in the "Referral Program" to invite friends to participate.
Gopher
Gopher is a decentralized AI data infrastructure platform built on the Cosmos ecosystem, formerly known as Masa. The project aims to achieve decentralized data indexing, AI inference, and model governance through the combination of AI and blockchain, allowing both developers and users to participate in data sharing and model training. Currently, Gopher has launched a testnet and introduced an interaction task program, where users can earn Gopher Points by completing tasks, which can be converted into platform tokens $GOAI during the TGE. 【4】
Participation Method:
Visit the Gopher testnet official website and connect your Cosmos wallet.
Open the "Gopher Faucet" page, enter your wallet address, and click "Get 5 GOAI Tokens" to receive test tokens.
Stake the received test tokens on the "Staking" page.
Search for blockchain or social data in "DataGopher" and interact with AI tools.
Fraction AI
Fraction AI is an innovative platform that combines artificial intelligence and Web3 technology, dedicated to promoting the development of a decentralized intelligent creator economy through AI algorithm analysis, data modeling, and NFT applications. The platform focuses on "AI-driven creativity and digital assets," supporting users in generating, issuing, and trading AI-generated NFT content, while exploring the integration of AI with on-chain identity and content traceability. To celebrate the launch of its NFT series, Fraction AI has initiated an interactive event on the Galxe platform, where completing tasks can earn points and allow participation in a $1,000 reward pool lottery. 【5】
Participation Method:
Visit the official Galxe event page and connect your wallet or social account.
Complete social tasks, such as following the X account and visiting the official page to accumulate points for the event lottery and future NFT priority participation qualifications.
Note
Airdrop plans and participation methods may be updated at any time, so users are advised to follow the official channels of the above projects for the latest information. Additionally, users should participate cautiously, be aware of risks, and conduct thorough research before participating. Gate does not guarantee the distribution of subsequent airdrop rewards.
Summary
Looking back at the market performance from October 7 to October 20, 2025, the overall trend continues to exhibit a "structural rotation + thematic drive" pattern, with a significant increase in the linkage between trading volume and price. BTC stabilized and rebounded from $102,100, while ETH started to rise at $3,680, providing market confidence anchors. The top 100 market cap tokens showed stable trends, with ZEC and TAO leading the privacy and AI sectors, respectively; mid-to-small-cap projects were more active, with tokens like RAIL, COAI, and SN64 rising over 100%, and trading volumes multiplying, becoming the main beneficiaries of this round of capital rotation.
From a data structure perspective, the correlation coefficient between trading volume/market cap and price increase is concentrated in the 0.7–0.9 range, indicating a market preference for "high activity + strong narrative" assets. In the scatter distribution, projects with increased volume and rising prices are concentrated in the upper right quadrant, showing a clear structural strength, while stablecoins and mainstream assets are in the low correlation range, maintaining relatively stable trends. Overall, the market is in a "thematic dominance, structural differentiation" phase, with short-term capital focusing on rotating hot sectors, while long-term capital is observing macro liquidity and technical signals, waiting for the next round of trend catalysts.
Additionally, the tracked projects OpenSea, Momentum, Gopher, and Fraction AI are all in active incentive phases, focusing on the NFT market ecosystem, on-chain DEX trading, AI data networks, and AI content economy, with complementary ecological positioning and clear incentive paths. Users can participate in tasks according to project characteristics, such as opening treasure chests, adding liquidity, staking test tokens, or completing Galxe social tasks to enhance points and potential TGE reward weight. It is recommended to continuously follow the official announcements and interaction activity rhythms of each project to seize airdrop distributions and early dividend windows.
References:
CoinGecko, https://www.coingecko.com/
OpenSea, https://opensea.io/
Momentum, https://app.mmt.finance/leaderboard?refer=K9 UBGS
Gopher, https://hub.gopher-ai.com/gopher-faucet
Fraction AI, https://app.galxe.com/quest/FractionAI/GChyQt8G4C
Gate Research Institute is a comprehensive blockchain and cryptocurrency research platform that provides readers with in-depth content, including technical analysis, hot insights, market reviews, industry research, trend forecasts, and macroeconomic policy analysis.
Disclaimer
Investing in the cryptocurrency market involves high risks, and users are advised to conduct independent research and fully understand the nature of the assets and products they are purchasing before making any investment decisions. Gate is not responsible for any losses or damages resulting from such investment decisions.
免责声明:本文章仅代表作者个人观点,不代表本平台的立场和观点。本文章仅供信息分享,不构成对任何人的任何投资建议。用户与作者之间的任何争议,与本平台无关。如网页中刊载的文章或图片涉及侵权,请提供相关的权利证明和身份证明发送邮件到support@aicoin.com,本平台相关工作人员将会进行核查。