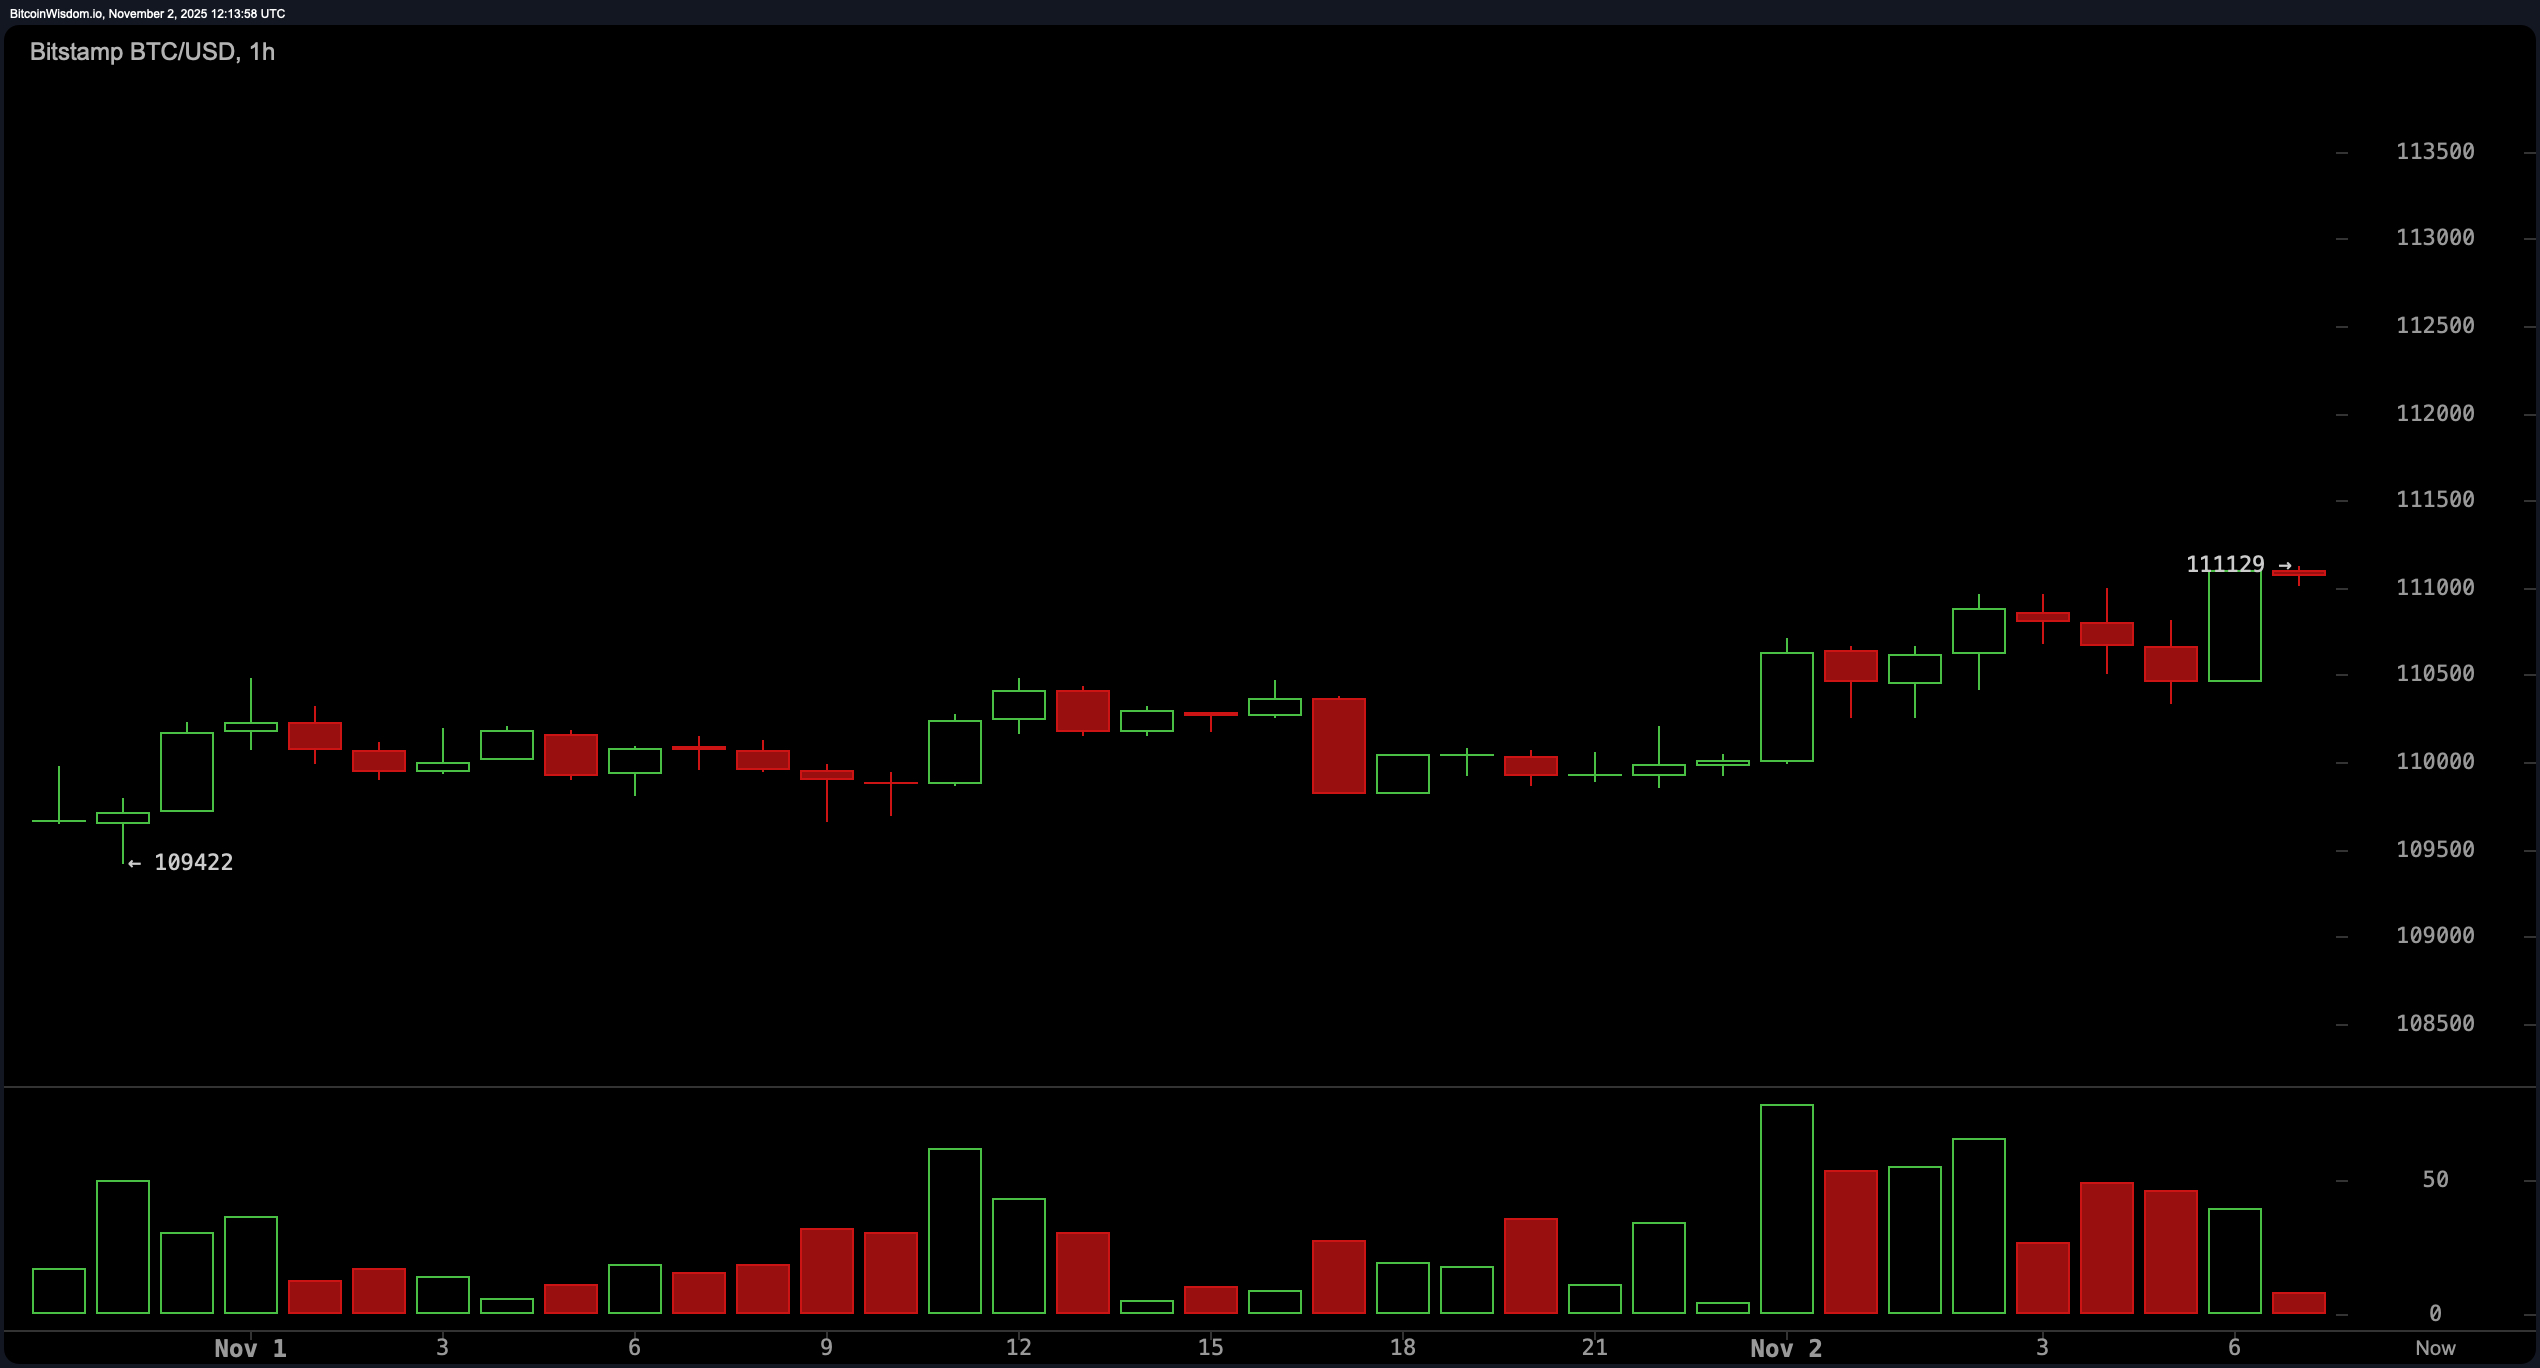
On the 1-hour chart, bitcoin is clinging to a cautious optimism. Price bounced from $109,422 and powered up to $111,129, forming a clear higher low structure—textbook behavior for short-term bulls. Volume popped noticeably on the final green candle, hinting that some traders are still thirsty for upside at these levels.
Yet the momentum is sputtering just shy of resistance, suggesting a market that wants to run but keeps checking its shoelaces. If this flirtation with the $111,500–$112,000 resistance is to mean anything, it will need a bold follow-through—preferably on the back of real volume, not hope and hopium.

BTC/USD 1-hour chart via Bitstamp on Nov. 2, 2025.
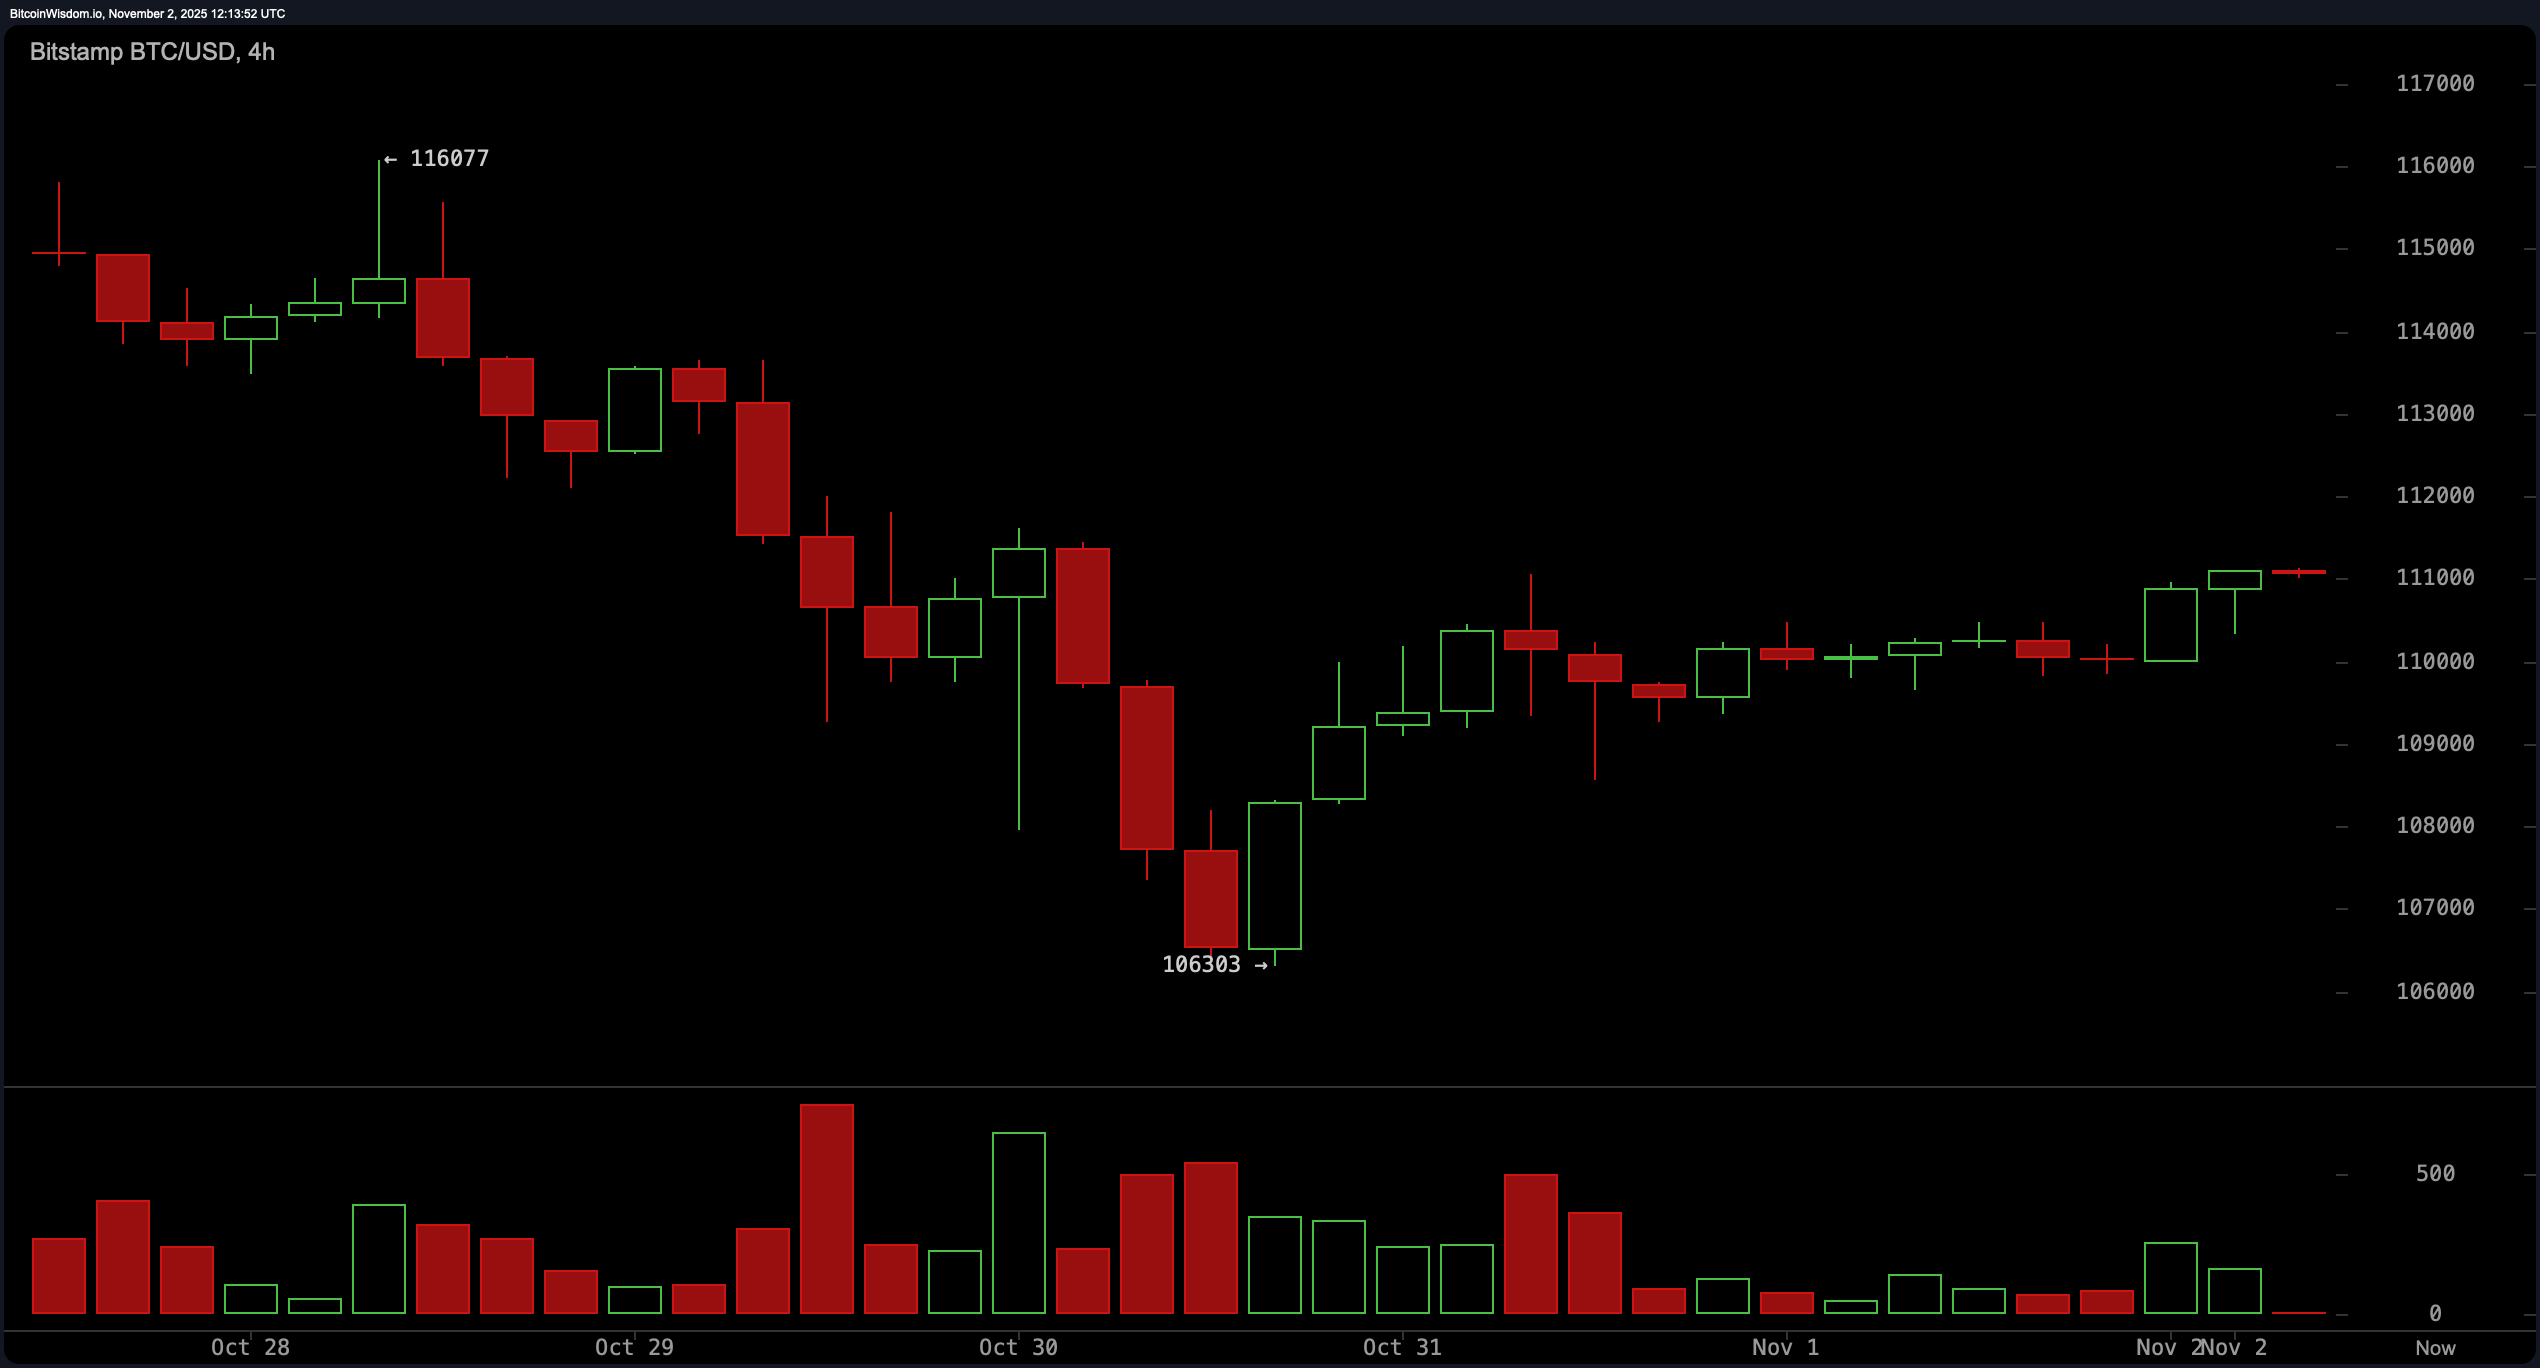
Zooming out to the 4-hour chart, the mood gets moodier. After a decisive drop to $106,303, bitcoin staged a curvy little comeback, forming what could be called a rounded bottom (or just a slightly optimistic bowl). Repeated rejection near $111,000–$111,500 reveals the market’s chronic altitude sickness at these levels. Decreasing volume on the upswing is your classic “is anyone even watching this rally?” red flag. A breakout with volume could take us to $114,000, but if the ceiling holds, we’re eyeing soft support zones at $109,500 and $108,500, like cautious renters unsure if they want to renew.

BTC/USD 4-hour chart via Bitstamp on Nov. 2, 2025.
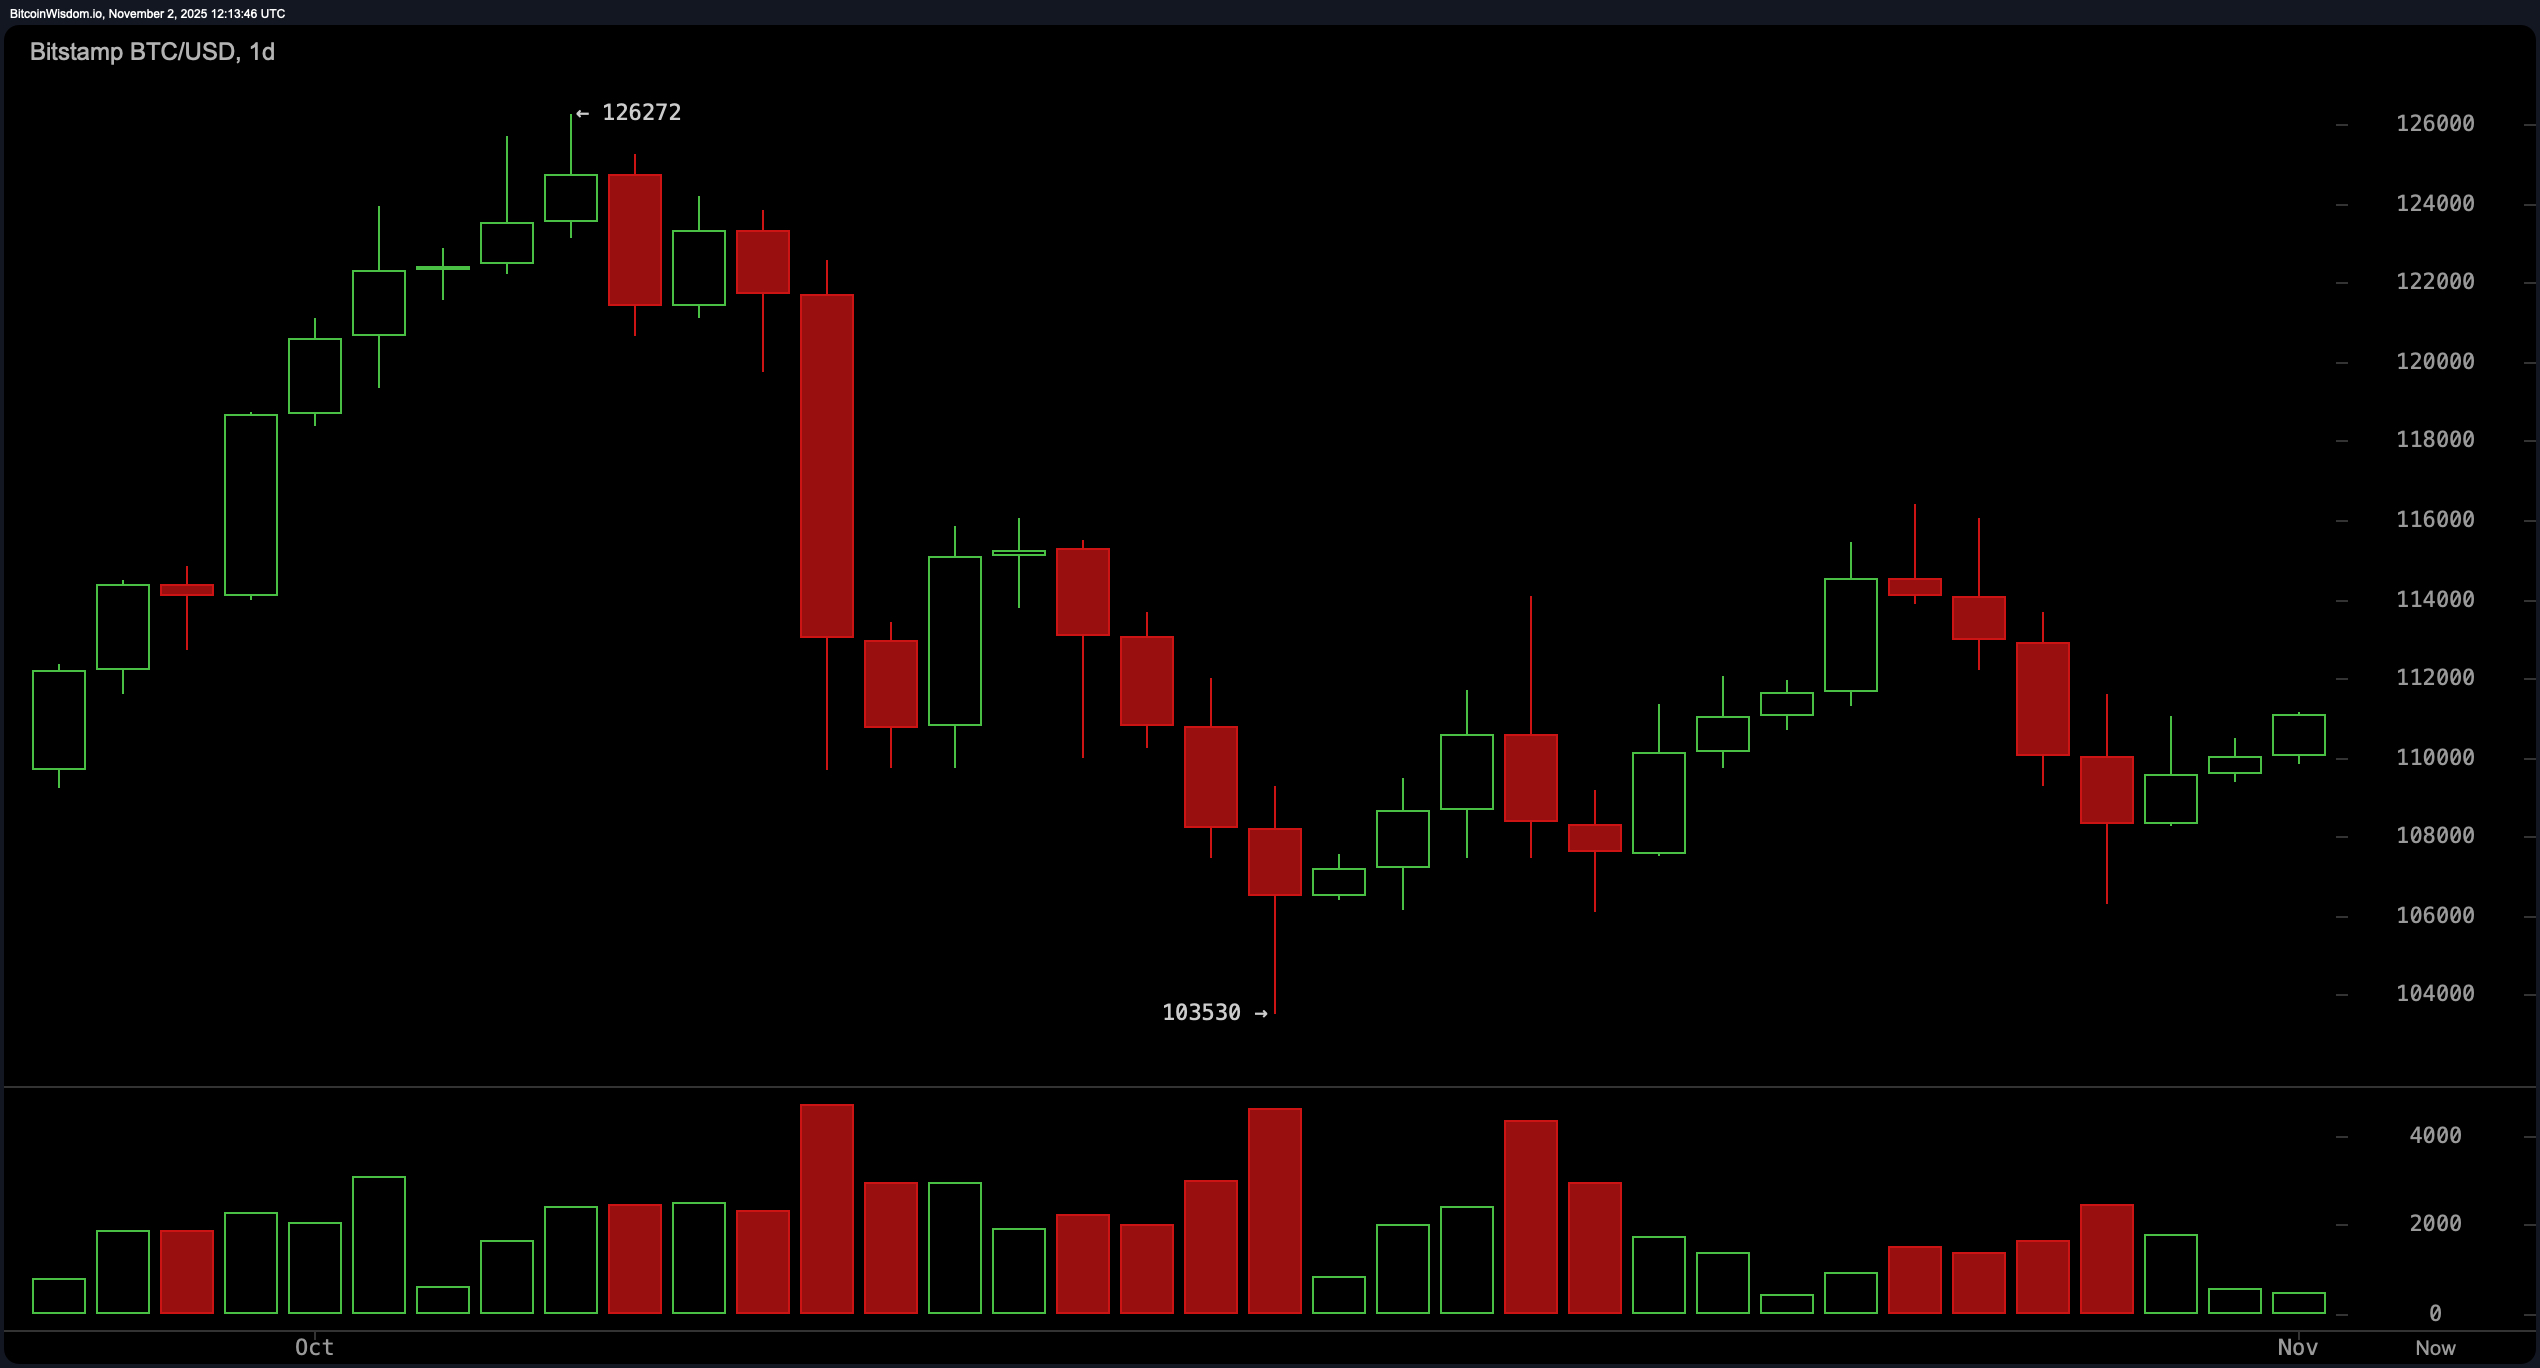
On the daily chart, things look like a hangover from October’s volatility binge. bitcoin cracked from a recent peak of $126,272, faceplanted at $103,530, and is now consolidating in a tight belt between $108,000 and $114,000. The falling candles are shrinking like they’re on a diet—suggesting bearish momentum is losing steam. Peak selling volume has fizzled, and a base seems to be forming, albeit nervously. A daily close above $114,000 would scream trend reversal and open the doors to $120,000+, but a breakdown below $108,000 could mean a long, slow trudge back to $103,500—or worse, a check-in at the dreaded $100K line.

BTC/USD 1-day chart via Bitstamp on Nov. 2, 2025.
From an indicator perspective, the oscillators are acting like a panel of undecided judges. The relative strength index (RSI) sits neutrally at 48, and both the Stochastic oscillator and commodity channel index (CCI) are similarly unbothered at 40 and 12, respectively. The average directional index (ADX) at 16 implies a market still figuring out what direction to commit to—if any. The Awesome oscillator has gone negative, while momentum has turned bearish at 906. Interestingly, the moving average convergence divergence (MACD) level remains bullish at -975, suggesting longer-term strength may still be lurking beneath the surface. Call it confused conviction.
The moving averages, meanwhile, are playing tug-of-war. Shorter-term exponential moving averages (EMAs), like the 10-day at $110,691, hint at upward pressure. But most of the heavyweights—especially the 30-day and 50-day simple moving averages (SMAs), both firmly above the current price—are pulling bitcoin toward a more grounded reality. The 200-day EMAs and SMAs, at $108,420 and $109,764 respectively, offer a sturdy floor if gravity takes over. The takeaway? Momentum is tentative, the trend is undecided, and traders are left reading tea leaves and price action.
Bull Verdict:
If bitcoin can decisively close above $114,000 on strong volume, the technical case strengthens for a push toward $118,000–$120,000. Momentum indicators may be conflicted, but with short-term support holding and longer-term moving averages flattening, the bulls could be gearing up for a calculated ascent rather than a reckless sprint.
Bear Verdict:
Failure to breach the $111,500–$114,000 resistance zone, coupled with declining volume and a sluggish momentum profile, could see bitcoin retreat to test $108,000 or even the $103,500 support range. If that floor breaks, the next psychological milestone—the $100,000 level—comes into play, potentially dragging sentiment and structure down with it.
- Where is bitcoin’s key support right now?
bitcoin is holding key support near $108,000 with deeper support at $103,500. - What price must bitcoin break to signal a bullish move?
A strong close above $114,000 could trigger a move toward $118,000 or higher. - Is momentum currently favoring bulls or bears?
Momentum is mixed, with weak oscillator signals and split moving average trends. - What’s the short-term price outlook for bitcoin?
bitcoin is consolidating between $109,700 and $111,000, awaiting a decisive breakout.
免责声明:本文章仅代表作者个人观点,不代表本平台的立场和观点。本文章仅供信息分享,不构成对任何人的任何投资建议。用户与作者之间的任何争议,与本平台无关。如网页中刊载的文章或图片涉及侵权,请提供相关的权利证明和身份证明发送邮件到support@aicoin.com,本平台相关工作人员将会进行核查。


