The overall cryptocurrency market has officially entered an oversold zone, and the market's panic and selling sentiment have gradually intensified. This evening at six o'clock, it briefly dipped to $103,550, marking the lowest record in two weeks. It is currently attempting to break through the downward trend line, with the price quoted at $103,800 at the time of writing, down about 3.37% in the last 24 hours.
Additionally, amid the market's violent fluctuations, the whale known for a 100% win rate recently suffered a painful loss today, liquidating $258 million worth of Bitcoin, Ethereum, and SOL in the first transaction, with a single loss amounting to $15.65 million.
In the previous 20 days, he accumulated a profit of $15.83 million through 14 trades, but today he almost gave it all back, which also confirms the old saying in the crypto circle: In contract trading, you can win a hundred times, but if you lose once, you have to return all your money to the market.
Alright, without further ado, let's take a look at this frequently shared four-hour chart of Bitcoin.
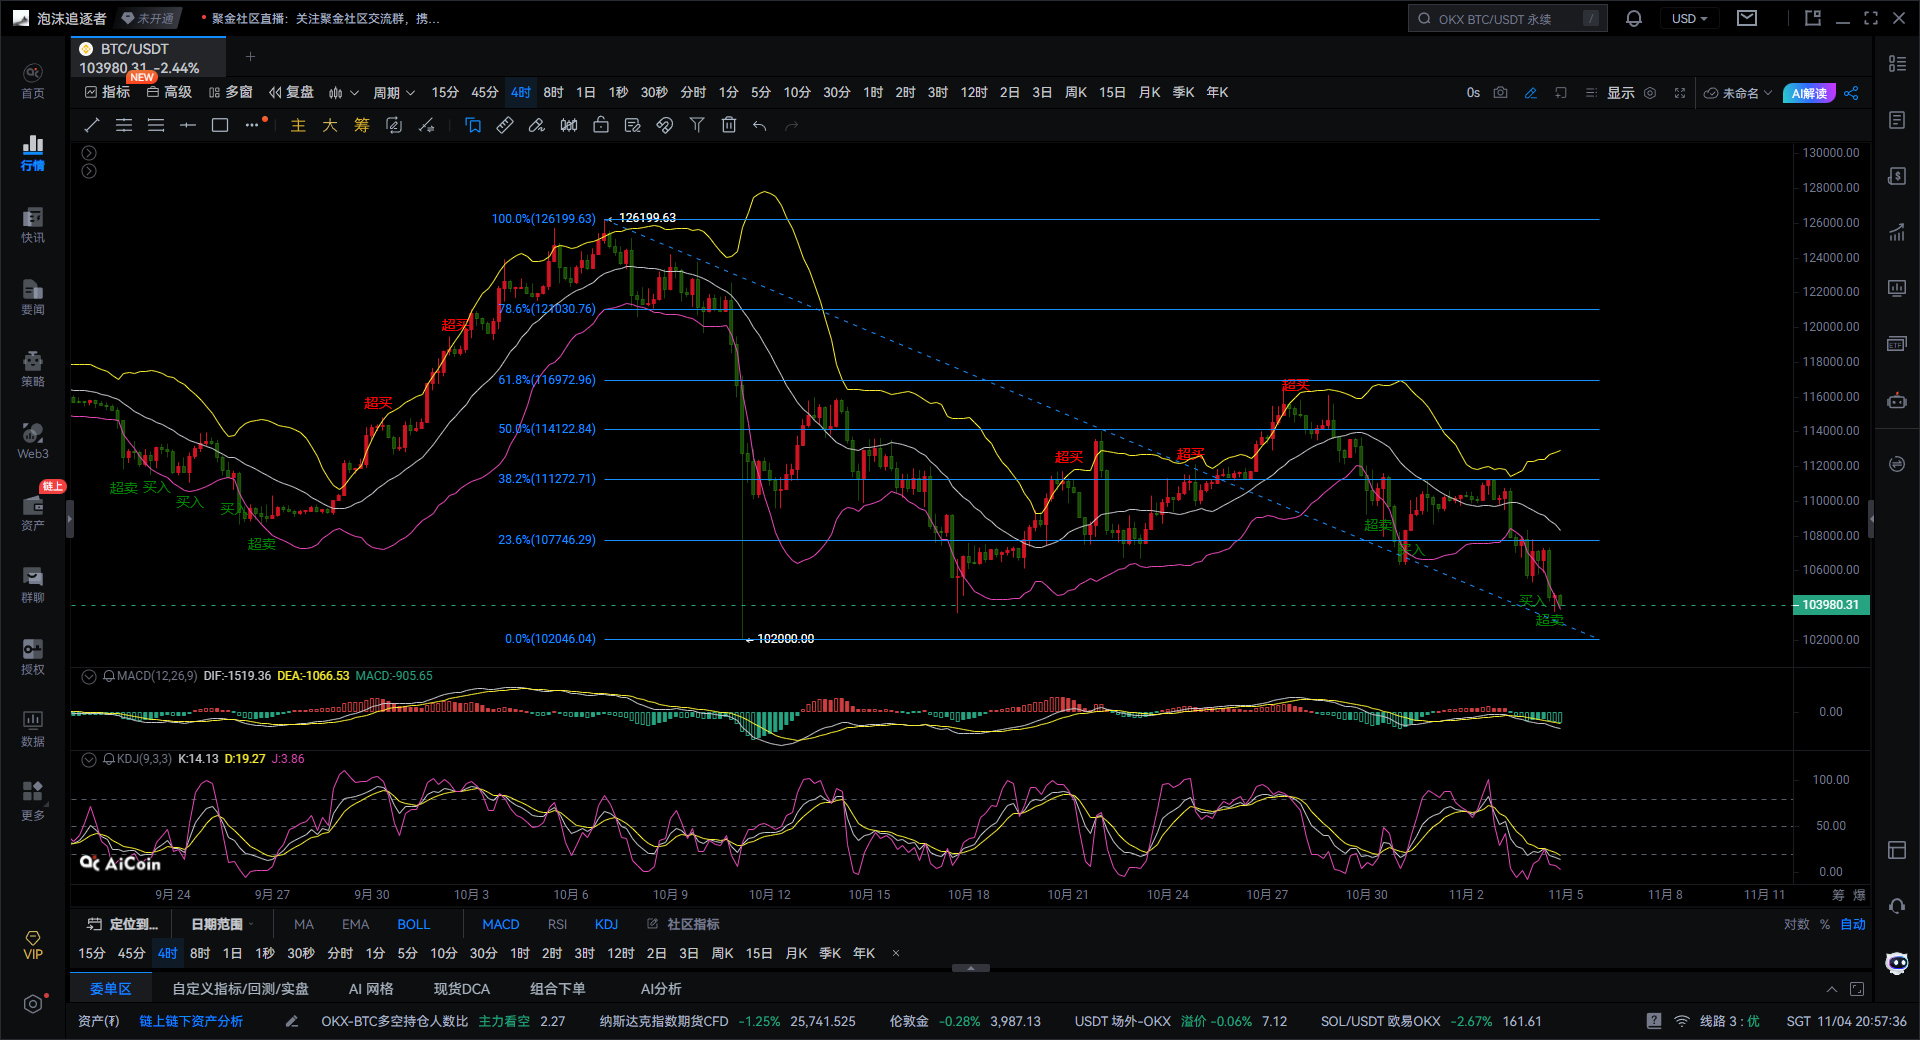
From this four-hour chart of Bitcoin, the current market is in a phase of downward channel, with a clear bearish structure. The price has continuously retreated from a high of $126,199 and is currently oscillating around $103,980, close to the previous support area around $102,000. This position also falls within the Fibonacci retracement level of 0%-23.6%, which is a key defensive zone. If it effectively breaks downwards, it may test the psychological level of $100,000. Currently, most K-lines are operating below the medium and short-term moving averages, with rebounds being suppressed by the middle band of the Bollinger Bands and the 50% retracement line, likely between $111,000-$114,000, reflecting that the bears still dominate.
The Bollinger Bands are expanding and moving downwards, with the upper band around $117,000, the middle band at $110,000, and the lower band extending to around $102,000. The price has touched the lower band multiple times, indicating that the downward momentum has not yet fully released, but there is a possibility of a short-term oversold rebound. If it can stabilize near the lower band and break upwards through the middle band, it could be seen as a signal to stop the decline. Key point to note: If a bullish candle with volume support appears around the lower band of $102,000, it may trigger a short-term rebound; however, if it continues to break below the lower band with volume, the bearish trend will be further strengthened.
The MACD indicator shows that the fast line DIF is currently around -1519, below the DEA line value of -1066, with both lines continuing to diverge downwards, indicating that bearish energy has not yet exhausted. Although the MACD green histogram has slightly shortened, it remains green, indicating that the downward momentum is weakening but has not reversed. Next, we should focus on whether the MACD green histogram can continue to contract; if the DIF crosses above the DEA to form a golden cross and the MACD histogram turns from green to red, it will be a technical signal for a short-term rebound. If the DIF forms a bottom divergence in the range of -1600 to -1500, a corrective rebound is expected; otherwise, if it falls below -1800, the price may test the psychological level of $100,000.
The KDJ indicator is in an oversold state, with the K value around 14, the D value around 19, and the J value around 13. The three lines are turning upwards from the bottom, indicating that short-term bearish momentum is weakening, and a technical rebound may occur. If the K line crosses above the D line with increased trading volume, the rebound will soon be established; however, if it continues to remain at low levels, market confidence is insufficient, and caution is still needed.
The Fibonacci retracement line from the high of $126,199 to the low of $102,046 shows key positions: the 23.6% retracement level of $107,746 is the first resistance level, the 38.2% level of $111,272 is a key dividing line, the 50% level of $114,122 is a mid-term resistance level, and the 61.8% level of $116,972 is a strong resistance zone. The current price is fluctuating between the 0% and 23.6% range; if it can hold the support at $102,000 and form a bottom pattern like a W bottom, it may repair upwards to the $107,700-$111,000 area; conversely, if it loses the $102,000 support, the next target may point to the $98,000 to $95,000 range.
In summary, there is a technical rebound demand in the short term of 1-3 days; for example, if the price stabilizes above $103,000 and trading volume increases, the target can be seen around $107,700. In the mid-term of 3 to 10 days, the MACD is still in a bearish pattern, and the trend has not reversed. If the rebound is blocked and falls back around the middle band of $110,000, the downward trend may continue. The key risk point is breaking below $102,000, which will trigger a new round of downward testing. If the rebound is weak and accompanied by volume decline, we need to be wary of the risk of breaking below the $100,000 level.
Based on the above, the following suggestions are provided for reference:
Bitcoin is currently oscillating in a strong support zone, with a slight rebound in the short term, but the overall trend is bearish.
Enter a light long position near $103,500, add to the position at $103,000, with a stop loss at $102,500; target $104,700-$106,700.
Giving you a 100% accurate suggestion is not as good as providing you with the right mindset and trend; teaching someone to fish is better than giving them fish. The suggestion is to earn for a moment, but learning the mindset will help you earn for a lifetime!
Writing time: (2025-11-04, 21:00)

(Written by - Daxian Talks About Coins) Disclaimer: Online publication has delays, and the above suggestions are for reference only. Investment carries risks; proceed with caution!
免责声明:本文章仅代表作者个人观点,不代表本平台的立场和观点。本文章仅供信息分享,不构成对任何人的任何投资建议。用户与作者之间的任何争议,与本平台无关。如网页中刊载的文章或图片涉及侵权,请提供相关的权利证明和身份证明发送邮件到support@aicoin.com,本平台相关工作人员将会进行核查。