In the first week of November, the sentiment in the cryptocurrency market is very poor.
Bitcoin has already dropped to a lower point than the "10.11" crash, failing to hold the $100,000 mark, and even falling below $99,000, marking a new low in the past six months, while Ethereum touched a low of $3,000.
The total liquidation amount across the network in 24 hours exceeded $2 billion, with long positions losing $1.63 billion and short positions liquidating $400 million.
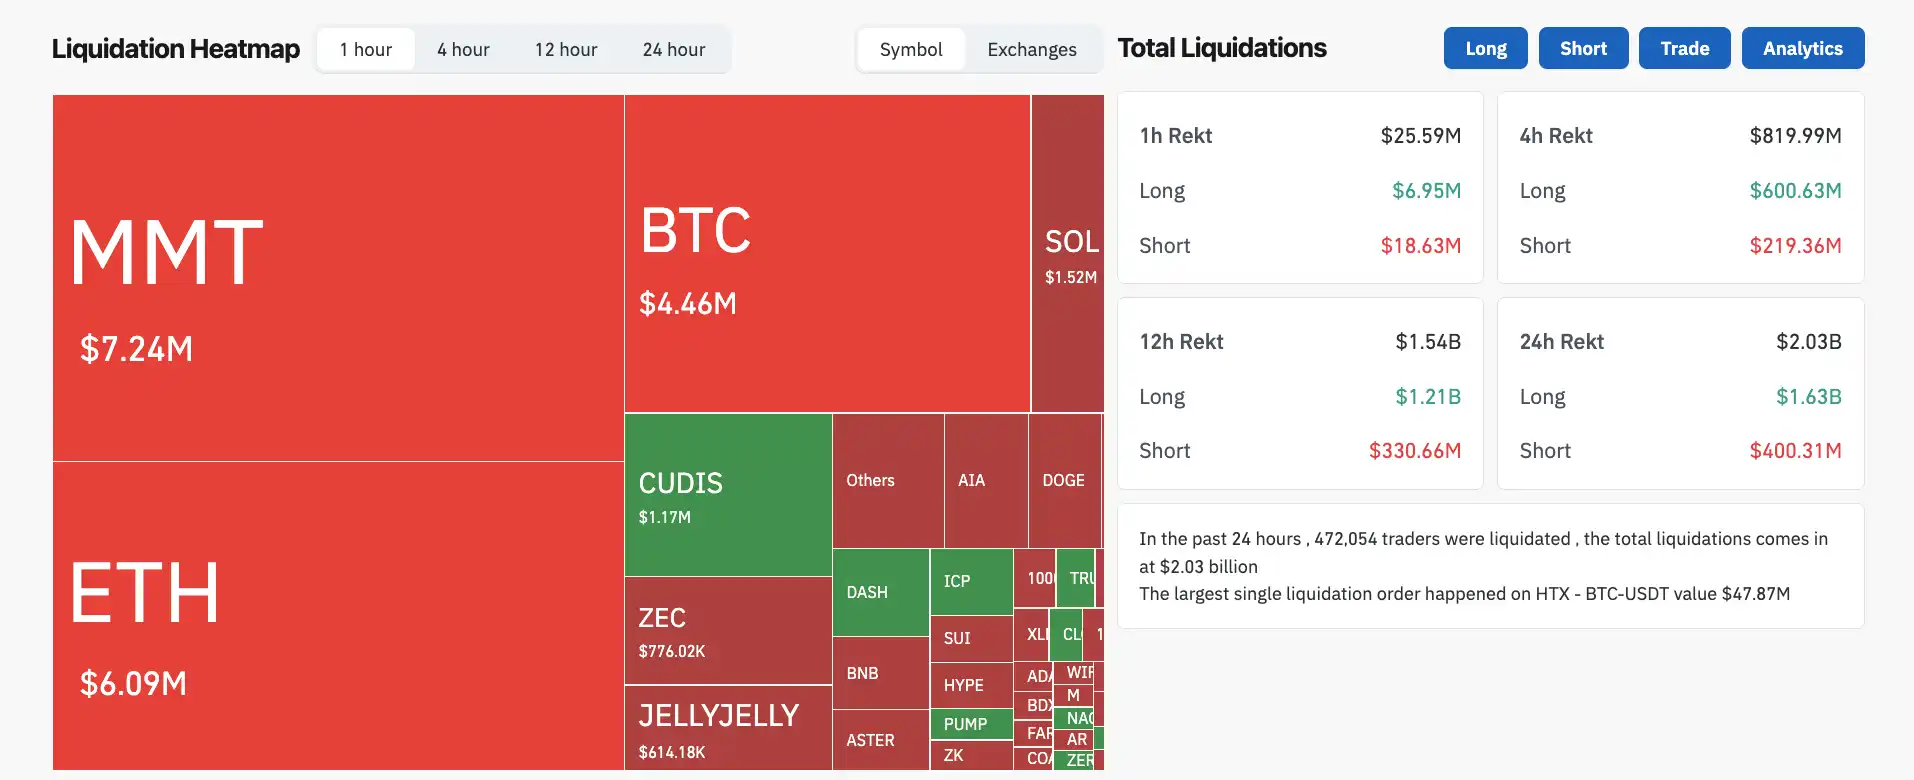
The worst hit was a long position of BTC-USDT on the HTX trading platform, which liquidated a single position of $47.87 million, topping the liquidation leaderboard across the network.
There are certainly some reasons behind the decline, which we can analyze in hindsight.
Industry News
For two consecutive days, projects have encountered issues. On November 3, the well-known DeFi project Balancer was hacked for $116 million due to a code problem. Balancer is a foundational DeFi project, even older than Uniswap, and such code issues have a significant impact on the industry.
On November 4, a wealth management platform named Stream Finance collapsed, with the official statement reporting a loss of $93 million, but the cause of the loss is unclear, and the official did not elaborate. The community speculates that it happened on the day of the "10.11" crash.
There is only so much money in the cryptocurrency market, and in these two days, it has decreased by another $200 million.
Macroeconomic Perspective
Looking at the global capital markets, on November 4, the entire world was in decline, with even the previously high-performing Japanese and Korean stocks falling, and U.S. stocks also dropping in pre-market trading.
First, there is the interest rate cut; last Wednesday, the Federal Reserve spoke, and the likelihood of a rate cut in December seems to have decreased, indicating that there is no urgent need to cut rates.
Then, there is also a net outflow from ETFs; last week, the net outflow from Bitcoin's U.S. stock ETF was $802 million, and on Monday, November 3, there was another net outflow of $180 million.
On November 5, there is another event: the U.S. Supreme Court will hold oral arguments for a "tariff trial," reviewing the legality of Trump's global tariffs. The uncertainty lies in the possibility that if the final ruling opposes Trump, the tariffs could be lifted, leading to new policy adjustments.
The U.S. federal government "shutdown" has entered its 35th day, tying the record for the longest "shutdown" in U.S. history. The government closure has led institutions to hedge against high-risk assets, triggering sell-offs.
Continuous Bloodletting of Spot ETFs
The outflow from ETFs is actually more severe than expected.
From October 29 to November 3, the largest Bitcoin spot ETF in the world, BlackRock's IBIT, which holds 45% of the market share, saw a cumulative net outflow of $715 million over four trading days, accounting for more than half of the total outflow of $1.34 billion in the U.S. Bitcoin ETF market.
Looking at the entire week, from October 28 to November 3, IBIT had a net outflow of $403 million, which is 50.4% of the total market outflow of $799 million, with a single-day outflow of $149 million on October 31, setting a record for the highest single-day outflow in the industry.
On November 4, BlackRock's Coinbase Prime custody address also conducted on-chain adjustments of 2,043 BTC and 22,681 ETH, leading the market to speculate that ETF holders are still continuously selling off crypto assets.
Although IBIT currently maintains an asset scale between $95 billion and $100 billion, holding about 800,000 BTC (accounting for 3.8% of the circulating supply), the outflow over four days corresponds to about 5,800 BTC, which also accounts for 0.7% of its holdings.
Despite the seemingly small proportion, it is significant because this is the industry leader, and the demonstration effect is evident.
Looking at the other major Bitcoin spot ETFs, the top five are BlackRock's IBIT, Fidelity's FBTC, Grayscale's GBTC, Bitwise's BITB, and ARK's collaboration with 21Shares, ARKB.
Fidelity's FBTC saw a net outflow of $180 million during the same period, accounting for 0.7% of its scale, which is considered moderate; Grayscale's GBTC has slowed down its redemptions after lowering its fee rate, with an outflow of $97 million this week; the relatively smaller BITB and ARKB saw weekly fluctuations around $50 million.
This wave of redemptions is essentially due to a sharp decline in investors' risk appetite, which is synchronized with macro high-interest rate expectations and Bitcoin's technical breakdown.
Long-term Holders on the Chain are Also Cashing Out
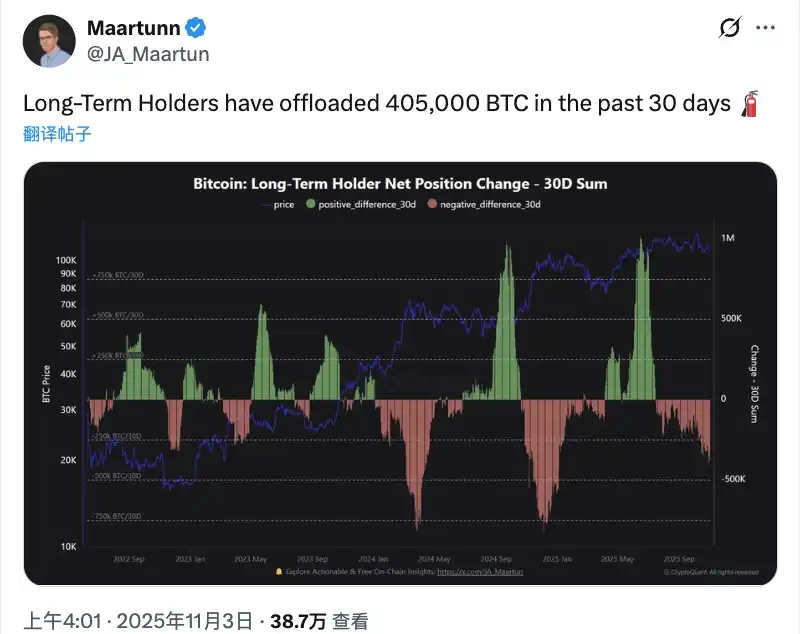
Even more aggressive than ETFs are the long-term players on the chain.
In the past 30 days (from October 5 to November 4), wallets that have held Bitcoin for more than 155 days, commonly referred to as "long-term holders" (LTH), have cumulatively net sold about 405,000 BTC, accounting for 2% of the circulating supply. Based on an average price of $105,000 during this period, they have cashed out over $42 billion.
These individuals still hold approximately 14.4 million to 14.6 million BTC, accounting for 74% of the circulating supply, making them the largest suppliers in the market. The issue is that their selling pace aligns perfectly with price movements: after Bitcoin reached an all-time high of $126,000 on October 6, profit-taking accelerated significantly; on the day of the "10.11" flash crash, there was a single-day outflow of 52,000 BTC; from the end of October to early November, coinciding with the four consecutive net outflows from ETFs, the average daily selling exceeded 18,000 BTC.
From on-chain data, the main sellers are actually the "middle-generation" wallets holding between 10 to 1,000 BTC, which were purchased 6 months to 1 year ago and are currently showing a profit of around 150%. In contrast, whales holding more than 1,000 BTC have slightly increased their holdings, indicating that top players are not bearish; rather, it is the medium-sized profit-taking that is being realized.
Historically, in March 2024, LTH sold 5.05% in a single month, during which Bitcoin fell by 16%; in December of last year, they sold 5.2%, leading to a 21% drop. This time, the October sell-off was 2.2%, with a price drop of only 4%, which is actually considered mild.
However, the simultaneous outflow from both ETFs and long-term holders has created a combined pressure that the market cannot withstand.
Judging the Bottom of the Decline
Glassnode has expressed the market view that the market continues to struggle above the short-term holding cost price (around $113,000), which is a critical battleground for both bulls and bears. If it fails to regain this level, it may further retreat to the actual price of active investors (around $88,000).
CryptoQuant CEO Ki Young Ju released a series of on-chain data last night, indicating that the average cost of Bitcoin wallets is $55,900, meaning holders are averaging a profit of about 93%. On-chain capital inflow remains strong, but prices cannot rise due to weak demand.
10x Research CEO Markus Thielen stated after the market decline that Bitcoin is approaching the support line since the crash on October 10. If it falls below $107,000, it may drop to $100,000.
Chinese crypto KOL Banmuxia publicly stated today that "the traditional four-year cycle bull market has ended, and Bitcoin will gradually drop to $84,000, then experience several months of complex fluctuations, before following the U.S. stock market's bubble to surge to $240,000 by the end of next year or early the year after."
Currently, the only good news is that historically, November has seen an average increase in Bitcoin prices.
免责声明:本文章仅代表作者个人观点,不代表本平台的立场和观点。本文章仅供信息分享,不构成对任何人的任何投资建议。用户与作者之间的任何争议,与本平台无关。如网页中刊载的文章或图片涉及侵权,请提供相关的权利证明和身份证明发送邮件到support@aicoin.com,本平台相关工作人员将会进行核查。