The violent decline of Bitcoin in the past two days completely aligns with our technical analysis logic (I have been suggesting to hold since the end of last month without providing any short-selling advice). Once it breaks below the support level of 106200, it will accelerate. Currently, after the daily update, the price is running below the lower Bollinger Band, with the MA5, MA10, and MA30 all resonating downwards. The lower Bollinger Band continues to open downwards, but current indicators are showing oversold conditions. Additionally, there is a gap of nearly 4000-5000 points between the price and the MA5 daily average, so a short-term oversold rebound is expected to test the upper resistance before continuing to decline. The current high point resistance for Bitcoin is referenced at the 103500-106000 range. For the current trend, if it cannot break through any upper resistance on a rebound, it still needs to maintain a bearish outlook.
On the 4-hour chart, the current K-line has been oscillating downwards and has formed a TD13, with the K-line showing a short-term double-bottom pattern. The MACD volume is decreasing, and the KDJ has shown a slight rebound three times in the short term. Combined with the hourly chart, the current short-term trend is leaning towards a slight oscillating rebound. The key focus for the day is to observe the breakthrough situation at the upper resistance of 103500-106000, with short-term low point support referenced at the 99000-98000 range. For day trading, my personal view is to first go long at lower levels and then consider shorting at higher levels.
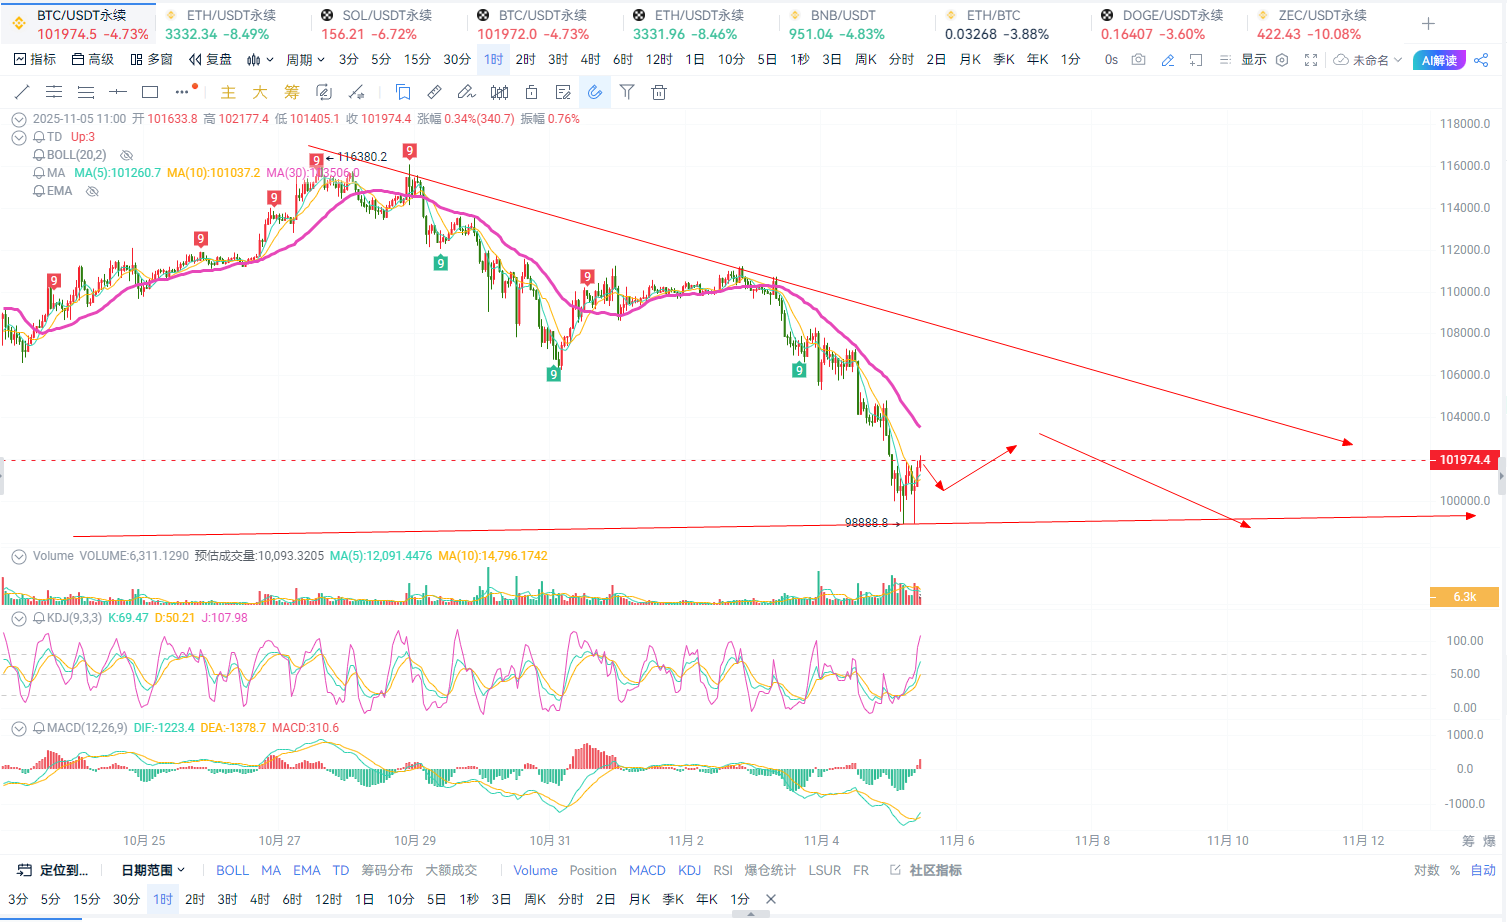
Trading suggestion: Try to buy at 100500-99500. Target: 102000-103500. Stop loss at 99000.
For shorting, consider entering at resistance levels with targets set at support.
Ethereum is moving in sync, but the overall trend and decline are greater than Bitcoin. The short-term trend is basically in sync with Bitcoin, with high point resistance referenced at the 3480-3670 range. A short-term oversold rebound is expected to test the upper resistance, with short-term low point support referenced at the 3050-2880 range. For day trading, my personal view is to first go long at lower levels and then consider shorting at higher levels.
Trading strategy: Try to buy at 3250-3200. Target: 3350-3450. Stop loss at 3170.
For shorting, consider entering at resistance levels with targets set at support.
For the current trend, it is expected to be sufficient, and I will continue to follow up.
Personal views are for reference only; there may be delays in article review and push notifications. The market changes rapidly, so specific entry and exit points should be based on real-time guidance. Please be cautious when entering the market.
Writing articles and analyses is not easy; I welcome everyone to like and support. A scientific and reasonable trading system, along with position control and risk management techniques, can help you reach greater heights! It will guide you out of confusion and darkness! Just like you, who are still indecisive at this moment, quickly scan the QR code to follow for surprises and real-time market analysis.

免责声明:本文章仅代表作者个人观点,不代表本平台的立场和观点。本文章仅供信息分享,不构成对任何人的任何投资建议。用户与作者之间的任何争议,与本平台无关。如网页中刊载的文章或图片涉及侵权,请提供相关的权利证明和身份证明发送邮件到support@aicoin.com,本平台相关工作人员将会进行核查。