The market is taking a beating as Bitcoin could be losing the $100,000 thershold sooner than anticipated, despite the slow and steady grow toward it throughout 2025. As BTC plummets, Ethereum and Shiba Inu follow in a similar manner: not crashing rapidly but bleeding out enough to lose every bit of buying support they had a few weeks ago.
Is Ethereum protected?
Ethereum's 200-day exponential moving average (EMA), which had served as a barrier since February, has now officially dropped. This breach is a structural breakdown that effectively eliminates the possibility of a near-term price reversal and signals a shift toward a more general bearish phase rather than merely a short-term correction.
ETH has sharply dropped to about $3,518 after weeks of consolidation around the $3,700-$3,800 range, breaking through the 200 EMA for the first time in almost nine months. Ethereum's capacity to stay above this crucial moving average has historically served as a launchpad for significant rallies. Losing it now suggests that persistent distribution has taken the place of bullish strength, weakening the market's underlying momentum.
HOT Stories Crypto Market Prediction: Ethereum (ETH) Just Lost It, Targeted Shiba Inu (SHIB) Sellout Confirmed, Can Bitcoin Hold $100,000?Ethereum's Buterin Reacts to New TPS RecordInsane XRP Futures Jump Triggered by Ripple SwellBREAKING: BTC Plunges Below $100K. Is $90K Next?
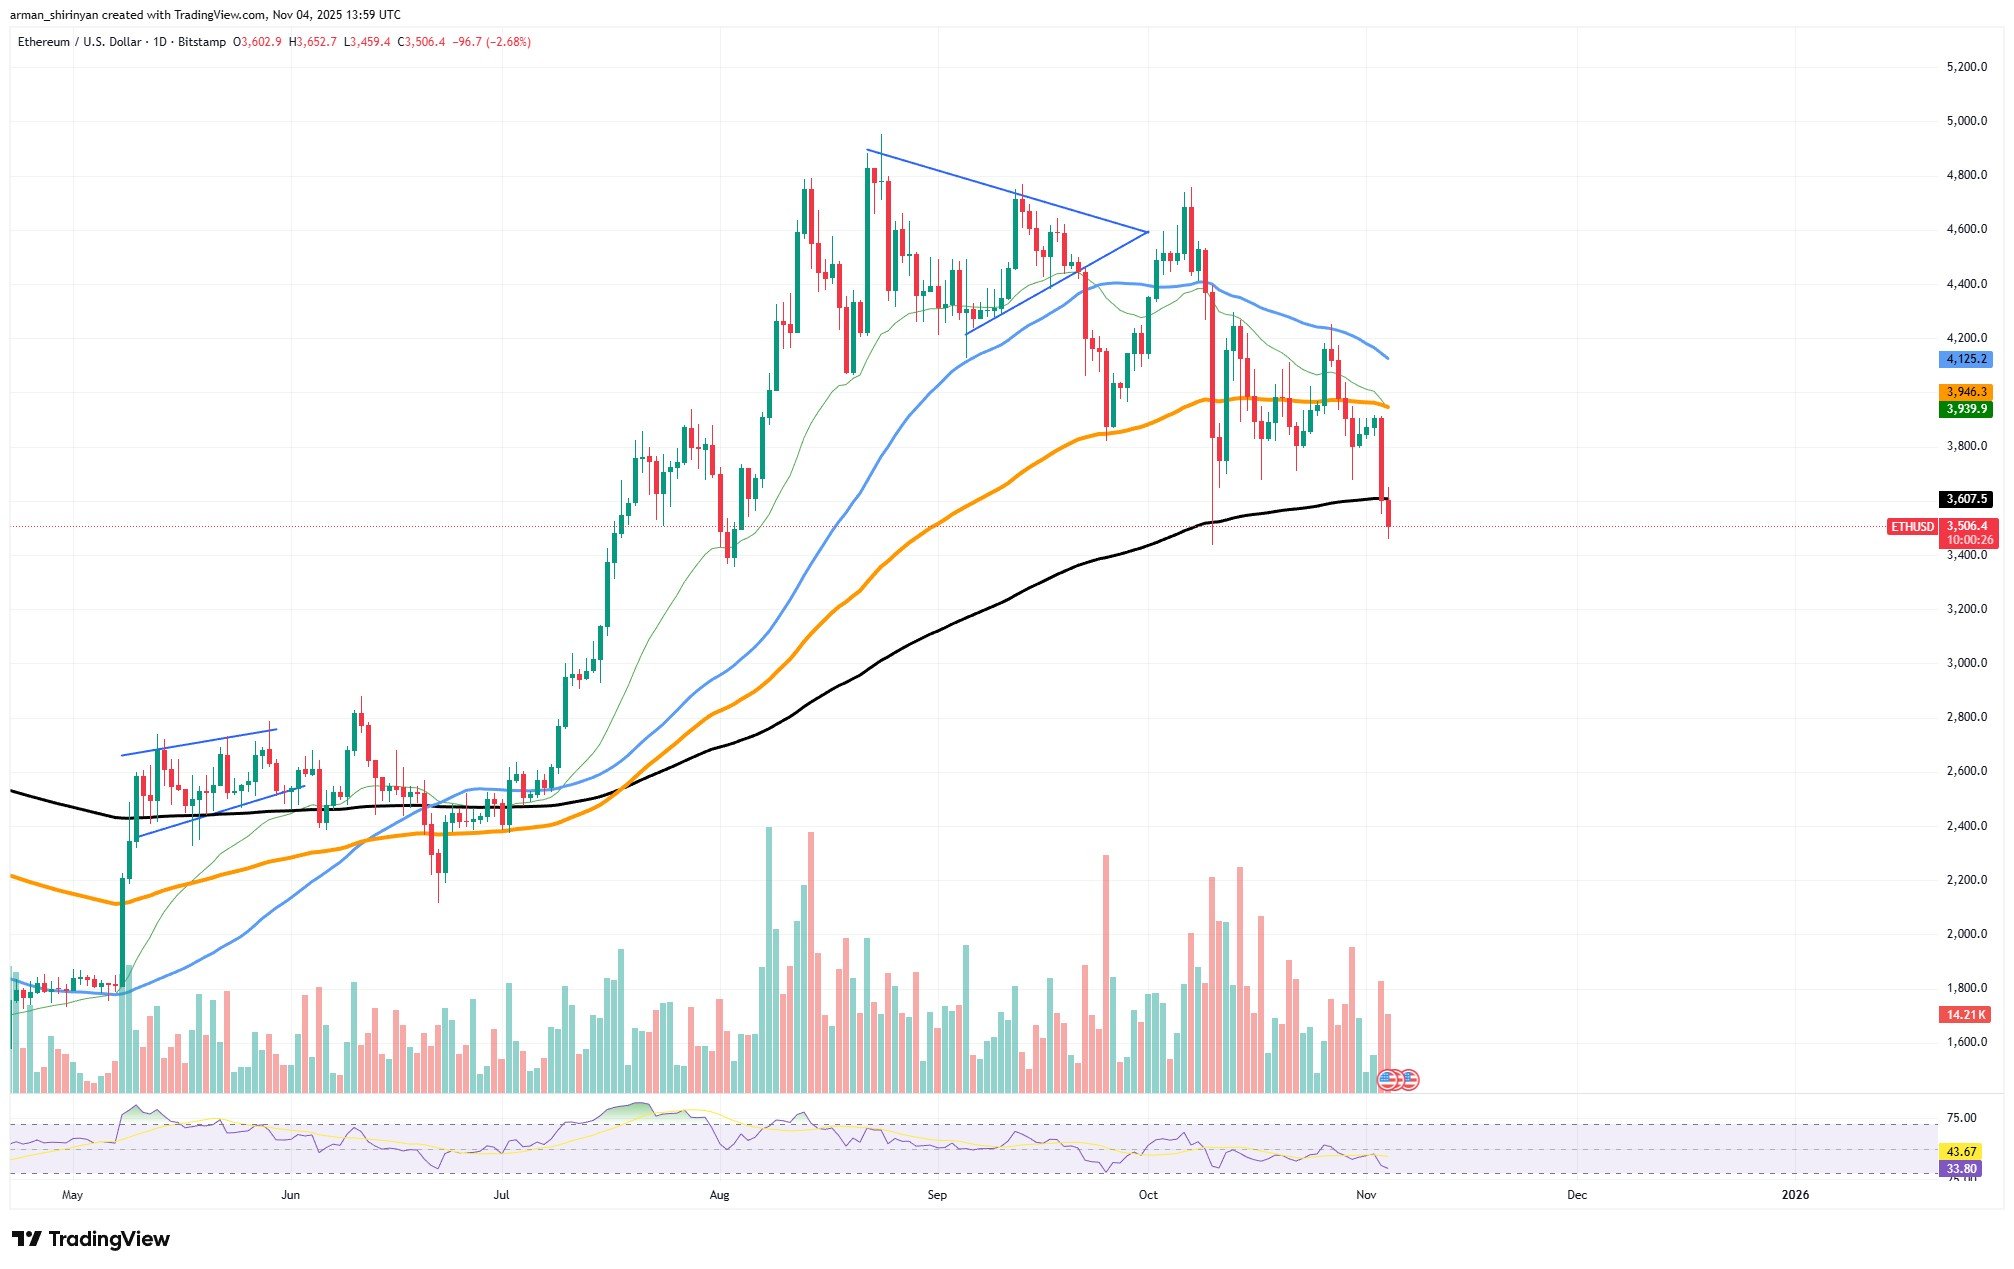
ETH/USDT Chart by TradingView
Growing selling volume coincides with the breakdown, indicating trader capitulation rather than brief volatility. The 50-day and 100-day moving averages, which are shorter-term moving averages, are sloping downward and are currently significantly above current price levels, adding layers of overhead resistance. ETH's shift from an accumulation phase to a possible long-term decline is solidified by this crossover dynamic.
Technically speaking, Ethereum's next significant support is located around $3,400. This is followed by a more crucial region around $3,200, where earlier consolidation zones might provide a short respite. However, there is little indication that buyers will intervene forcefully at these levels, given the lack of a recovery from the 200 EMA.
Growing oversold pressure is indicated by the Relative Strength Index (RSI) hovering around 34, but on bearish markets, this typically precedes further declines rather than an instant recovery. Ethereum essentially just lost it, both literally and figuratively. If the 200 EMA is not quickly reclaimed, ETH might be about to enter a lengthy correction phase that could last well into 2026.
Bitcoin waving at $100,000
BTC is currently trading close to $104,000, testing what may be the last area of short-term structural support after breaking below its 200-day moving average at $108,000. Every investor is wondering if Bitcoin can sustain this level or if a more significant decline is unavoidable.
In technical terms over the last two weeks, Bitcoin's structure has substantially declined. The recent breakdown validates a change in market sentiment from optimism to caution, and the string of lower highs since September has created a distinct downtrend.
You Might Also Like
Tue, 11/04/2025 - 13:07 Next 24 Hours Crucial for XRP Ledger: ReasonByTomiwabold Olajide
The 200-day moving average, which has historically been a crucial sign of the strength of long-term trends, has now turned into resistance. The path of least resistance remains downward as long as Bitcoin stays below this threshold. Near-oversold conditions are indicated by the Relative Strength Index (RSI), which is currently around 35.
Oversold, however, does not always indicate a reversal, particularly when the overall structure is becoming pessimistic. The next significant support level for Bitcoin is between $97,000 and $98,000, which corresponds to the late-spring consolidation zone if it is unable to hold $100,000. Short-term buying interest may be sparked by this level, but a long-term recovery will necessitate a clear reclamation of the $108,000-$110,000 range, which presently appears unlikely in the absence of a powerful catalyst.
Macroeconomic ally, speculative assets are being severely impacted by tightening liquidity and declining risk appetite. While short-term leverage and derivatives positioning continue to increase downside volatility, long-term holders remain stable. If Bitcoin is able to hold $100,000, it might try a gradual grind back toward resistance after consolidating for weeks.
Another Shiba Inu sell stage
Technical indicators and price structure seem to indicate that Shiba Inu is about to enter a targeted sellout phase, with more declines to come. The token has broken below its short-term ascending trendline following multiple unsuccessful attempts to regain resistance near $0.0000105, indicating fresh selling pressure in both the retail and institutional segments.
The year's crucial support zone is perilously close to the current price of $0.0000090, and a breakdown of this level could hasten a greater exodus of holders. The combination of technical and behavioral data that suggests coordinated or targeted distribution — where big holders progressively sell their positions to take advantage of thin liquidity zones — is more concerning.
You Might Also Like
Tue, 11/04/2025 - 08:14 Shiba Inu (SHIB) in Critical Condition: Worst State Since January 2024ByArman Shirinyan
The 50-day, 100-day and 200-day major moving averages are all stacked above the current price on the chart, indicating a fully developed bearish trend. Since early August, the 200-day MA in particular has served as a ceiling, and any attempt to reach it has resulted in harsh rejections. This structure is very similar to the last phases of a long-term distribution cycle.
Additionally, volume analysis shows a pattern: every small rally has been accompanied by higher selling volume, indicating that larger entities are taking advantage of brief upticks to sell their positions. The setup suggests persistent weakness rather than a recovery when combined with weak retail inflows and a Relative Strength Index (RSI) close to 33.
SHIB may drop toward the next psychological support at $0.0000080 if selling keeps up its current pace. If market sentiment does not stabilize, it may even return to the $0.0000070 range.
免责声明:本文章仅代表作者个人观点,不代表本平台的立场和观点。本文章仅供信息分享,不构成对任何人的任何投资建议。用户与作者之间的任何争议,与本平台无关。如网页中刊载的文章或图片涉及侵权,请提供相关的权利证明和身份证明发送邮件到support@aicoin.com,本平台相关工作人员将会进行核查。