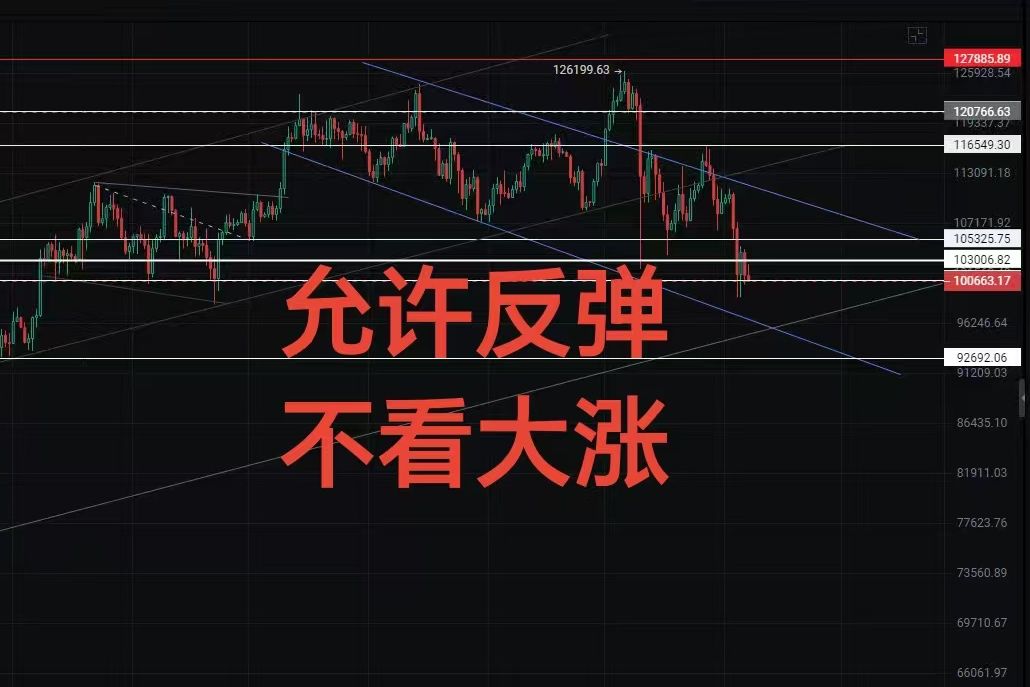
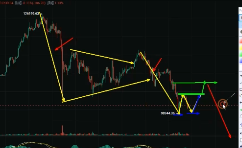
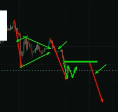
Today is October 7th, Friday. Let's take a look at today's market for any opportunities. I will first interpret the overall market situation for everyone. Currently, regarding Bitcoin, I am looking at the 4-hour chart. From the overall structure, it is very clear. Here, after reaching a peak at 126,100, the first wave of decline formed a triangular consolidation. After breaking down, it extended into the third wave, which is a downward wave of three.
Currently, we need to pay attention to whether this area can establish a double bottom at 99,000.
If a double bottom is established, this position should rebound again, and then challenge the upper resistance levels of 104,700 and 104,500.
If it can break above this resistance level again, it will then go to the positions of 107,100 and 107,300.

With 108,400 as the stop-loss point, if this wave of the market challenges 107,300 and 107,100 again, and if it still cannot break through 108,400, there will be another wave of decline, forming a serious three-wave downward trend.
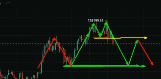
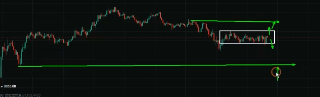
Looking at the larger cycle, as I mentioned to my partners, it requires a longer time to develop. If Chen Long's statement about the current neckline at 107,250 is correct, then a small double top has formed here.
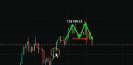
If it breaks below 107,200, in other words, we need to pay attention to a year-on-year decline, which is 74,500. The first position is set here.

If the position of 74,500 stabilizes again, confirming a stop in the decline, it may rebound again and challenge the neckline at 107,200. When it starts to adjust again, we need to correspond to the basic shape on the left side. In the technical K-line operation, we must always pay attention; the technical aspect emphasizes symmetry.
You will find that in past trends, a clear wave of increase will be followed by a wave of decrease, and a wave of decrease will be followed by a wave of increase. This is the symmetry of the pattern; the trajectory of K-lines is like our sun and earth.
Therefore, as Chen Long said, once this pattern is formed, if 74,500 goes downhill, then the direction will be clear.
So as long as this pattern is established, it will definitely take time to develop. For now, we can only demonstrate the future market, which may have opportunities to develop like this. Currently, in terms of the hourly chart, the low-level oscillation market here is also a directional choice, as mentioned in the 4-hour chart. If it can choose to go down again and test the bottom near 99,000, it may establish a double bottom here to challenge 104,500, and then push up to challenge the resistance levels of 107,100-107,300.
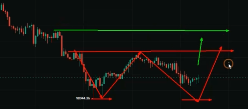
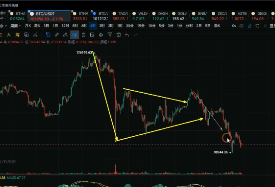
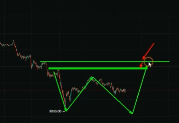
This is the current situation for Bitcoin, as this position has temporarily stopped declining on the hourly chart. The two-hour chart has also temporarily stopped declining. As for the altcoin, this wave is completely identical to Bitcoin. This position can only be said to have temporarily stopped declining, remaining in a low-level oscillation market that follows the rhythm of Bitcoin. When Bitcoin goes up, it goes up; when Bitcoin goes down, it goes down. This is a typical case of wolves going up and dogs going up, and wolves going down and dogs going down. Therefore, the rhythm is basically the same as Bitcoin. Previously, I also mentioned to my partners that the break of 3353 determined that it was a bearish market. The break of 3353 confirmed the bearish trend in this wave, so we don't need to look at it anymore. This area is the top. After the top, the first wave of decline has formed, and the third wave of decline has also formed. Subsequently, there will definitely be another wave of decline, which is clearly a three-wave downward trend.

In other words, this is also a triangle break that triggered this wave of bearishness. As for whether this area forms a double bottom or a triangle, we still need further confirmation. However, once you notice 3,560, if this position cannot be surpassed, it will continue the bearish trend.
Currently, 3,560-3,580 serves as the core key position. If this wave cannot break through, it will continue the bearish trend.
This is the overall thought process for the altcoin in this wave. Where will it go down to? There is always a chance to challenge the position of 2,535.
2,535 is the position we can currently see. If it genuinely moves down in this wave, the small cycle is also stuck at this position, choosing a direction.
This is clearly an area for choosing a direction. If it breaks above here, it will continue the bullish trend to where? 3,000 temporarily, 3,400. If it continues to break down from here, where will it go? 3,175 are the two positions we can currently see.
If it goes up again, it will challenge the upper level of 3,480. So currently, in the small cycle, the visible points are at this point of choosing a direction. If, as Chen Long said, 3,480 can also break through, it will again form a second bottom. For example, if it dips here to form a second bottom at 3,480 and breaks through, then where will it challenge? It will genuinely go to the upper levels of 3,560-3,580, which is the first resistance level. Further up is 3,640, which is the neckline position we can currently see. These are the two neckline positions.
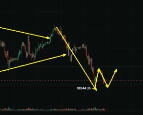
There is always a possibility of triggering a five-wave decline again. This is the current overall market thought process.
For more strategies, follow the public account BTC-ETH Crypto.

免责声明:本文章仅代表作者个人观点,不代表本平台的立场和观点。本文章仅供信息分享,不构成对任何人的任何投资建议。用户与作者之间的任何争议,与本平台无关。如网页中刊载的文章或图片涉及侵权,请提供相关的权利证明和身份证明发送邮件到support@aicoin.com,本平台相关工作人员将会进行核查。