The current Greed and Fear Index is 21, close to the "Extreme Fear" range.
Generally, when the index is near 20, the market often experiences a rebound or even a temporary bottom. However, we still need to focus on price action, as there are currently no clear reversal signals.
Even if the sentiment indicator is at a low level, prices may still fluctuate downward or decline gradually.

The current Greed and Fear Index is 21, close to the "Extreme Fear" range. Generally, when the index is near 20, the market often experiences a rebound or even a temporary bottom. However, we still need to focus on price action, as there are currently no clear reversal signals.
Even if the sentiment indicator is at a low level, prices may still fluctuate downward or decline gradually.
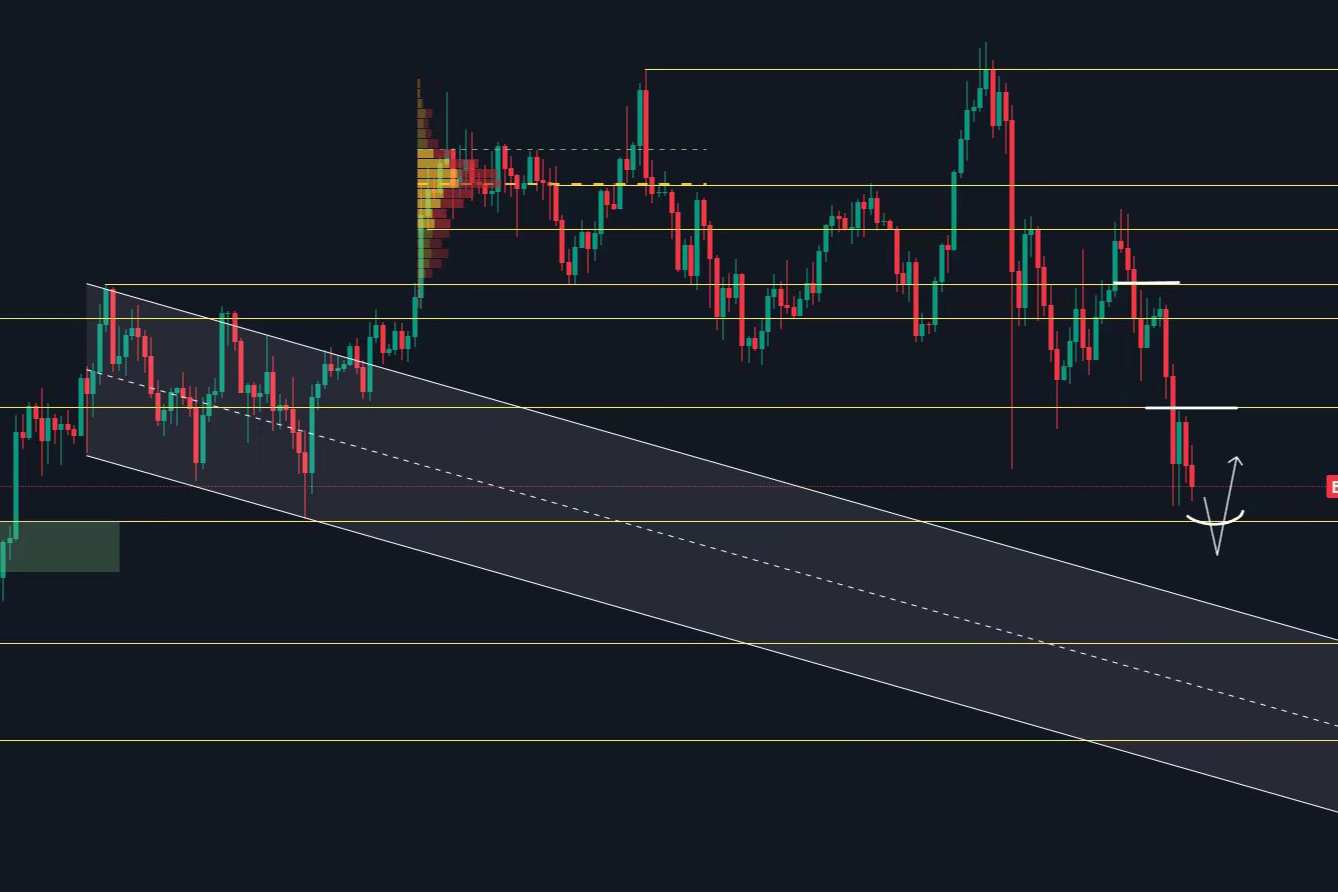
Bitcoin has been in a consolidation phase from Thursday to Friday, and this week is likely to experience narrow fluctuations within the range of the upper highs and lower lows, with little volatility over the weekend.

The key resistance level above is in the area of the previous spike low, which has been tested twice. Last night's rise also tested this position. If this resistance is effectively broken, it may form a right-side elevated double bottom structure; however, it has not yet broken, and a reversal cannot be confirmed.
The main pressure above is at 100,700, which is a critical support level from the previous consolidation bottom. The market is still in a bearish trend, and the upper turning point has not been broken. If participating in short positions during the day, the stop-loss point should be set around 105,000, and a small position can be attempted for a high short. If 105,000 is broken, wait for the market to test the 100,700 resistance before deciding whether to set up new short positions based on the trend.
Weekly Structure and Mid-term Direction
If the price breaks above 100,700 and stabilizes, we can switch to observing the weekly chart. Focus on the 50-week moving average (approximately 103,000).
The current price is around 103,000. If this week closes above it and next week closes positively, the market may form a structure similar to the past "break and recover," moving higher again. If next week closes below the moving average, further downward movement should be anticipated.

Downward Targets and Key Support
We warned earlier when the price was around 120,000-124,000 that it might retest the 50/60-week moving average and break below the 100,000 integer level. This target has now been achieved, and we need to observe closely.
If it continues to decline, the next bearish target is at 94,000 (the 0.618 position on the daily chart).

Long-term support is within the VGS channel, approximately in the range of 50,000-70,000.

Spot holders do not need to rush to act. If the 50-week moving average breaks, this channel range may become the next buying opportunity for spot purchases. This decline is expected to last for about two quarters, possibly extending into early or mid-next year.
If the 100,000 integer level stabilizes and rebounds from hourly to daily charts, the aforementioned downward expectations will be negated, and the market may have a chance to reach new highs.
About Altcoins
I warned months ago that the altcoin season had ended, and it is advisable to clear positions early and not to catch the bottom. Many still believe that holding coins in their original form is not a loss, but this thinking is incorrect. Altcoins often decline more than expected; for example, a capital of 100,000 may drop to 10,000 or even a few thousand, which is no different from liquidation.
Bitcoin spot is relatively safe, but Ethereum and other altcoins carry extremely high risks. Other coins, besides Bitcoin, are speculative assets and should not be held long-term or through dollar-cost averaging.
Typically, Bitcoin rises for a quarter after hitting a bottom, and altcoins will then catch up, with at least a 3-month lag. Therefore, there is no need to pay too much attention to altcoin trends at this stage.
Follow me for progress together. The article is published with a delay and is for reference only.

免责声明:本文章仅代表作者个人观点,不代表本平台的立场和观点。本文章仅供信息分享,不构成对任何人的任何投资建议。用户与作者之间的任何争议,与本平台无关。如网页中刊载的文章或图片涉及侵权,请提供相关的权利证明和身份证明发送邮件到support@aicoin.com,本平台相关工作人员将会进行核查。