Good evening, brothers!
The prices of securities are like a huge game of roulette, the only difference being that what appears here are not the numbers on the ball, but the fluctuations in price. How stock prices fluctuate on a given day is a random event and cannot be determined by past price change trajectories. Just like the ball in roulette, stock market prices have no memory. Supporting this view are various related events that affect the capital markets. Even if they are not random, they are certainly not determined by past stock price charts. These events include interest rate declines, disasters, wars, storms, election results, and other events in the real world. All of this has no effect on chart analysis. If, according to a specific equation, stock prices are supposed to keep rising, will that rise actually come? Is this credible?
……
Bank of America believes that there may not be any more interest rate cuts during Federal Reserve Chairman Powell's term.
According to the Wind Trading Desk, Bank of America has released one of the most aggressive predictions on Wall Street, stating that the FOMC will not lower interest rates again during Powell's term, which sharply contrasts with the market's general expectation of a rate cut in December.
The background of this bold prediction is that although the Federal Reserve cut rates in October, Powell himself immediately made cautious remarks, stating that a rate cut in December is "far from a done deal." Meanwhile, the ongoing government shutdown in the U.S. has delayed the release of key economic data, leaving the Federal Reserve and investors in a decision-making "fog."
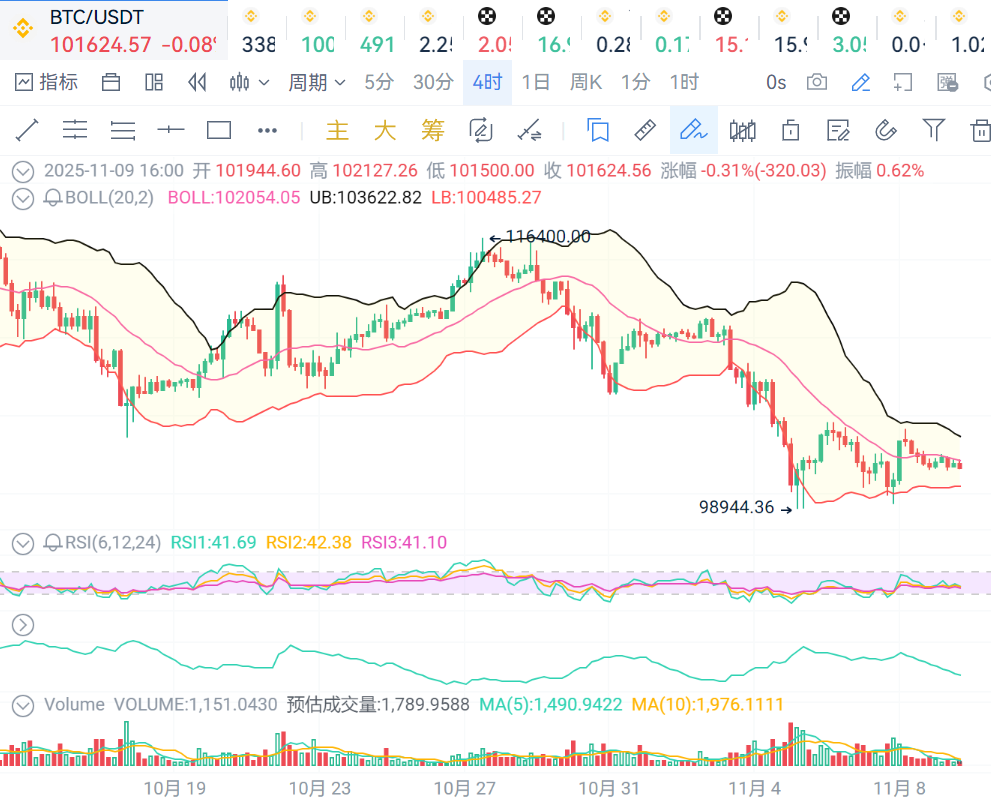
BTC: On the 4-hour level, the price continues to stay below the middle band of the Bollinger Bands, showing a weak price trend.
On the daily level, the price continues to stay under the pressure of the moving averages.
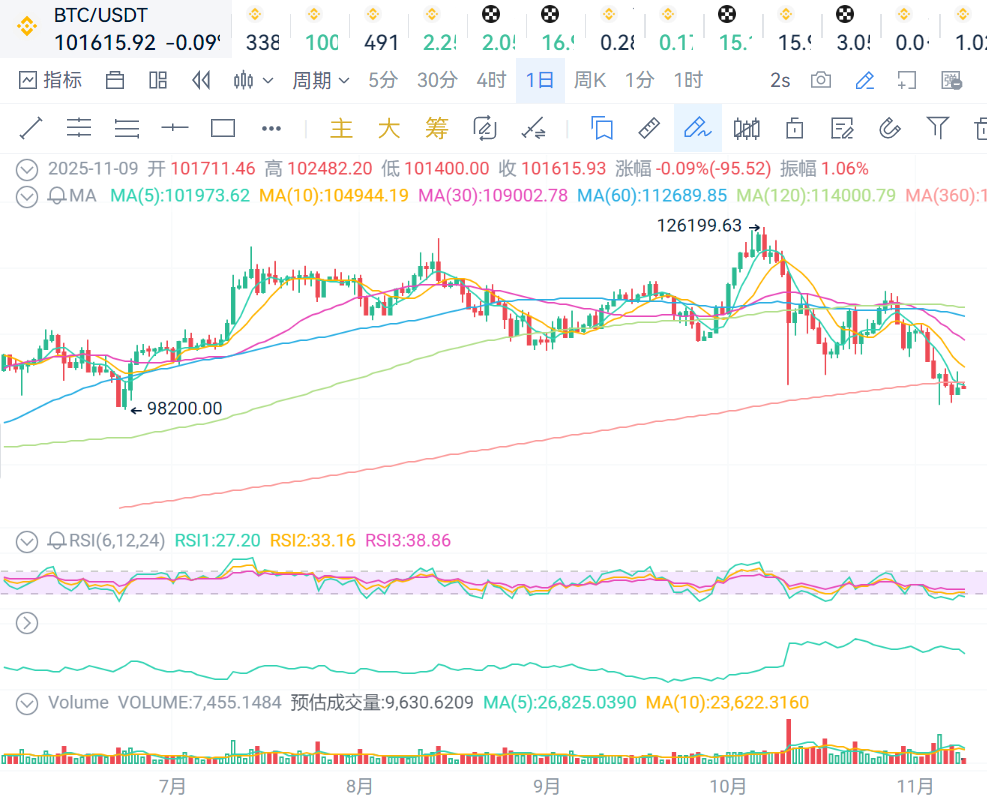
In summary, the support level is 101400, and the resistance level is 101800.
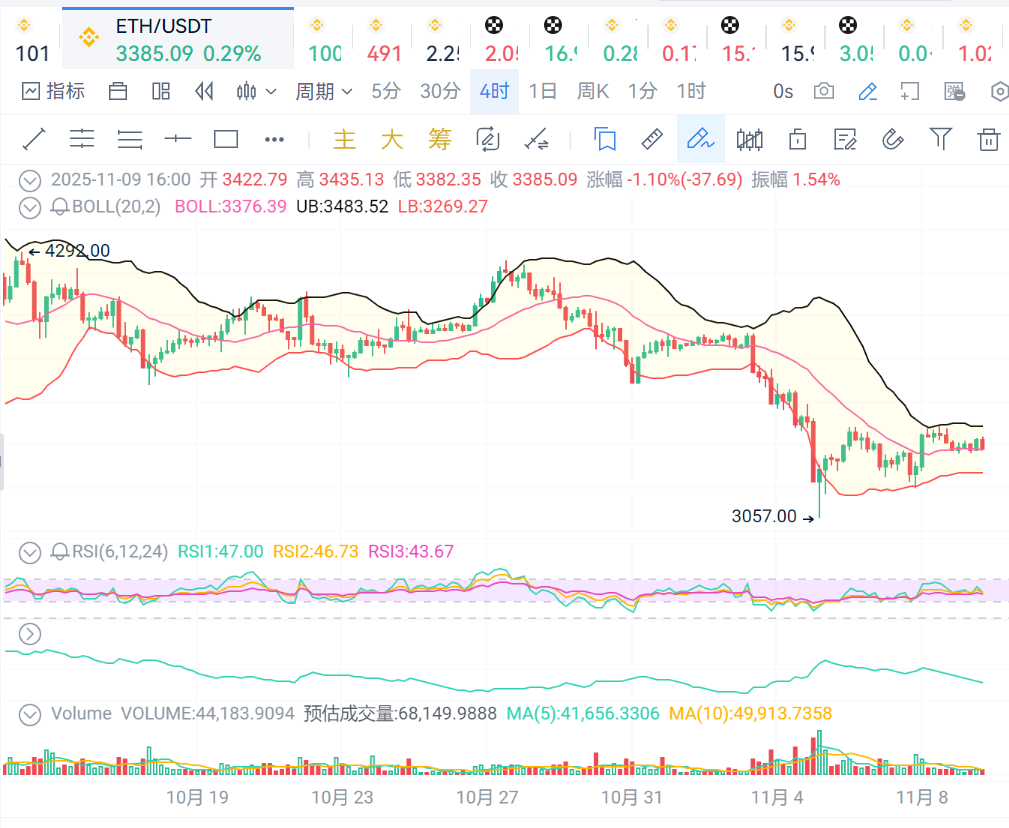
ETH: On the 4-hour level, the price continues to stay above the middle band of the Bollinger Bands, with a still oscillating price trend, support level at 3370, and resistance level at 3400.
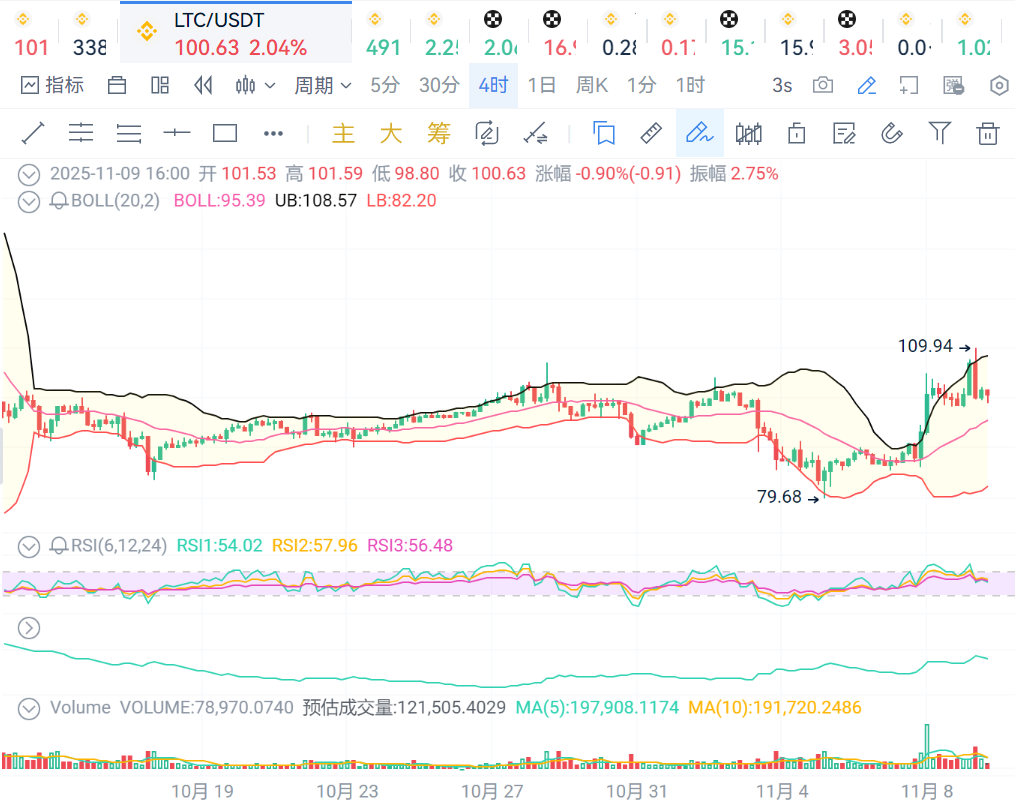
LTC: The price continues to stay above the middle band of the Bollinger Bands, with a healthy price trend, support level at 98, and resistance level at 102.
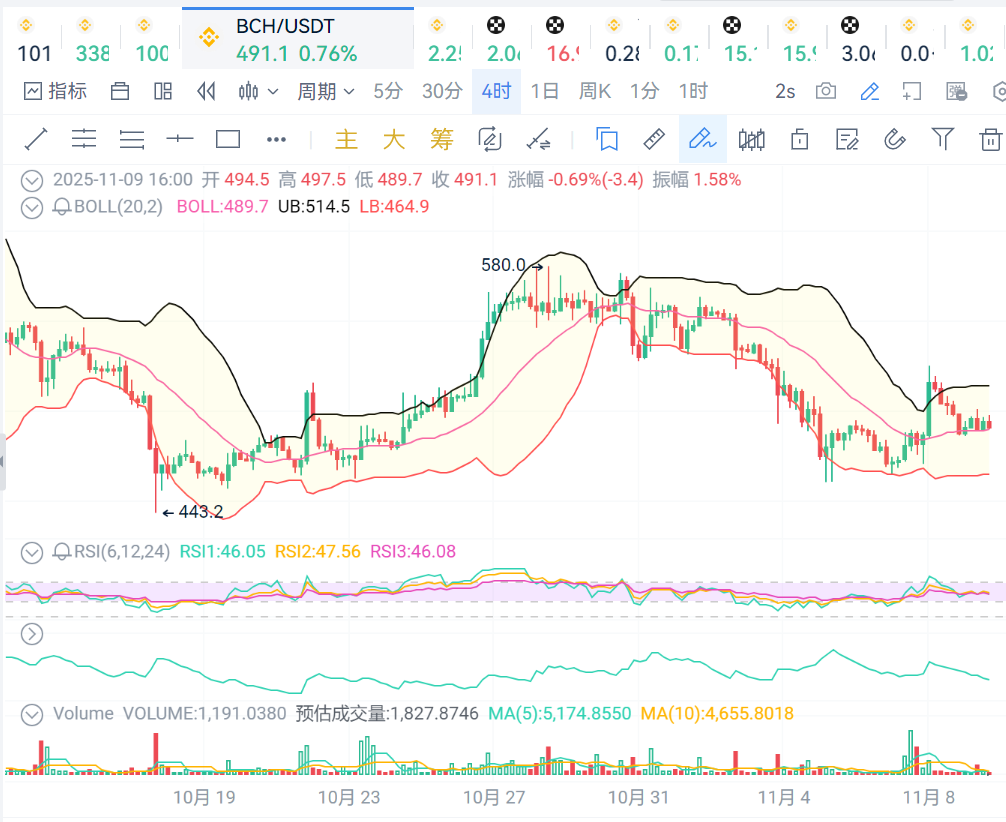
BCH: The price continues to oscillate near the middle band of the Bollinger Bands, with a support level at 480 and a resistance level at 500.
That's all for now, good night!

免责声明:本文章仅代表作者个人观点,不代表本平台的立场和观点。本文章仅供信息分享,不构成对任何人的任何投资建议。用户与作者之间的任何争议,与本平台无关。如网页中刊载的文章或图片涉及侵权,请提供相关的权利证明和身份证明发送邮件到support@aicoin.com,本平台相关工作人员将会进行核查。