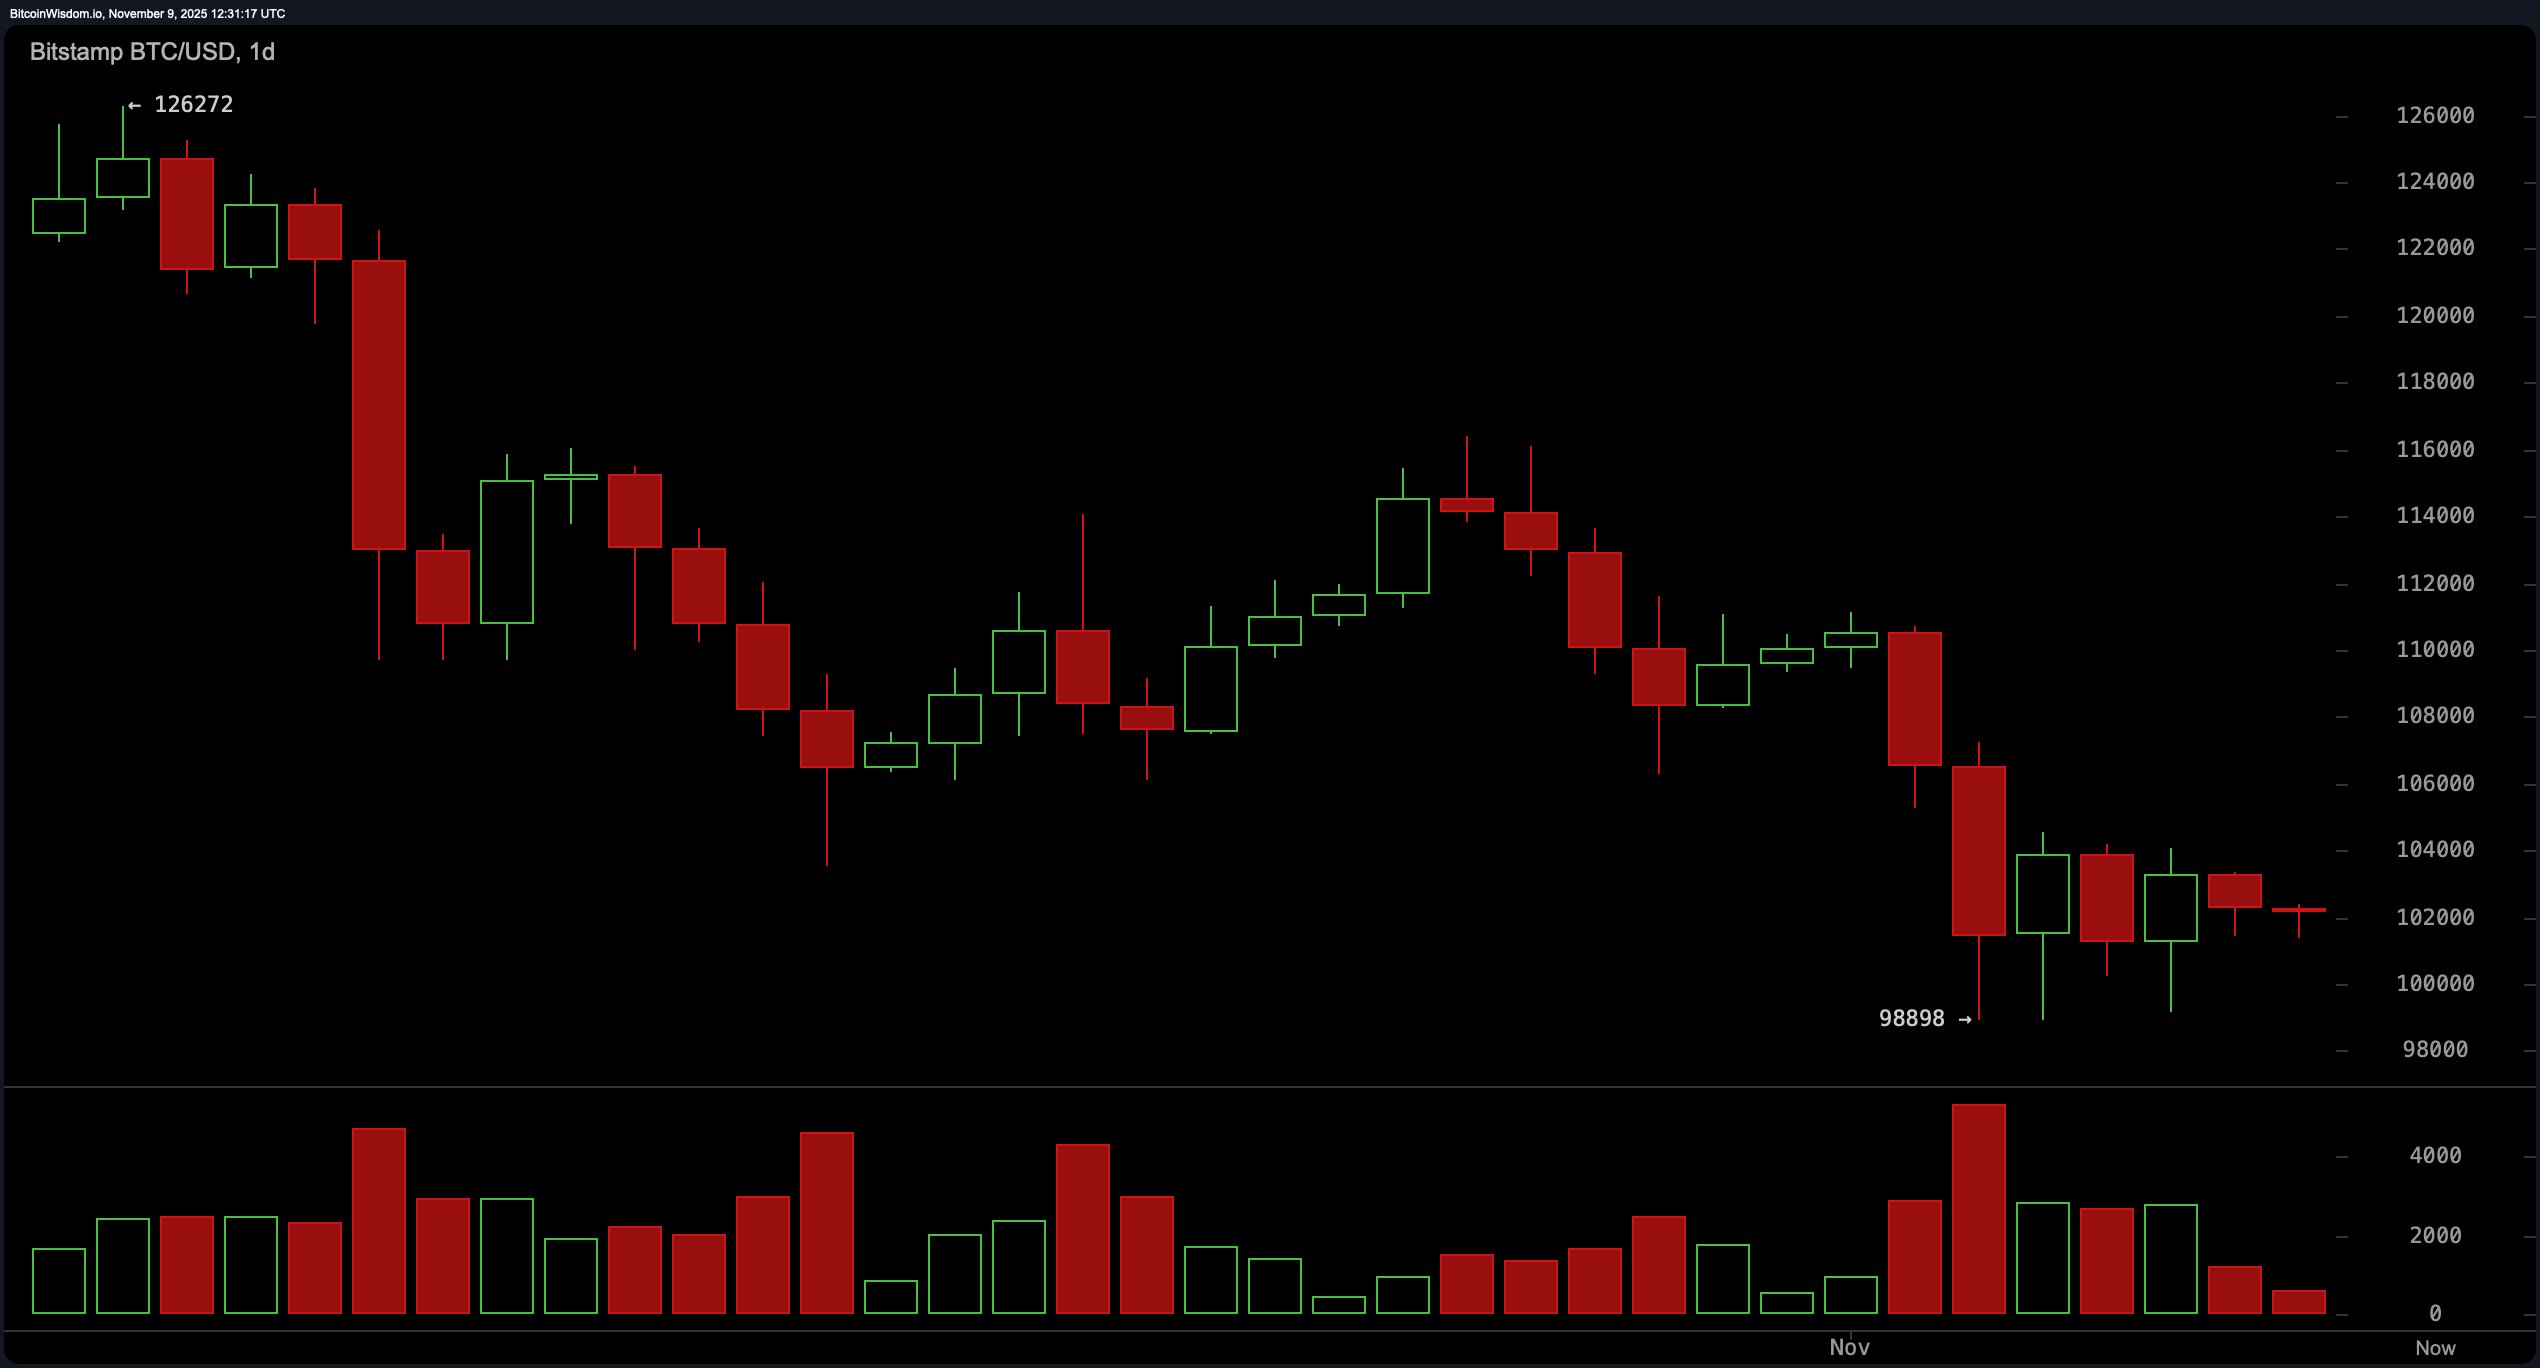
Starting from the macro view, the 1-day chart paints a grim picture for the bulls. After free-falling from the $126,000 level to a low of $98,898, bitcoin broke through major support with the grace of a rock dropped from a rooftop. Although the current price action suggests a bit of consolidation between $101,000 and $104,000, calling it a comeback would be premature.
Elevated volume on red candles hints at panic-driven liquidations, not confident accumulation. The resistance sits tightly at $104,000–$106,000, while support down at $98,898 looms like a trapdoor. A pop above $106,000 might raise eyebrows, but a drop under $98,000 would slam the door on optimism.

BTC/USD 1-day chart via Bitstamp on Nov. 9, 2025.
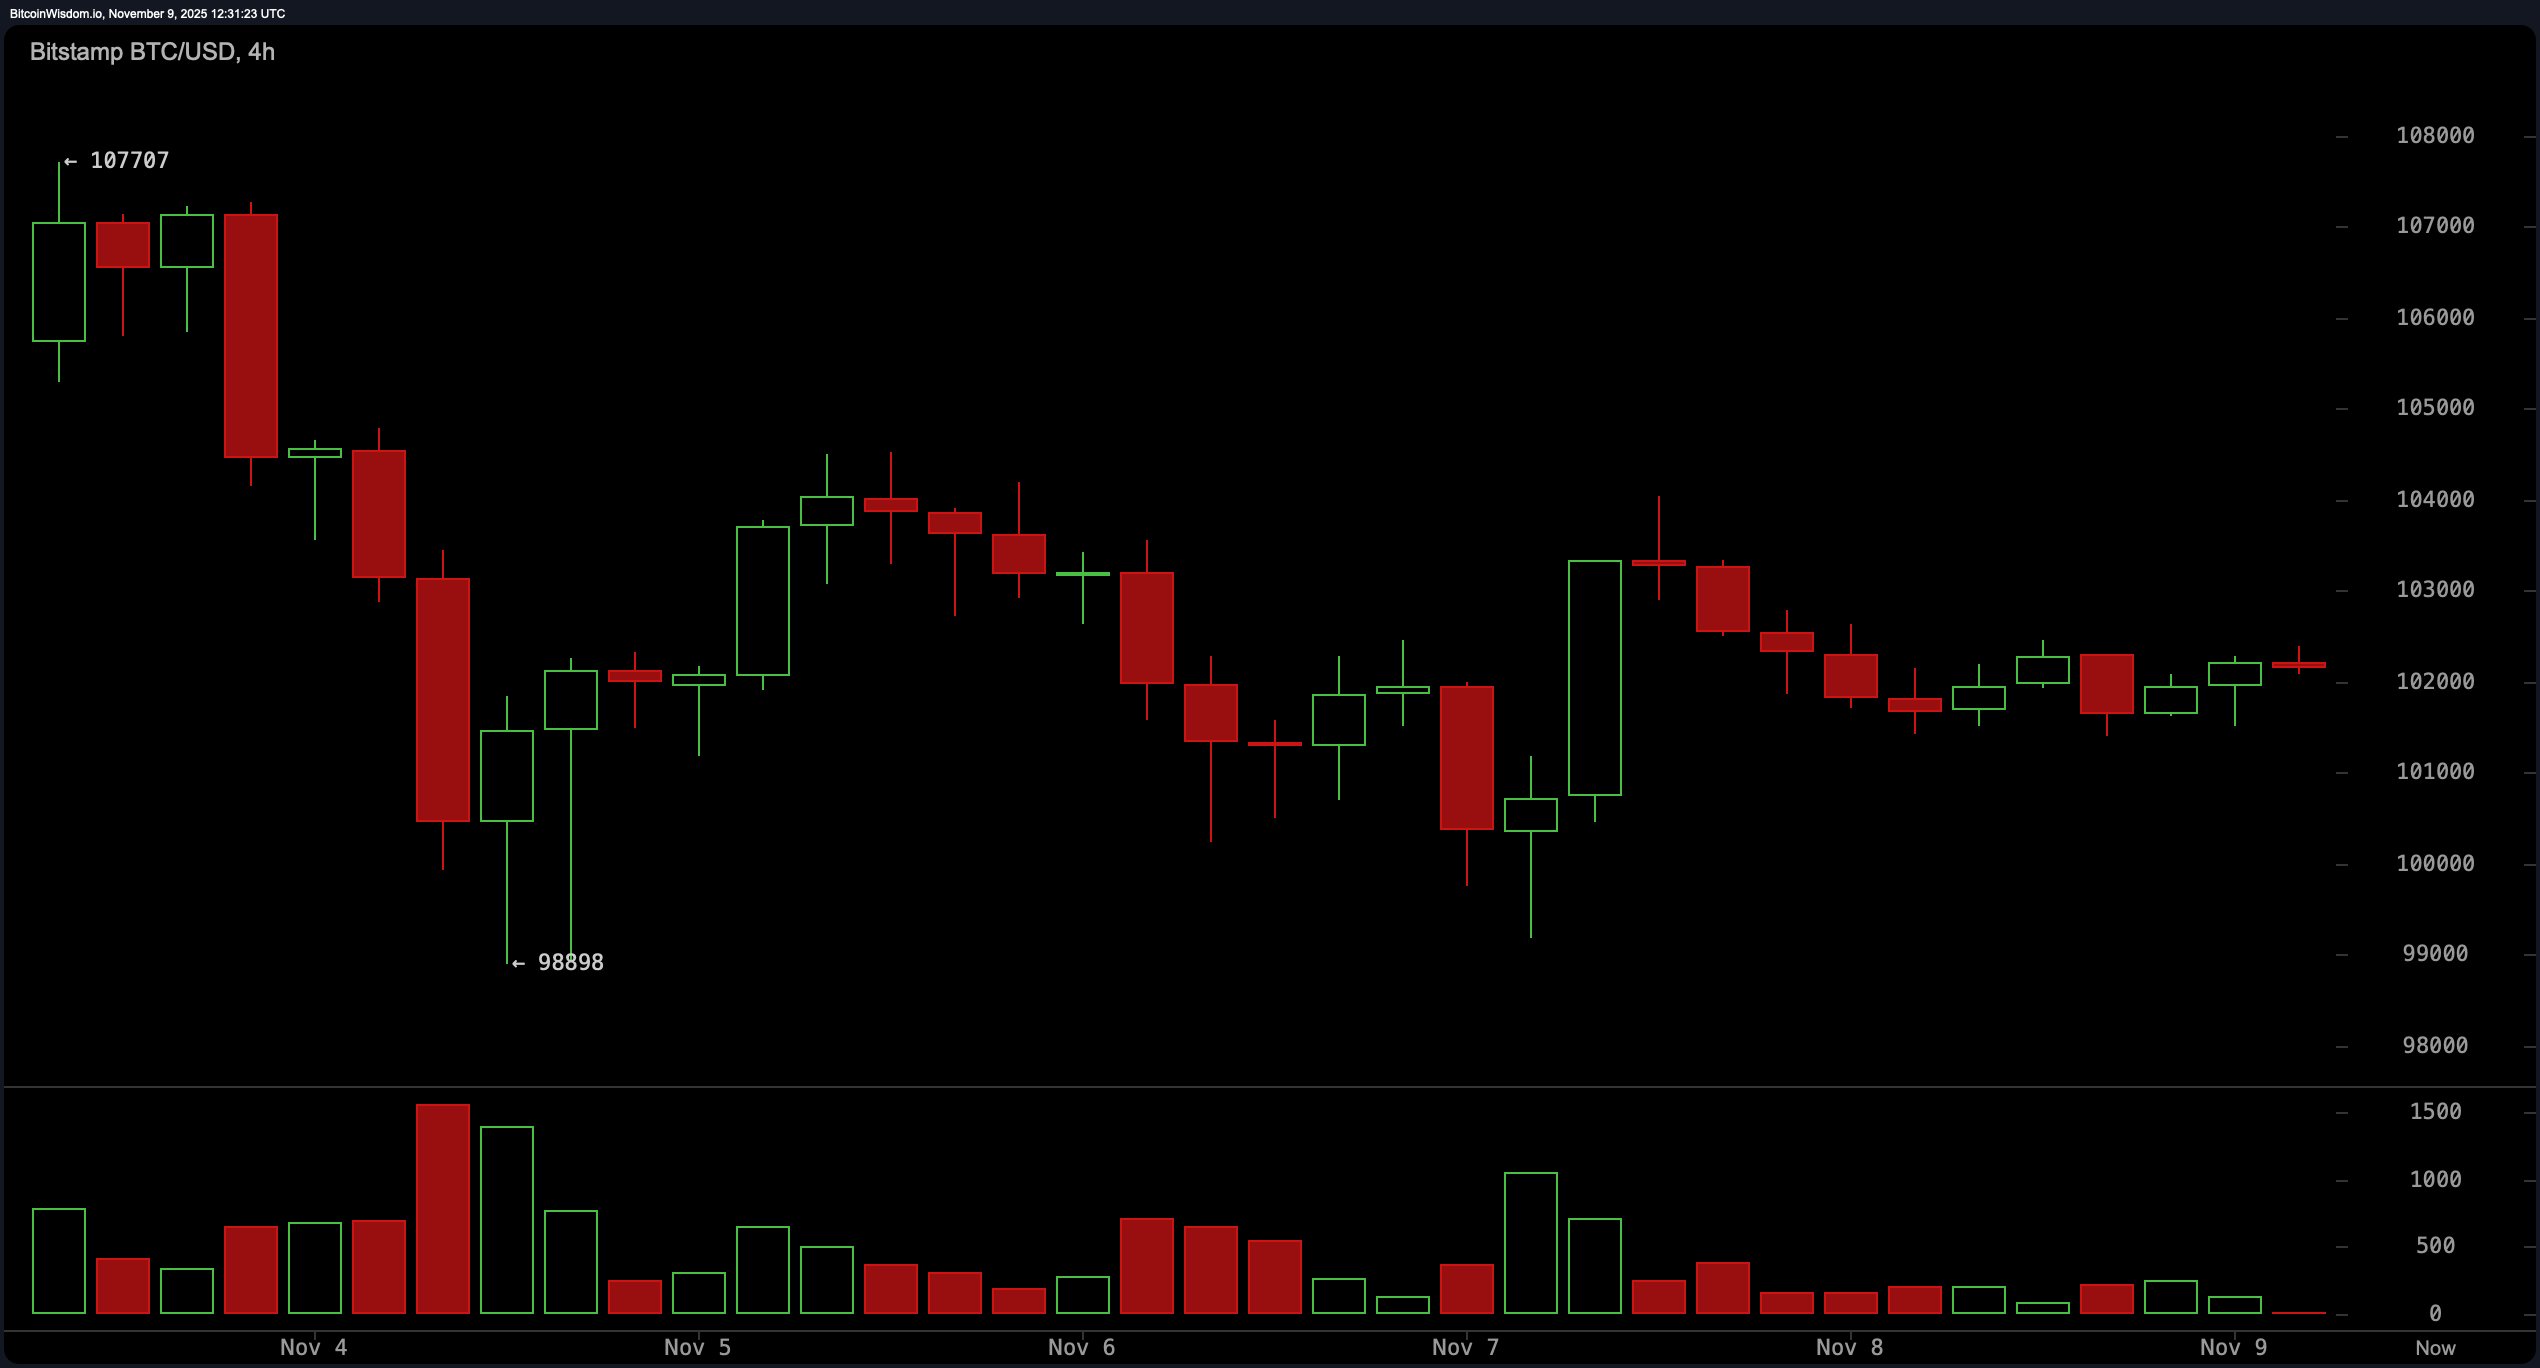
Zooming into the 4-hour chart, things aren’t looking much cheerier. The modest recovery following the drop has lost steam, with lower highs forming like a sad staircase going nowhere. The declining volume on upward price moves tells the tale—buyers are tapping out early. Resistance between $103,000 and $104,000 is acting like a bouncer at an exclusive club, and support around $101,000 is thin at best. The market is coasting in neutral, and unless something sparks momentum, bitcoin risks drifting into another leg downward.

BTC/USD 4-hour chart via Bitstamp on Nov. 9, 2025.
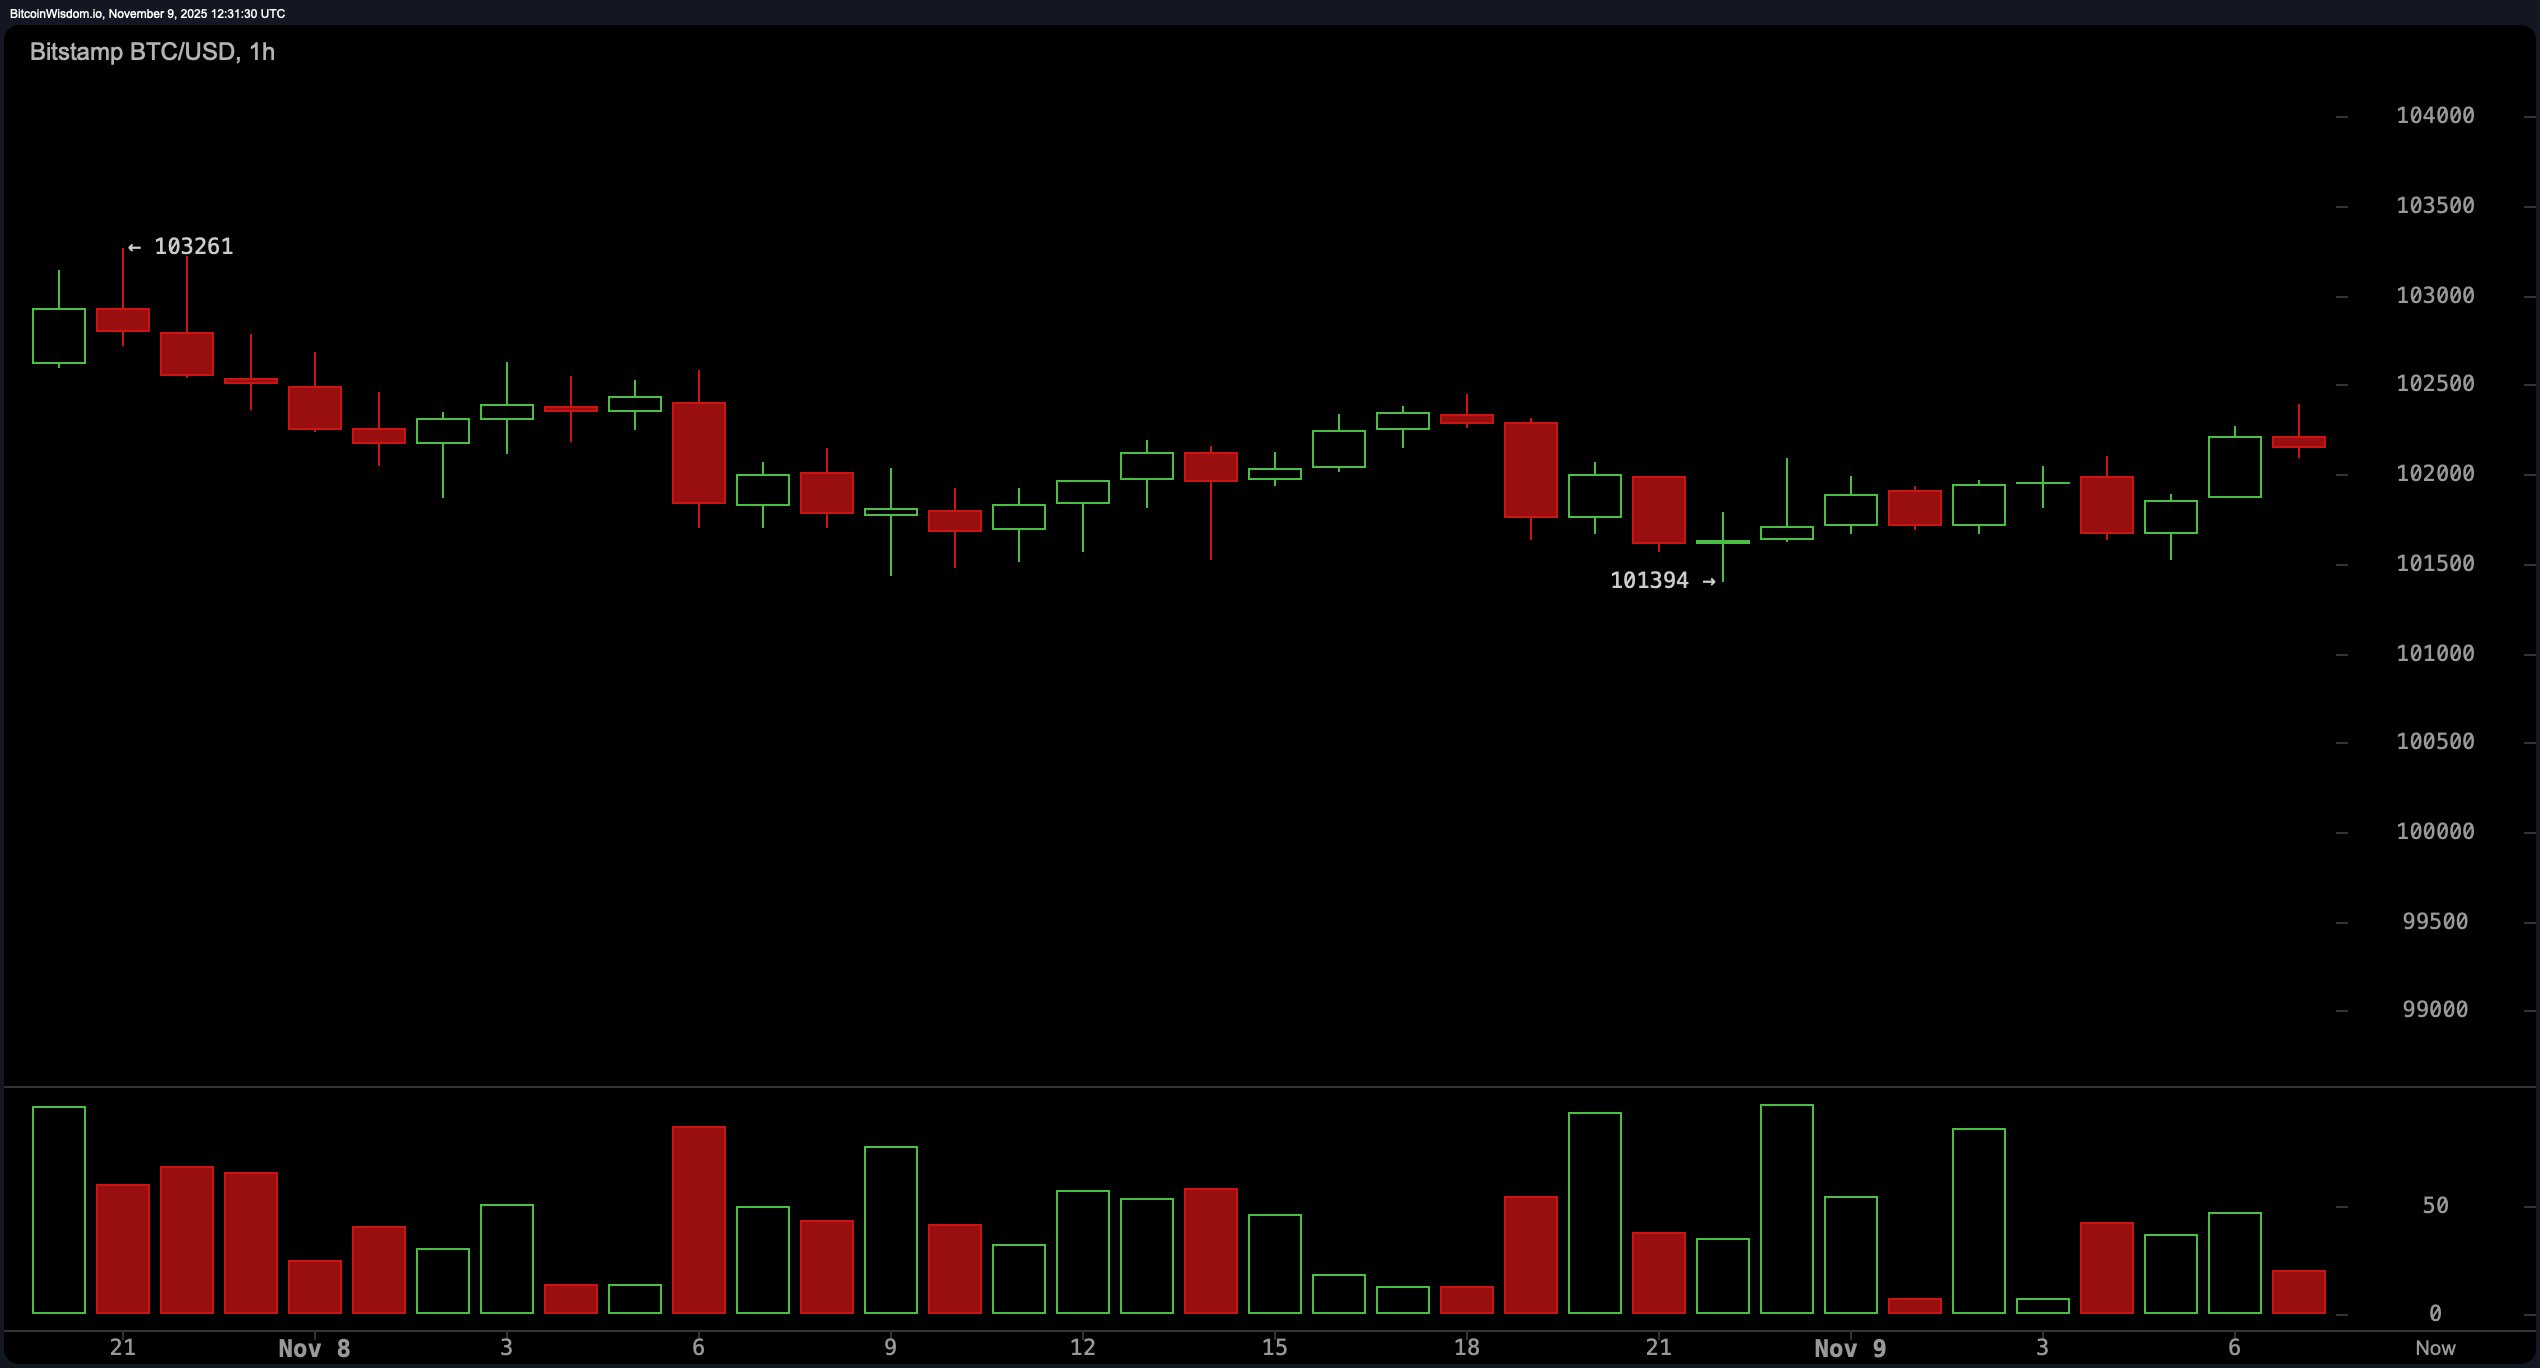
Now, let’s get microscopic. On the 1-hour chart, bitcoin is doing the sideways shuffle—trading in a tight range of $101,400 to $102,500 with about as much excitement as a Sunday afternoon nap. Volume is ghost-level light, signaling traders are too cautious to commit. There’s a faint upward bias, but not enough to count as real momentum. The short-term setup suggests scalpers might have a field day—if they’re brave enough to play these tight bands—but for everyone else, it’s a waiting game.

BTC/USD 1-hour chart via Bitstamp on Nov. 9, 2025.
On the technical indicators front, the picture remains mixed with a bearish tinge. The relative strength index (RSI) is neutral at 37, and the stochastic oscillator isn’t adding much heat at 21. The commodity channel index (CCI) and momentum indicators signal possible entry opportunities, but the moving average convergence divergence (MACD) level sits grimly at -2,828. That’s not confidence—it’s concern. Adding to that, every single moving average from the exponential moving average (EMA) and simple moving average (SMA) lines—from 10-period to 200-period—points one way: down. That’s not a pattern; that’s a trend, and it’s not flattering.
In sum, bitcoin is treading water after a hefty plunge, and while short bursts of optimism flash across the lower time frames, the broader trend says this isn’t the end of the storm. With every major moving average in decline and oscillators offering mixed signals, the market is caught in a precarious dance between exhaustion and indecision. This isn’t the bullish breakout some might be dreaming of—it’s the hangover after the party, and the aspirin hasn’t kicked in yet.
Bull Verdict:
If bitcoin can push past the $106,000 resistance with convincing volume, it could mark the early signs of a recovery phase. Momentum might return, dragging the price toward the $110,000–$112,000 zone, especially if broader sentiment or macro catalysts align in its favor. But it needs a strong catalyst—otherwise, this upside potential is just smoke without fire.
Bear Verdict:
The weight of consistent lower highs, a slew of bearish moving averages, and lackluster volume tips the scales toward further downside. If bitcoin breaks below the $98,000 threshold, expect renewed selling pressure and another leg down. Right now, the bears have the edge, and the bulls are running on fumes.
- Where is bitcoin’s key support level today?
Bitcoin’s critical support level sits at $98,898, with further downside risk if breached. - What is the current bitcoin resistance zone?
Resistance is holding firm between $104,000 and $106,000 on higher time frames. - What trend does the bitcoin chart show right now?
The trend remains bearish with lower highs and declining volume across all major timeframes. - Are technical indicators suggesting a reversal?
No clear reversal signals yet, as most moving averages and the MACD remain firmly bearish.
免责声明:本文章仅代表作者个人观点,不代表本平台的立场和观点。本文章仅供信息分享,不构成对任何人的任何投资建议。用户与作者之间的任何争议,与本平台无关。如网页中刊载的文章或图片涉及侵权,请提供相关的权利证明和身份证明发送邮件到support@aicoin.com,本平台相关工作人员将会进行核查。


