The U.S. federal government is about to enter its fortieth day of shutdown since October 1 due to budget disputes, setting a record for the longest shutdown in history. However, Trump stated in an earlier interview that the federal government shutdown is about to end as the Senate has reached a temporary funding agreement.
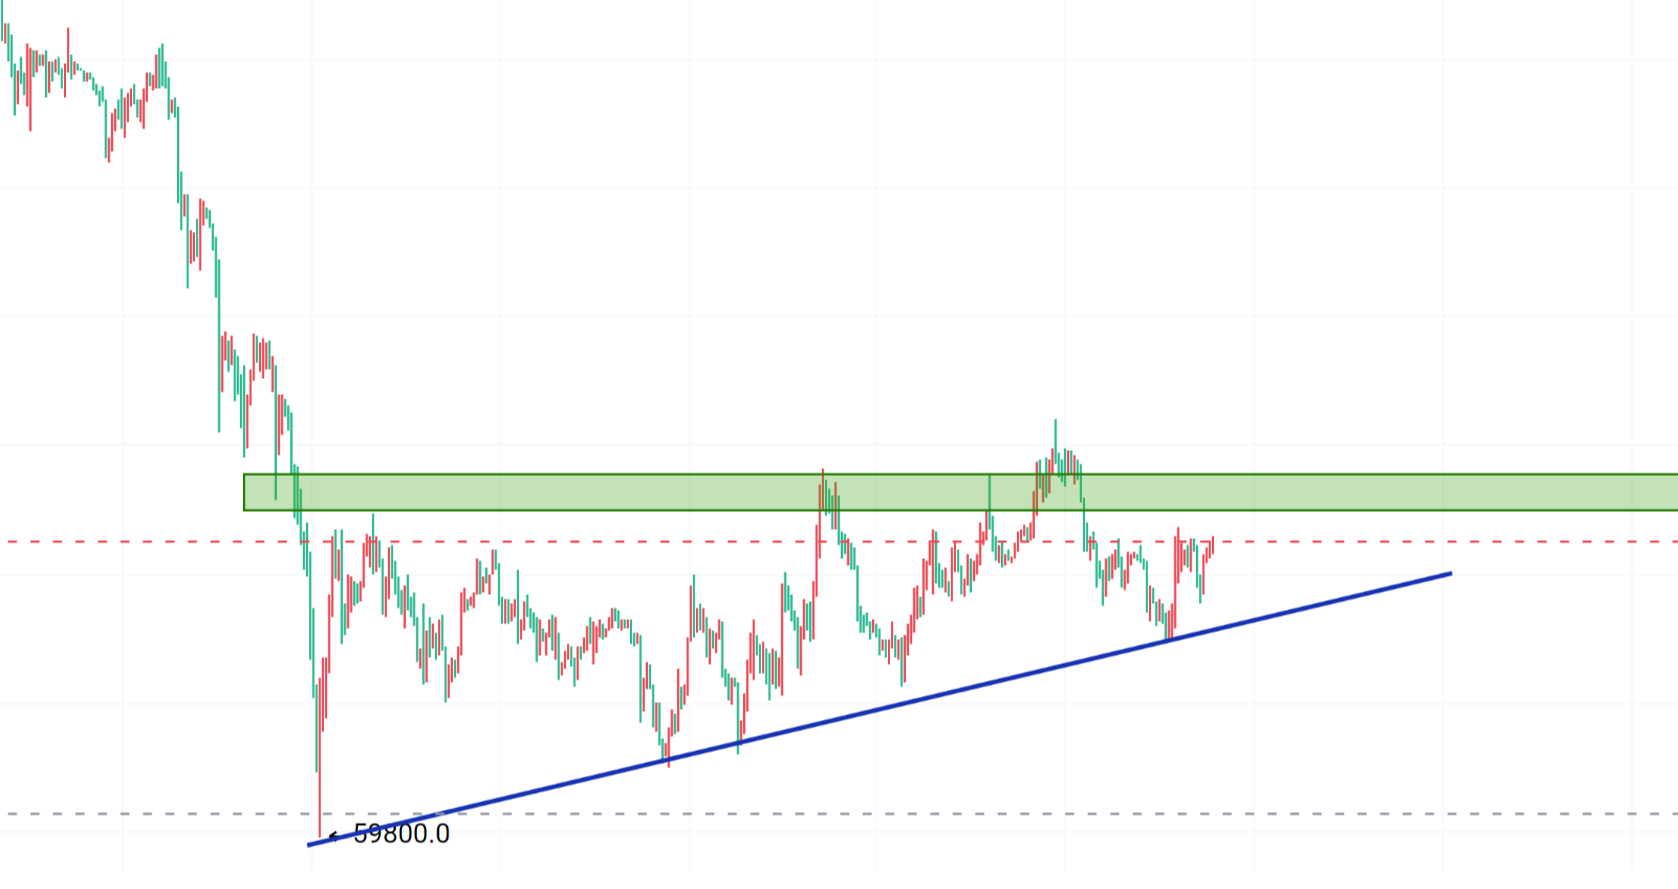
The probability of the U.S. government ending the shutdown this week is over 90%. Encouraged by this, Bitcoin surged this morning, briefly breaking through $106,000, reaching a high of $106,666. As of the time of writing, the price is quoted at $105,870, with an increase of approximately 3.74% in the last 24 hours.
Bitcoin Four-Hour Chart
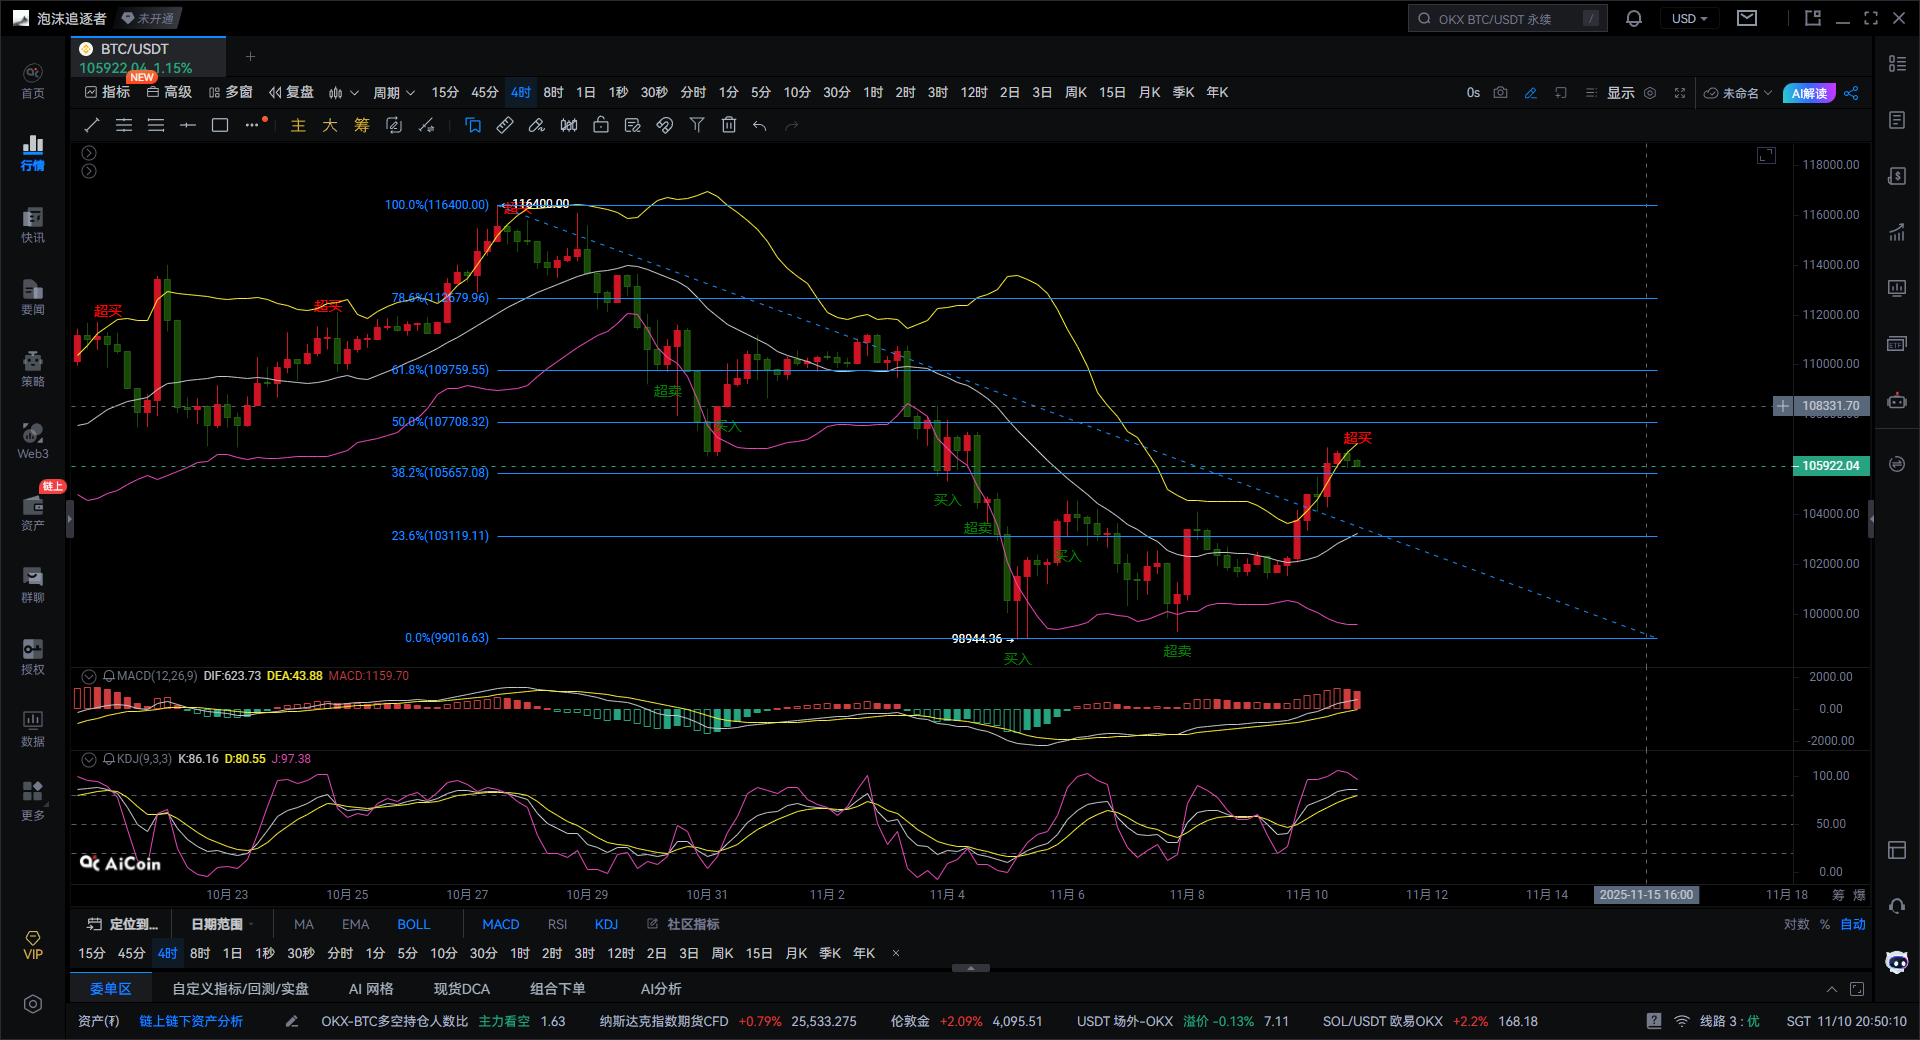
In terms of overall trend, Bitcoin entered a downward channel after forming a phase high near $116,400, with the price dropping to $99,844 before stabilizing and rebounding. The current price is around $105,922, close to the Fibonacci retracement range of 38.2% to 50%, approximately $105,657-$107,708. This range is crucial for short-term strength; a breakout may open up upward space, otherwise, there is a risk of a second drop.
The Bollinger Bands indicator shows that the lower band has been touched multiple times at $99,000, indicating effective support. The middle band is at $104,000, and the price has risen above the middle band, suggesting a short-term bullish recovery phase. The upper band resistance is at $108,300, coinciding with the 50% Fibonacci level, forming strong pressure. If the price breaks through the upper band and expands the bandwidth, it may initiate a new upward cycle; otherwise, it may oscillate between the middle and upper bands.
Regarding the MACD indicator, the DIF line has crossed above the DEA line, forming a golden cross, and the MACD histogram has turned from green to red and is expanding, indicating enhanced bullish momentum. However, the MACD is still below the zero line, suggesting that the current rise is a rebound rather than a reversal. If the subsequent red histogram continues to expand and crosses above the zero line, it can confirm a mid-term reversal target towards the $108,000-$110,000 range; if the red histogram shortens or a death cross appears, a pullback to test support may occur.
The KDJ indicator currently shows a K value of about 86, a D value of about 80, and a J value close to 97, indicating an overbought zone, which means there is short-term pullback pressure. If the KDJ indicator turns downward or forms a death cross, it may trigger profit-taking; however, if the indicator consolidates at a high level, it suggests that rebound momentum still exists.
The Fibonacci retracement levels show important positions at 23.6% at $103,119, 38.2% at $105,657, 50% at $107,708, 61.8% at $109,759, and 78.6% at $112,679. The current price is oscillating in the 38.2%-50% range; if it can effectively break through 50% and stabilize, it may further test $109,750 to $112,790; if it faces pressure and falls back, it may retest support at $103,000 or $99,000.
In summary, Bitcoin is in a rebound phase in the short term, with the MACD golden cross and the Bollinger middle band forming favorable conditions, but the KDJ overbought condition brings oscillation risks. If the price breaks through the $107,708-$109,759 range in the medium term, it may establish a reversal, targeting $112,000-$114,000. Initial support is at $103,000, with strong support at $99,000; the upper pressure range is $108,000-$110,000. Overall, Bitcoin has entered a rebound recovery after a sharp decline, with bullish momentum rising but the mid-term trend not fully reversing. Breaking through the key resistances of the Fibonacci 50% and the Bollinger upper band is expected to turn into oscillating upward movement; otherwise, high pressure and overbought conditions may lead to adjustments or bottom testing. In the short term, it is recommended to sell high and buy low while controlling positions, waiting for a volume breakout to confirm the trend.
Based on the above, the following suggestions are provided for reference:
Short-term long positions can gradually reduce or take profits in the $105,000-$107,000 range. If the price retraces to around the middle band at $104,000 and the MACD does not form a death cross, consider adding or replenishing positions. If it breaks below $103,000, be cautious of a second bottom test at $99,000.

Giving you a 100% accurate suggestion is not as good as providing you with the correct mindset and trend; teaching someone to fish is better than giving them fish. It is suggested to earn for a moment, but learning the mindset will allow you to earn for a lifetime!
Writing time: (2025-11-10, 20:50)
(Written by - Master Coin) Disclaimer: Online publication has delays, and the above suggestions are for reference only. Investment carries risks; proceed with caution!
免责声明:本文章仅代表作者个人观点,不代表本平台的立场和观点。本文章仅供信息分享,不构成对任何人的任何投资建议。用户与作者之间的任何争议,与本平台无关。如网页中刊载的文章或图片涉及侵权,请提供相关的权利证明和身份证明发送邮件到support@aicoin.com,本平台相关工作人员将会进行核查。