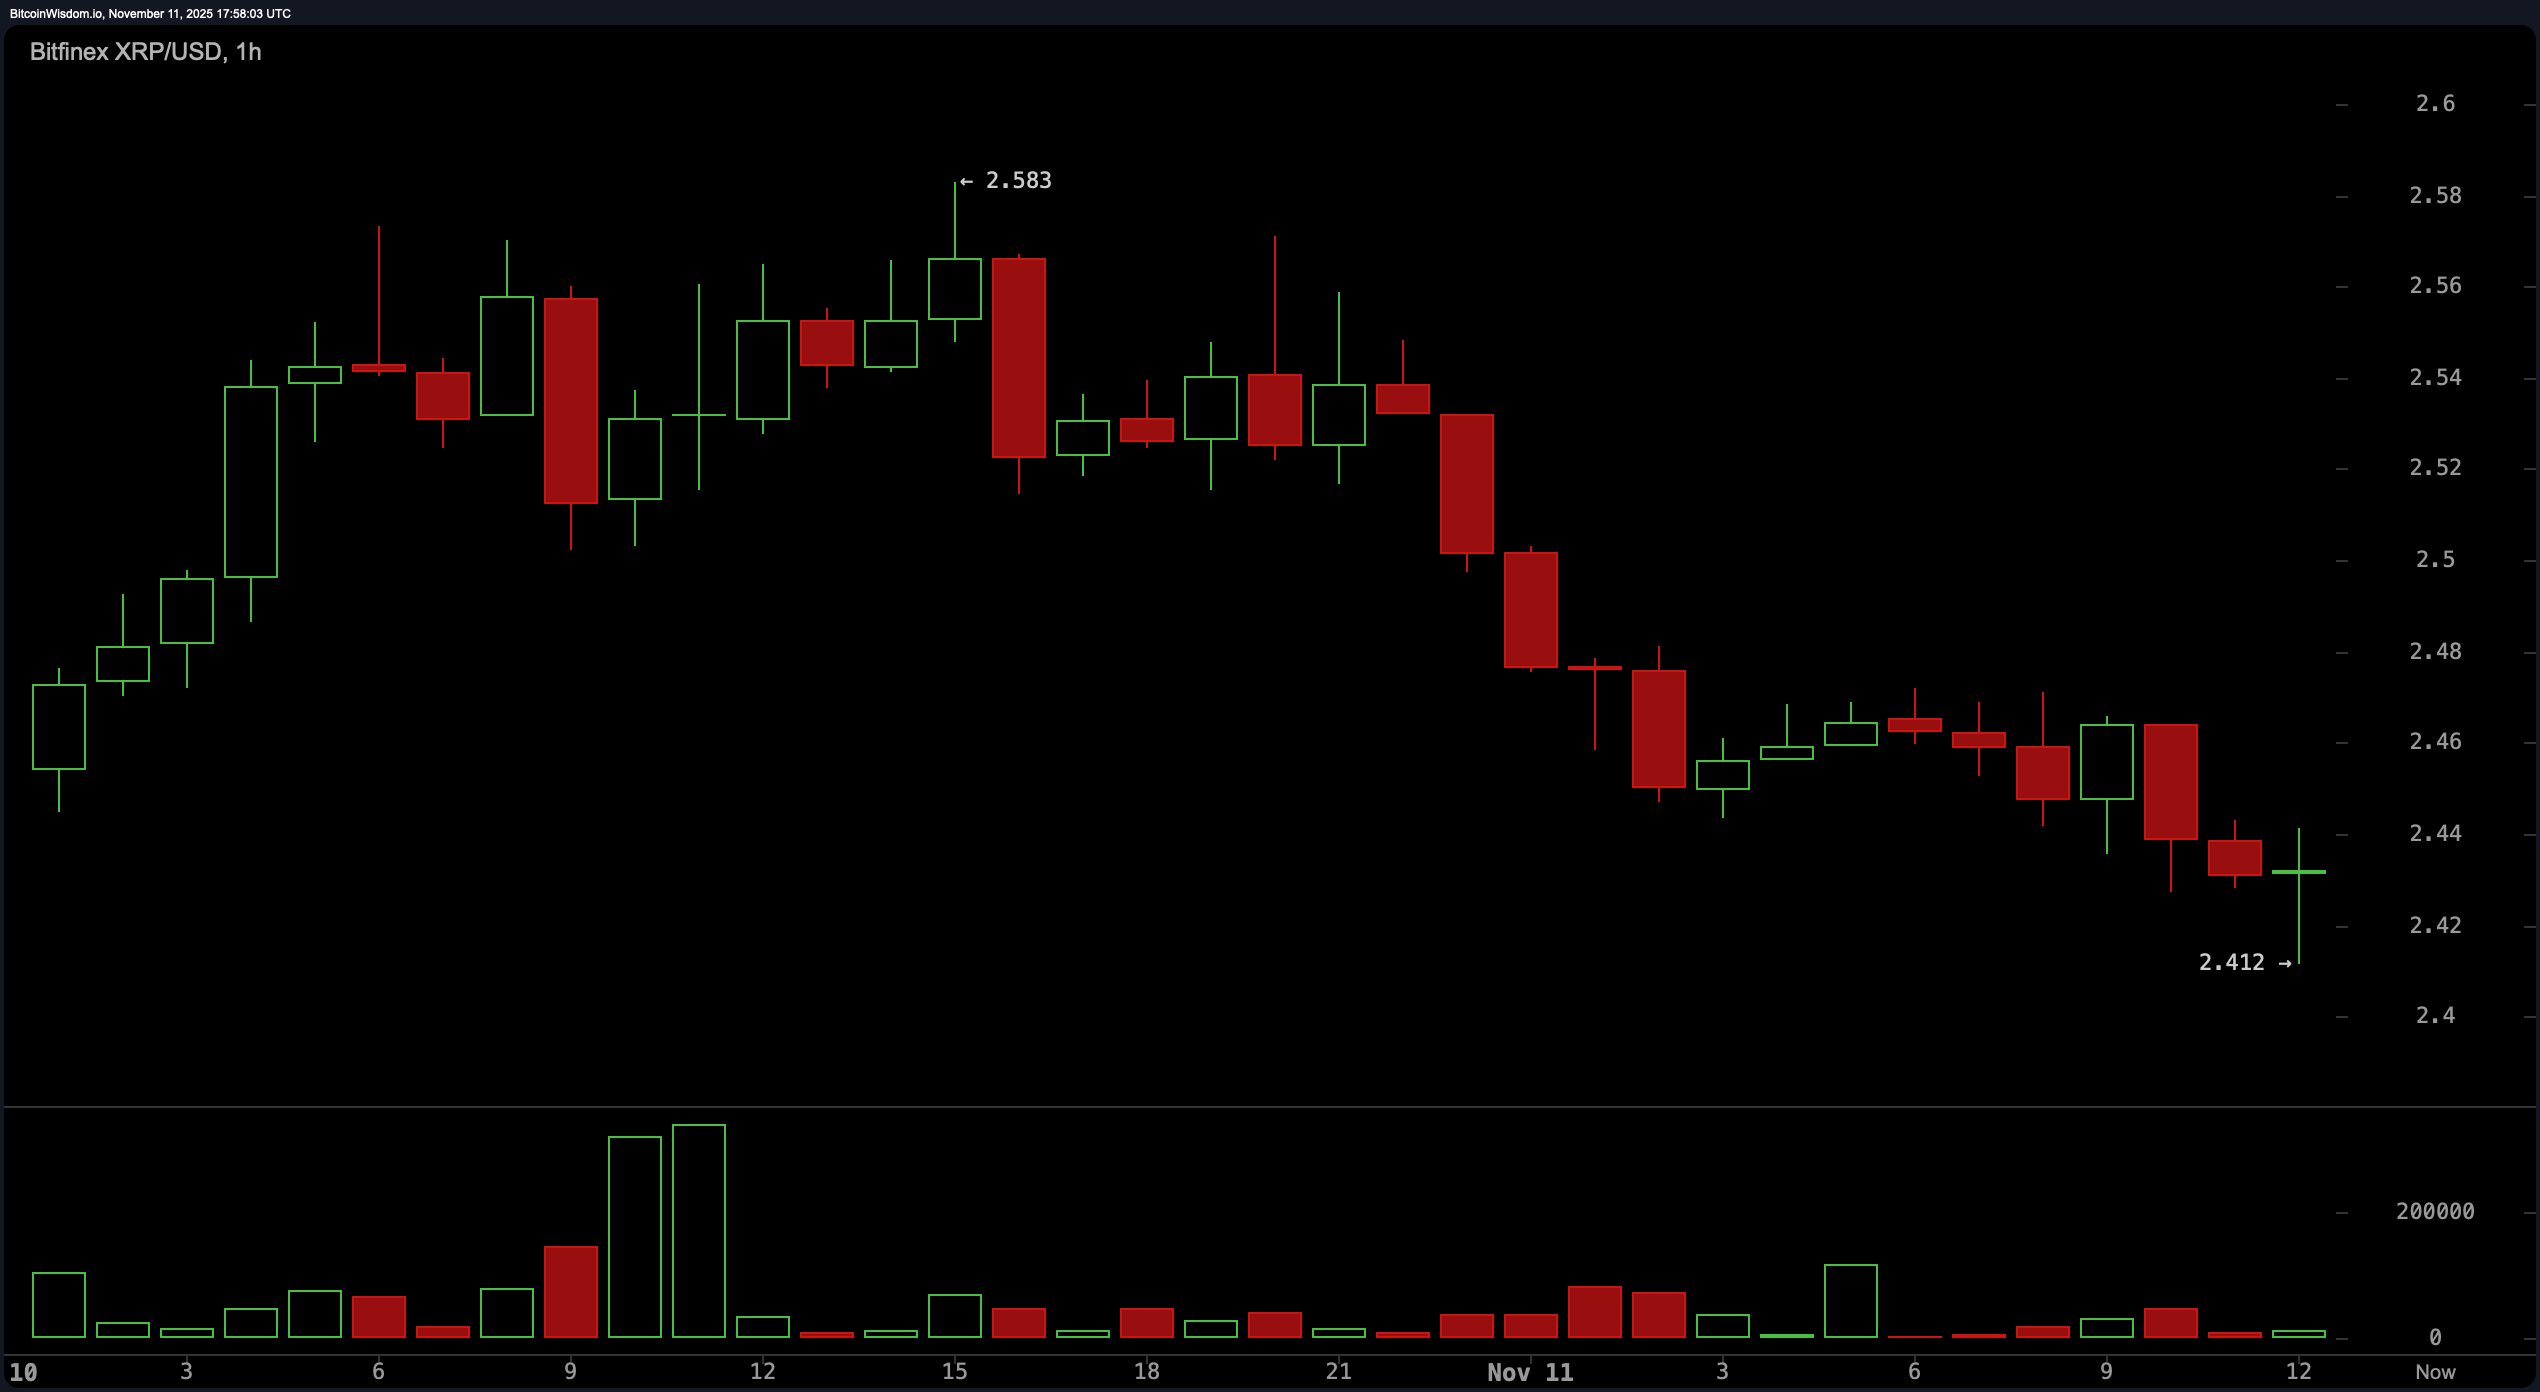
The 1-hour chart signals XRP is experiencing a mild bearish drift after failing to sustain its hold above $2.58. Short-term resistance has coalesced around the $2.50–$2.55 zone, while support remains thin at $2.40–$2.42.
The structure reveals a sequence of lower highs and a tentative bounce at $2.412, hinting at early-stage accumulation—though sellers are clearly still calling the shots. A brief surge in volume above $2.42–$2.44 could revive scalping opportunities, but a breach below $2.40 would likely crack the structure and reignite short-term downside pressure.

XRP/USD 1-hour chart via Bitfinex on Nov. 11, 2025.
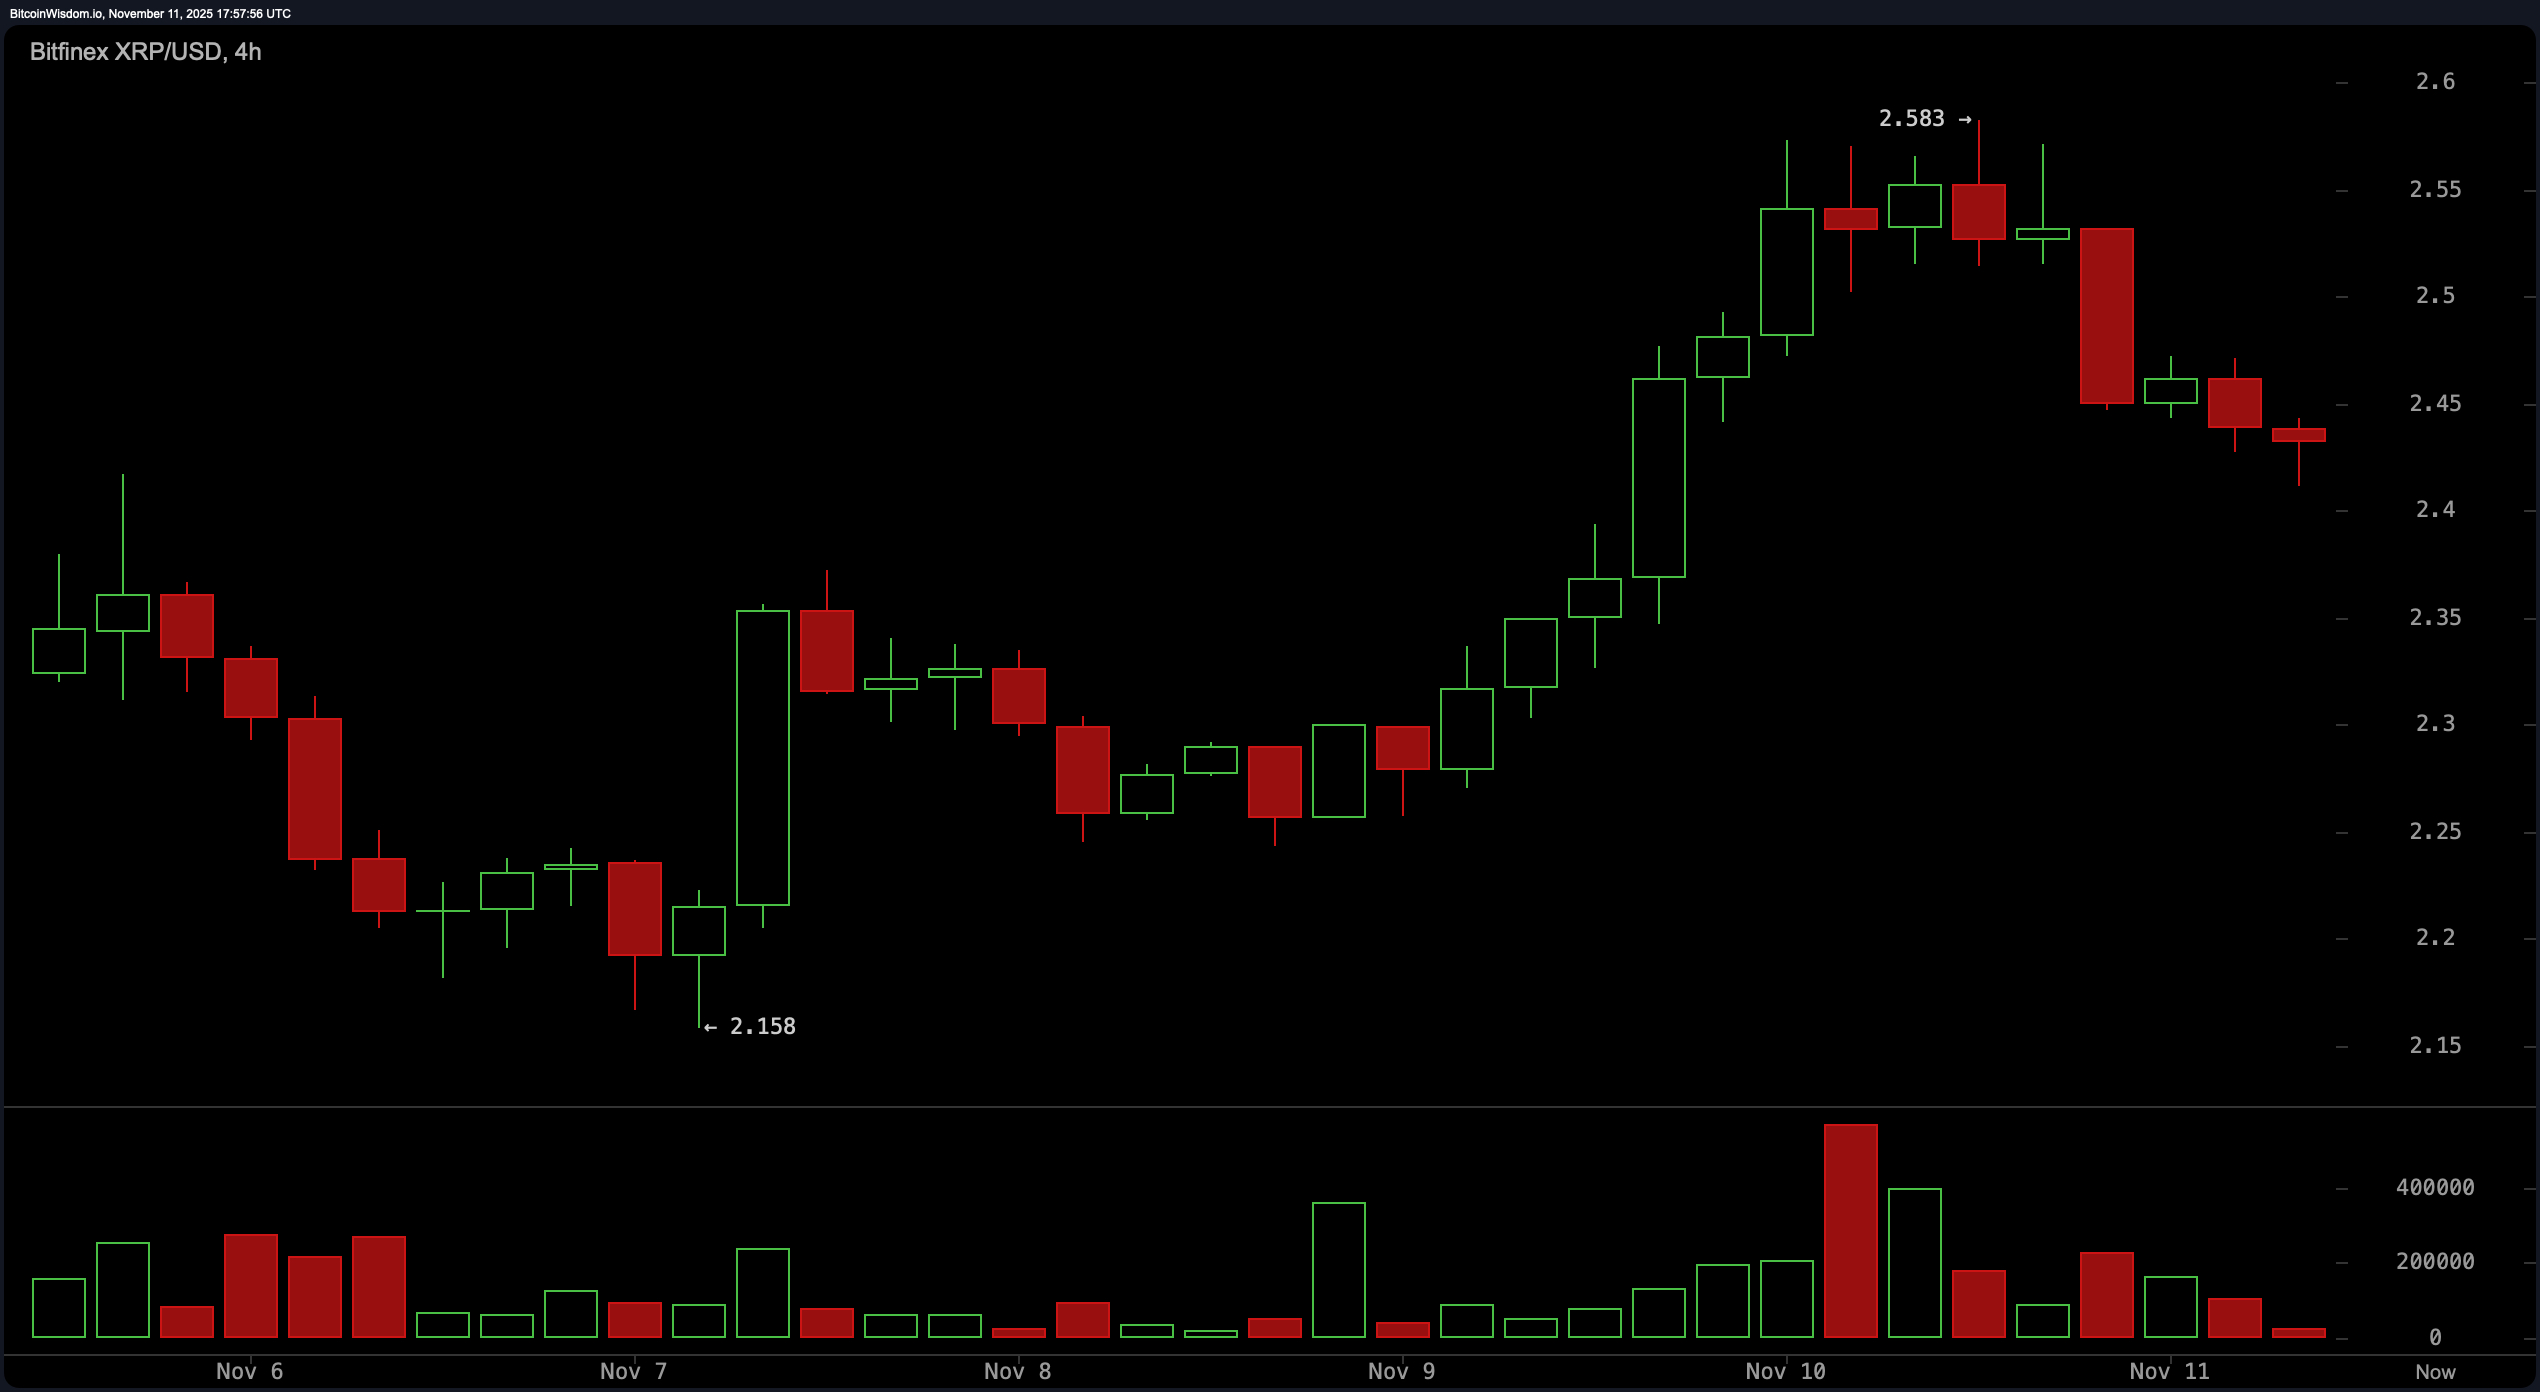
Zooming out to the 4-hour chart, XRP staged a bullish breakout from $2.16 to $2.58 but has since seen momentum dry up. Lower highs and dwindling bullish candle bodies reflect a weakening push by buyers. While the breakout was confirmed by a spike in volume, the lack of follow-through underscores exhaustion. A retest near $2.35–$2.40 could act as a litmus test for strength—if the asset can hold that ground without dipping below $2.30, consolidation might reset for another leg upward. But a fall under $2.30 likely opens the door for a move back toward $2.15.

XRP/USD 4-hour chart via Bitfinex on Nov. 11, 2025.
The daily chart is a lesson in tactical patience. XRP has carved out a double-bottom pattern near $2.10 and bounced with conviction toward the $2.55–$2.60 resistance zone. However, recent candles are showing hesitation, as volume cools and the market looks for direction. Support remains strong around $2.25–$2.30, and unless that floor cracks, a base-building phase could continue. A decisive move above $2.60 would be required to break the current standoff and possibly lift the target toward $2.80.

XRP/USD daily chart via Bitfinex on Nov. 11, 2025.
On the oscillator front, the data is the portrait of neutrality with a dash of passive-aggressive indecision. The relative strength index (RSI) stands at 48.68, the Stochastic at 60.65, and the commodity channel index (CCI) at 15.81—each screaming neutrality from the rooftops. The average directional index (ADX) at 36.57 confirms the lack of a dominant trend. The Awesome oscillator (-0.07625) mirrors the same unbothered stance. Momentum, clocking in at -0.07431, is the only indicator leaning negative, while the moving average convergence divergence (MACD), via the daily, at -0.05718 bucks the trend with a rare signal of upward interest.
As for moving averages, it’s a power struggle between short-term optimism and long-term skepticism. The exponential moving average (EMA) for 10 and 20 periods are sitting at $2.39 and $2.42, respectively, aligned with the simple moving average (SMA) 10 at $2.35—each suggesting upward interest. But beyond the 30-period mark, the tide turns: both EMA and SMA (30, 50, 100, and 200) paint a dimmer picture, flagging a bearish undertow. The 200-period SMA and EMA at $2.63 and $2.58, respectively, are particularly telling— XRP still has ground to cover if it wants to convince the long-range models it means business.
Bottom line: XRP is juggling its bullish ambitions with bearish undertones. Until the price cracks out of its $2.35–$2.55 no-man’s land, this is a technical tug-of-war without a clear winner. The wick’s still sizzling, but it might sputter and quit like a diva with no spotlight.
Bull Verdict:
If XRP holds the $2.35 support and volume revives above $2.55, the groundwork is in place for a renewed push toward $2.80. Short-term moving averages are aligned with upward momentum, and the MACD (Moving Average Convergence Divergence) still whispers in favor of strength. A clean break above $2.60 would likely signal the bulls aren’t done yet—they’re just catching their breath.
Bear Verdict:
With fading volume, bearish signals from long-term moving averages, and key support levels under pressure, XRP’s momentum is skating on thin ice. A decisive break below $2.30 could trigger a sharp retracement toward $2.10 or lower. Unless bulls reclaim $2.55 with conviction, the bears are quietly tightening their grip.
- What is XRP’s current price?
XRP is trading at $2.42 as of Nov. 11, 2025. - How much has XRP moved today?
XRP is down 5% today but up 8% over the past week. - Where is XRP support and resistance right now?
Key support sits at $2.30–$2.35, with resistance at $2.55–$2.60. - Is XRP trending bullish or bearish?
XRP shows mixed signals with short-term strength but long-term weakness.
免责声明:本文章仅代表作者个人观点,不代表本平台的立场和观点。本文章仅供信息分享,不构成对任何人的任何投资建议。用户与作者之间的任何争议,与本平台无关。如网页中刊载的文章或图片涉及侵权,请提供相关的权利证明和身份证明发送邮件到support@aicoin.com,本平台相关工作人员将会进行核查。


