Bitcoin broke through the $104,000 mark in the morning, and as of now, it is around $105,000, with a 24-hour decline of 0.93%. The highest in 24 hours was $105,500, and the lowest was $102,400. Previously, bulls attempted to break through the lower edge of the multi-week consolidation range at $107,250 but failed to hold. The short-term market is cautious, with intense long and short battles.
From a technical indicator perspective, the 50-day simple moving average shows signs of a "death cross" with the 200-day simple moving average, indicating a weakening short-term trend. The 4-hour K-line experienced a significant drop, and although there was a slight rebound, trading volume decreased, indicating low market activity; the KDJ value shows oversold conditions, and the MACD histogram remains negative but is gradually shortening, suggesting that bullish strength is slowly increasing.
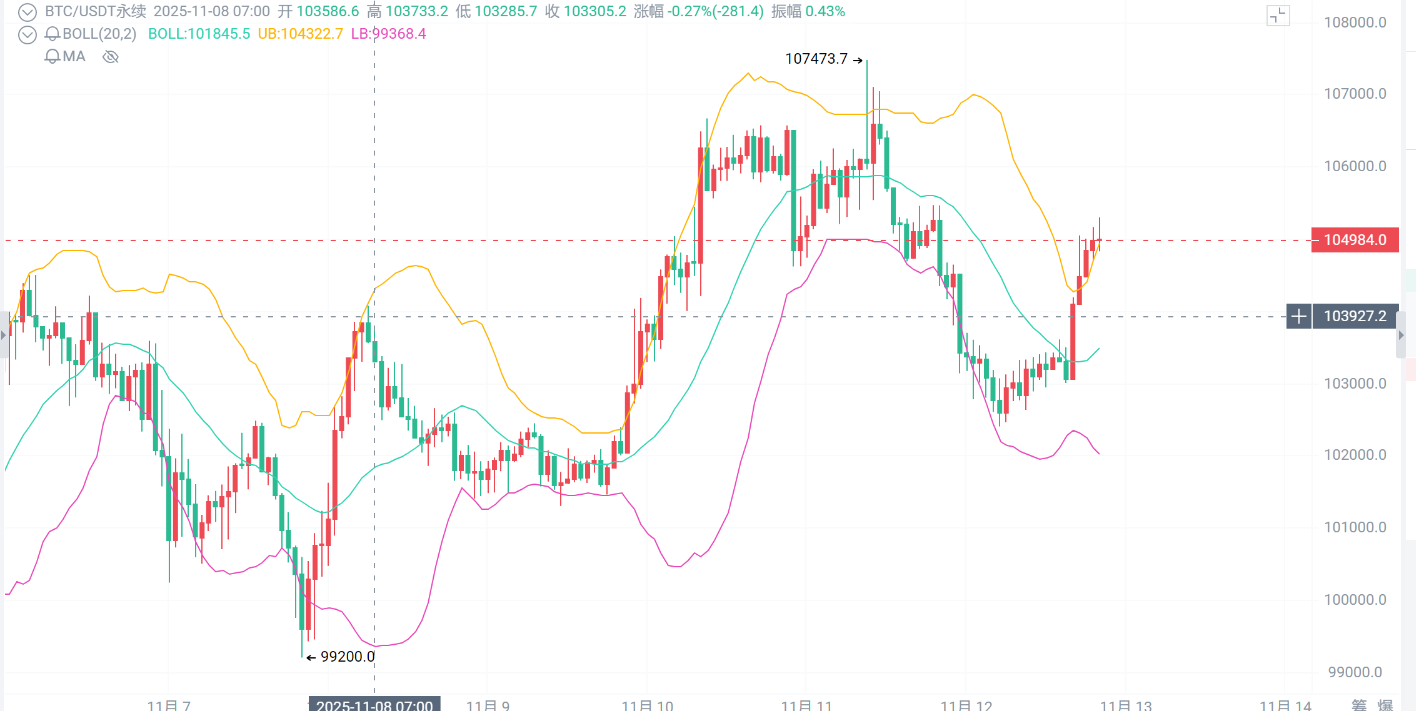
Suggested trading range: When the price rebounds to the resistance range of $106,500 - $107,000, consider taking a small short position, targeting around $103,000. If it breaks below, further targets can be set around $102,000.
Ethereum was around $3,550 before the publication of this report. It faced resistance near $3,592 previously and has accumulated a decline of over 4% this week, operating in a low range overall. Some data shows that the price dropped as low as $3,121.80 on the same day, with significant short-term price fluctuations.
From a technical indicator perspective, the daily level closed with a large bearish candle yesterday, forming a "single bearish candle after consecutive bullish candles" correction pattern. The MACD double lines have crossed negatively, and the green momentum bars are expanding, indicating a clear bearish trend. The 4-hour chart's moving average system is in a bearish arrangement, near the horizontal support point of an ascending triangle. The MACD has ended its expansion and formed a death cross, and after losing the $3,510 level in the Bollinger Bands, it has turned into a resistance level. The short-term is entering oversold territory, while both the mid-term and long-term show bearish momentum.
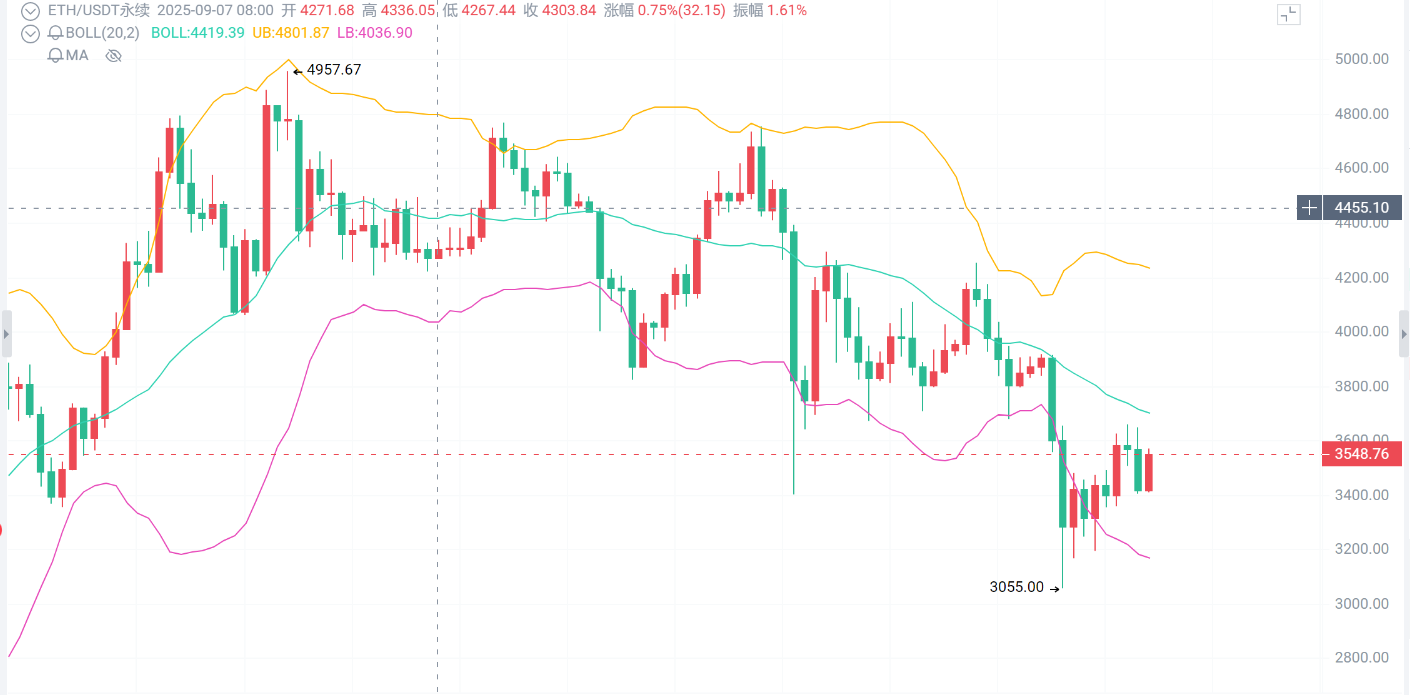
Suggested trading range: When the price rises to the $3,580 - $3,610 range, consider placing short positions with a stop loss of 50 points, targeting $3,400 - $3,450. If it breaks below the $3,460 support level, further targets can be set towards $3,300 - $3,350, and in extreme cases, pay attention to support around $3,340.
免责声明:本文章仅代表作者个人观点,不代表本平台的立场和观点。本文章仅供信息分享,不构成对任何人的任何投资建议。用户与作者之间的任何争议,与本平台无关。如网页中刊载的文章或图片涉及侵权,请提供相关的权利证明和身份证明发送邮件到support@aicoin.com,本平台相关工作人员将会进行核查。