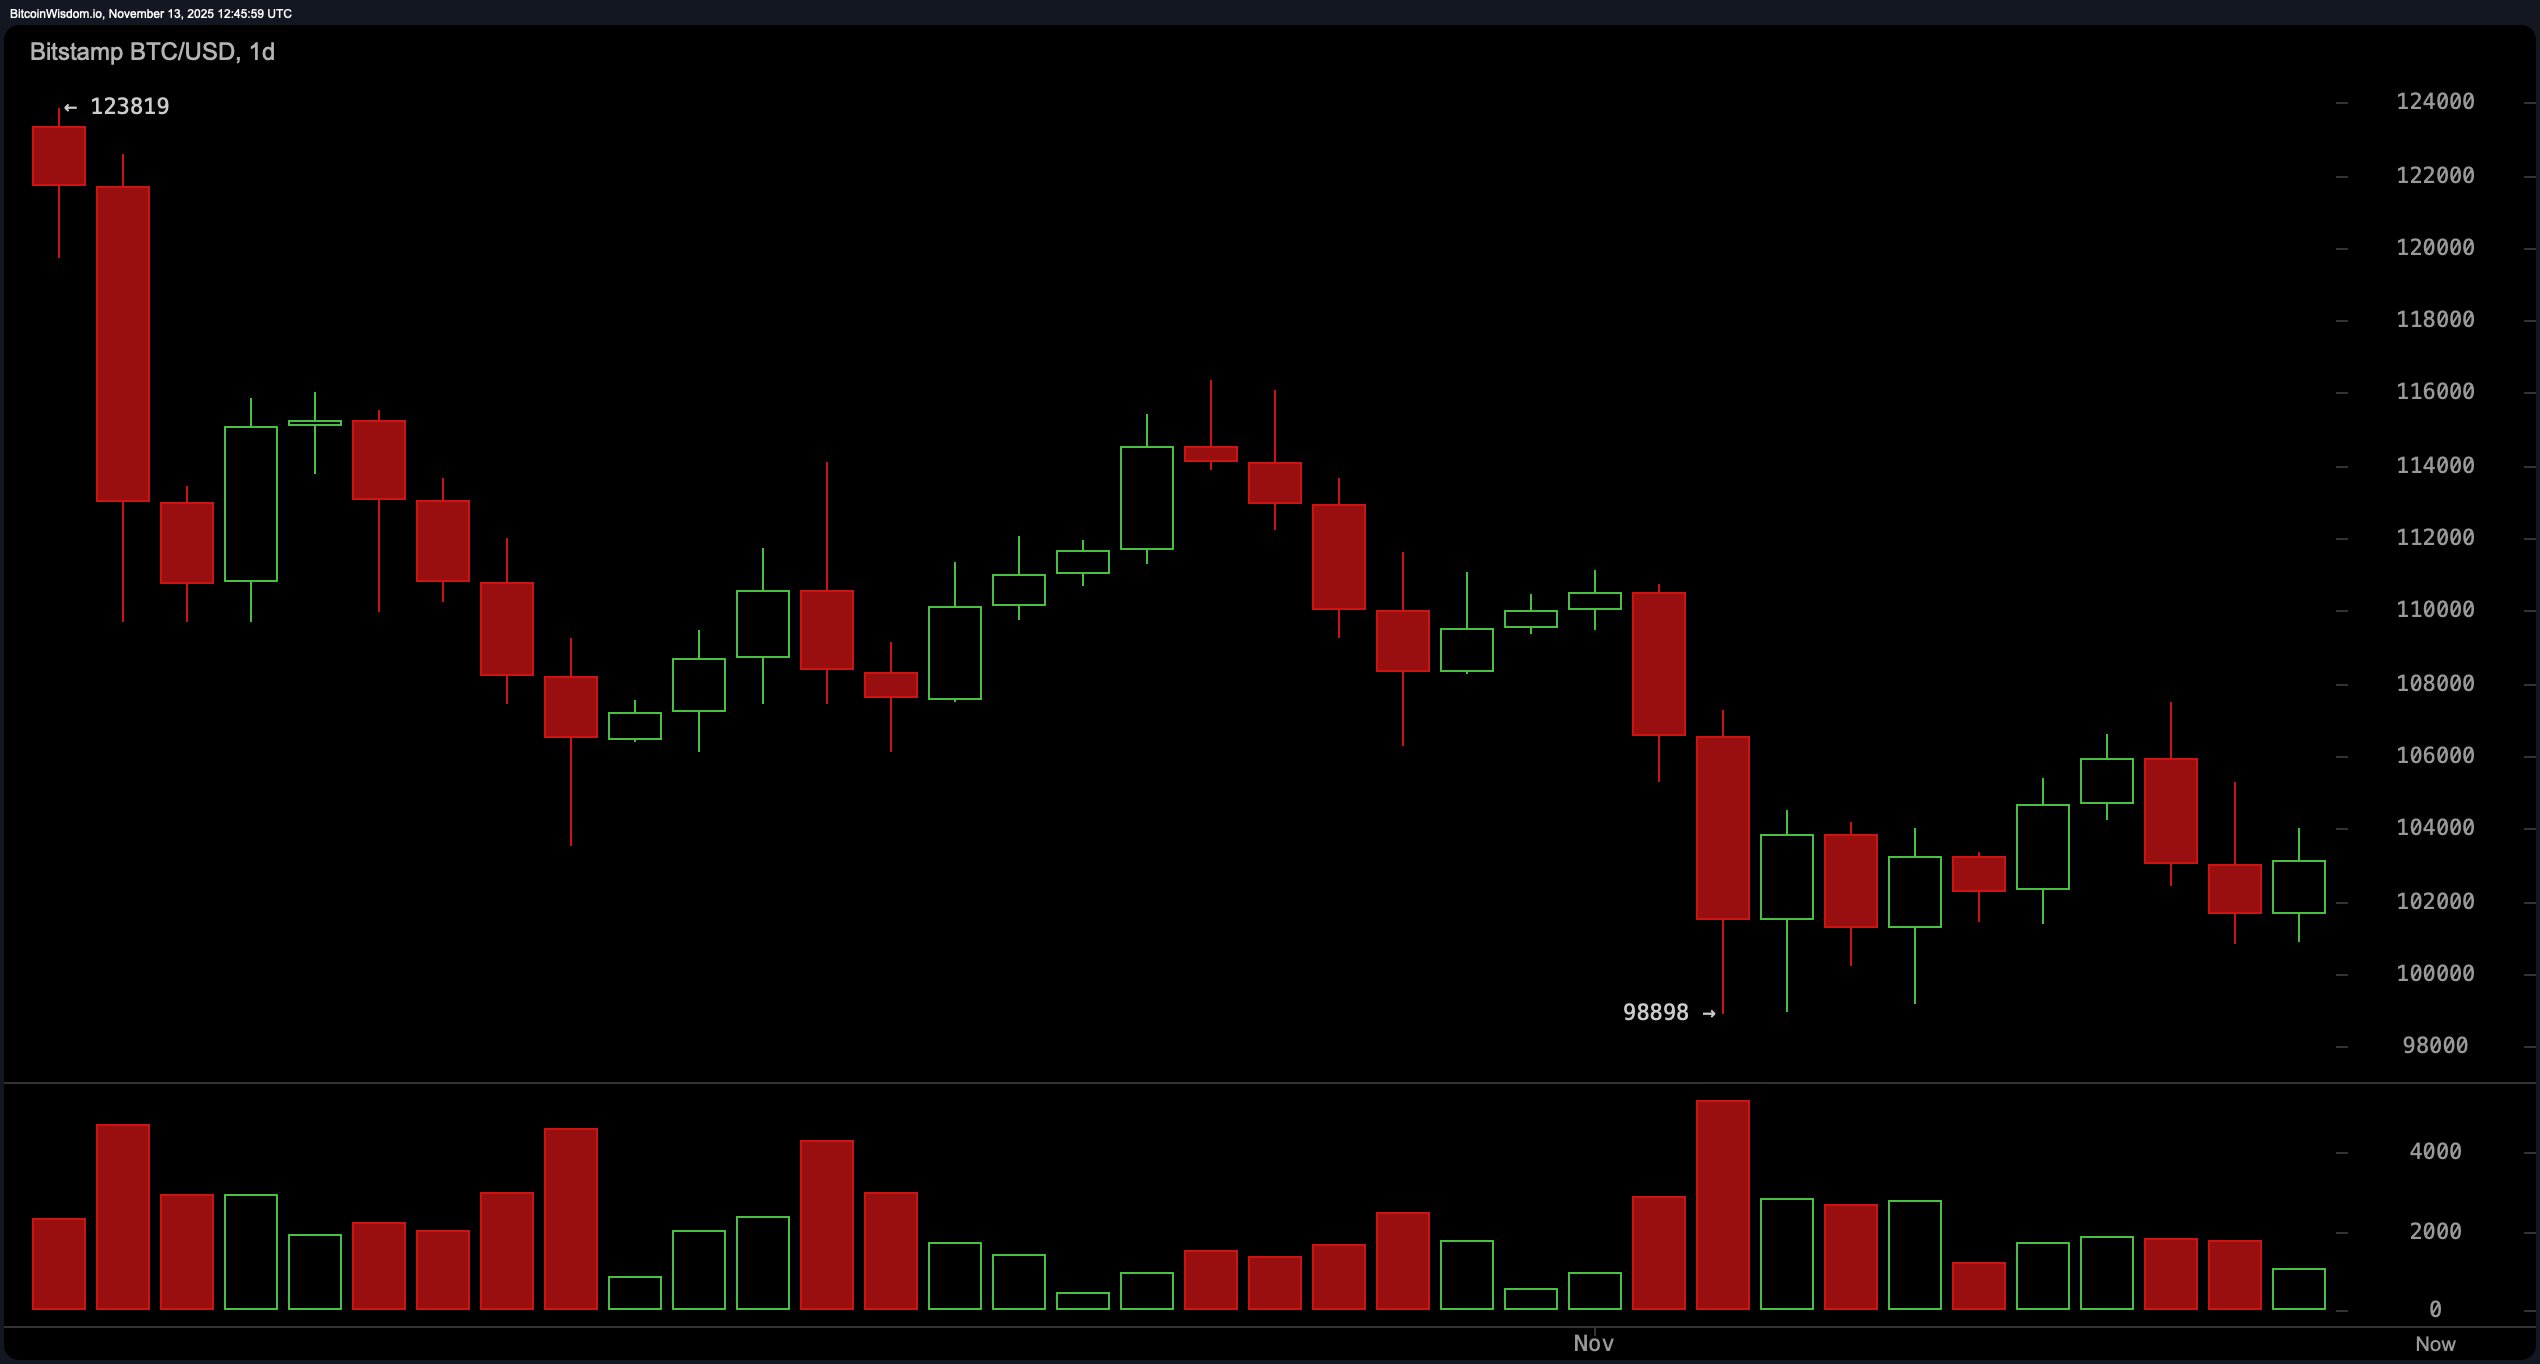
Bitcoin’s daily chart shows a market coming down from its recent climb, easing away from the $117,000–$118,000 region and grazing lows near $98,898 in the process. Volume on the latest red candles continues to fade, suggesting that downward momentum may be losing strength.
The key support level sits near $98,000, with resistance firming between $107,000 and $110,000. A potential bullish divergence could emerge if the price refuses to dip below $100,000, though bitcoin has a history of testing everyone’s nerves before making any decisive move.

BTC/USD 1-day chart via Bitstamp on Nov. 13, 2025.
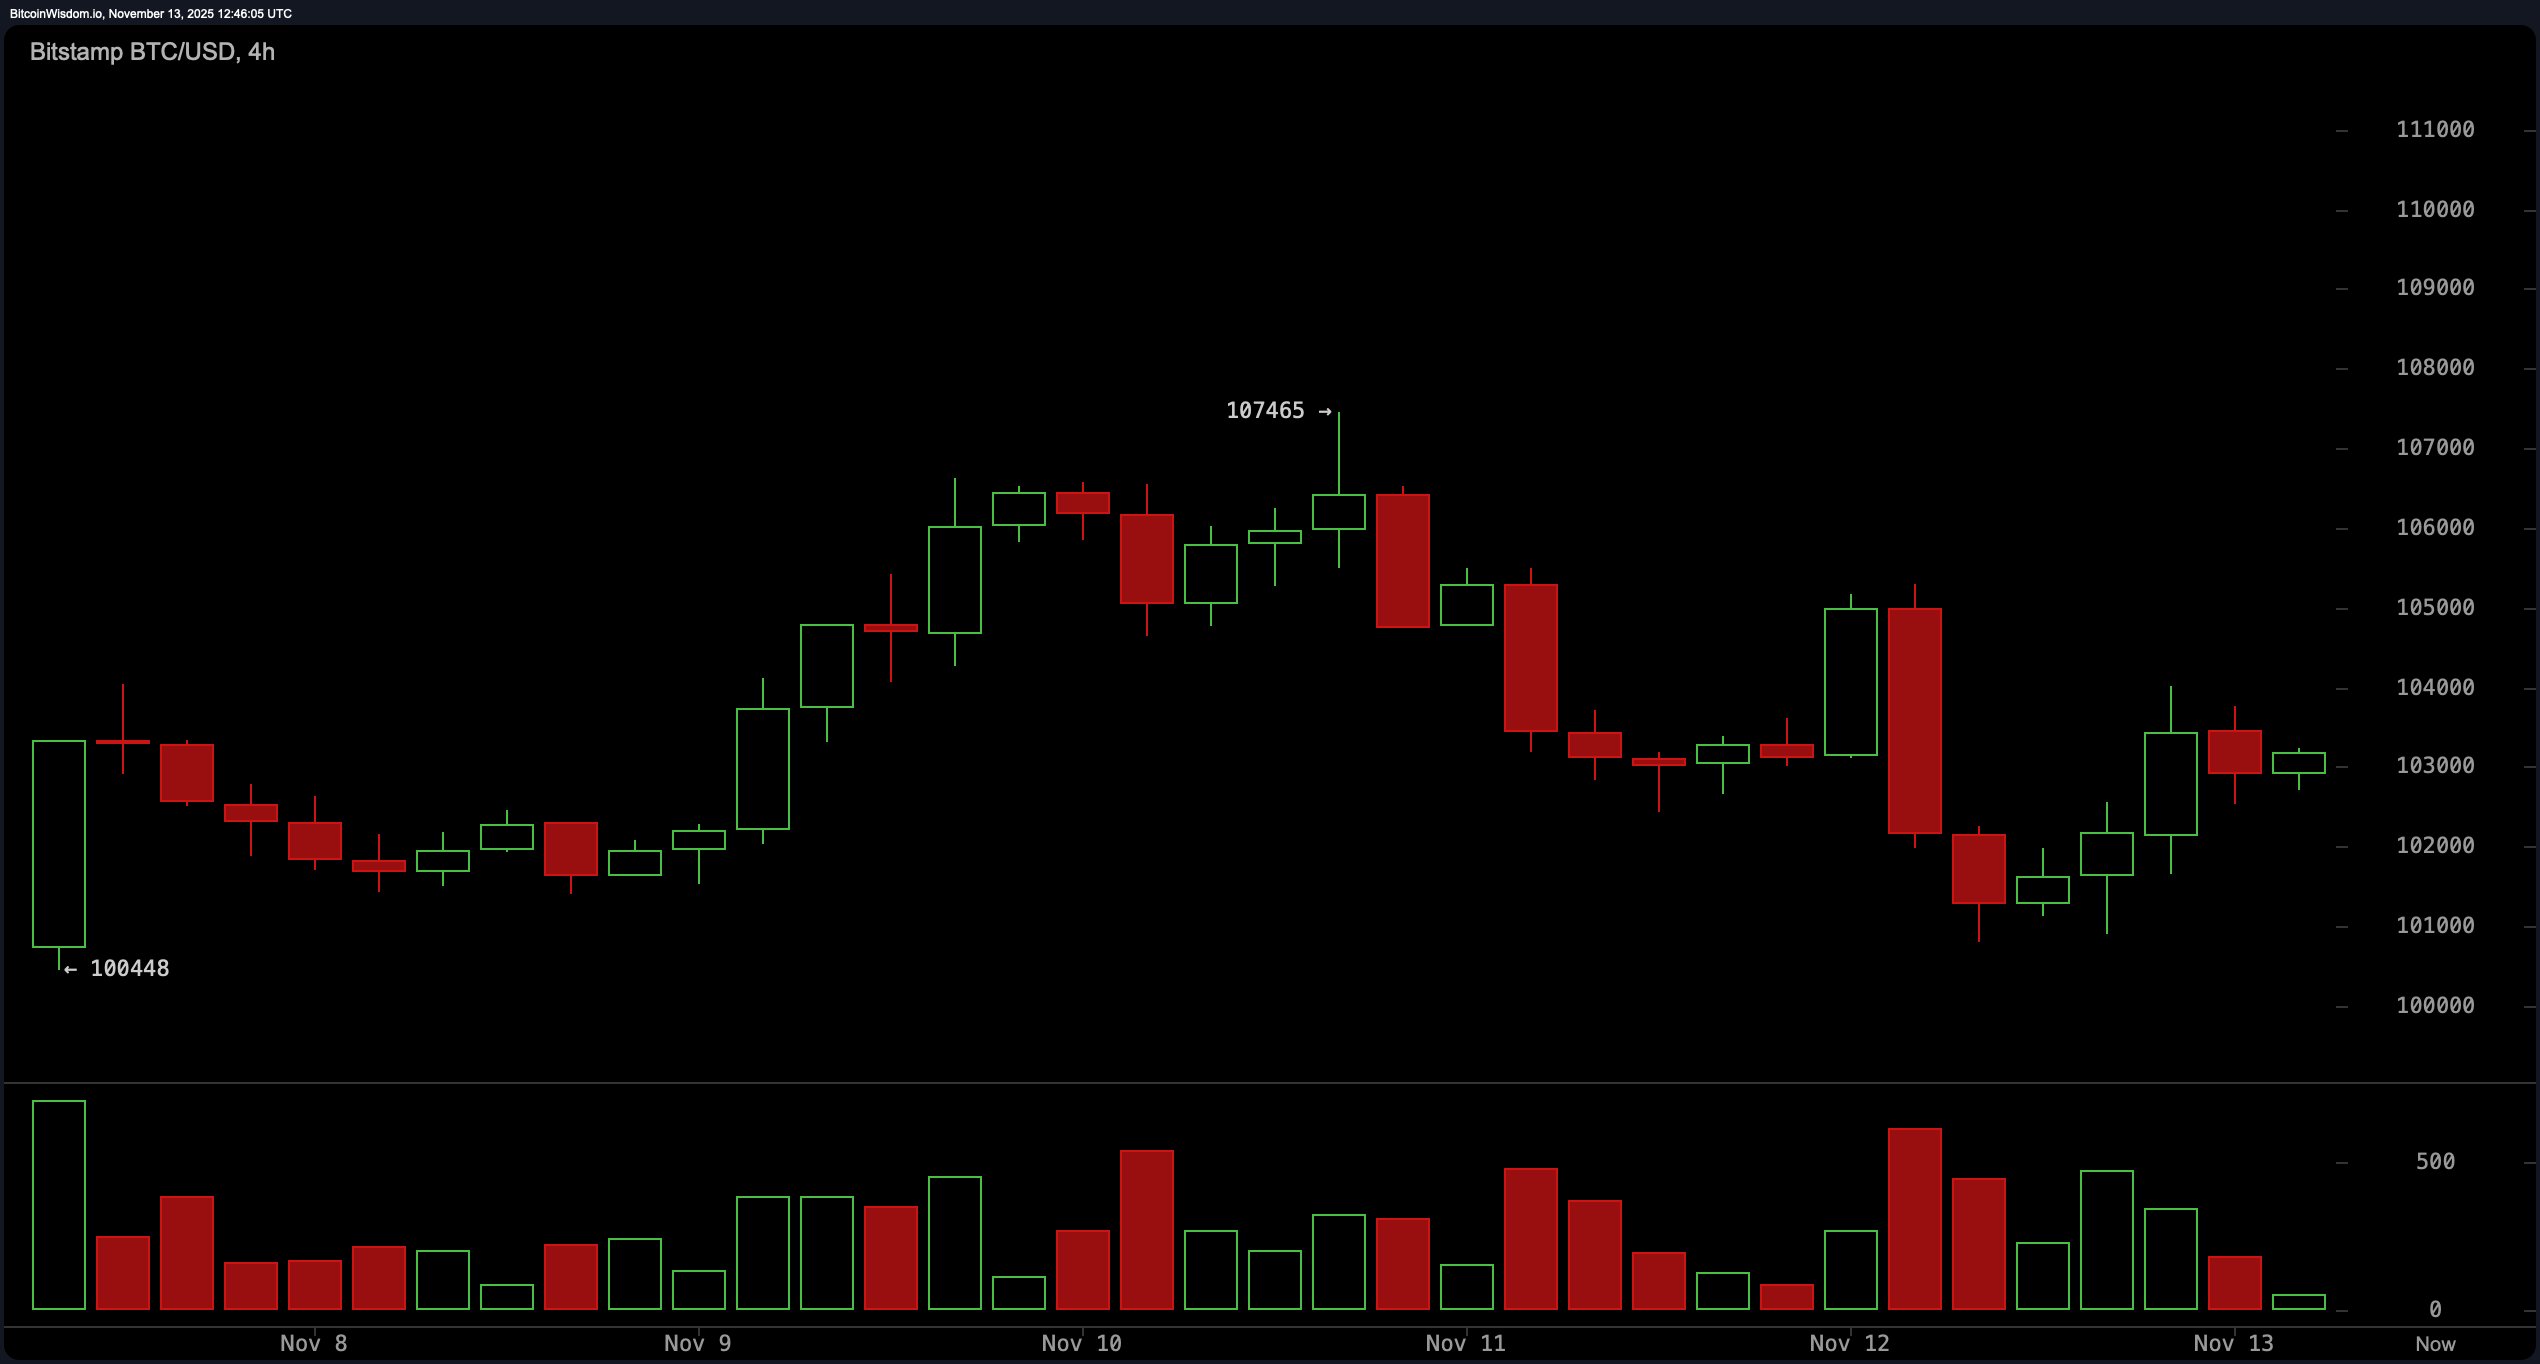
The four-hour chart captures a modest recovery from the $100,000 zone, though it lacks the kind of energy that would imply a confident reversal. Selling volume continues to flare up near $107,000, pointing to the stubbornness of resistance in that range. A possible bear flag appears to be forming beneath $104,000, adding a layer of caution to any short-term optimism. Despite minor rebounds, bitcoin seems more interested in teasing the market than committing to a clear directional push.

BTC/USD 4-hour chart via Bitstamp on Nov. 13, 2025.
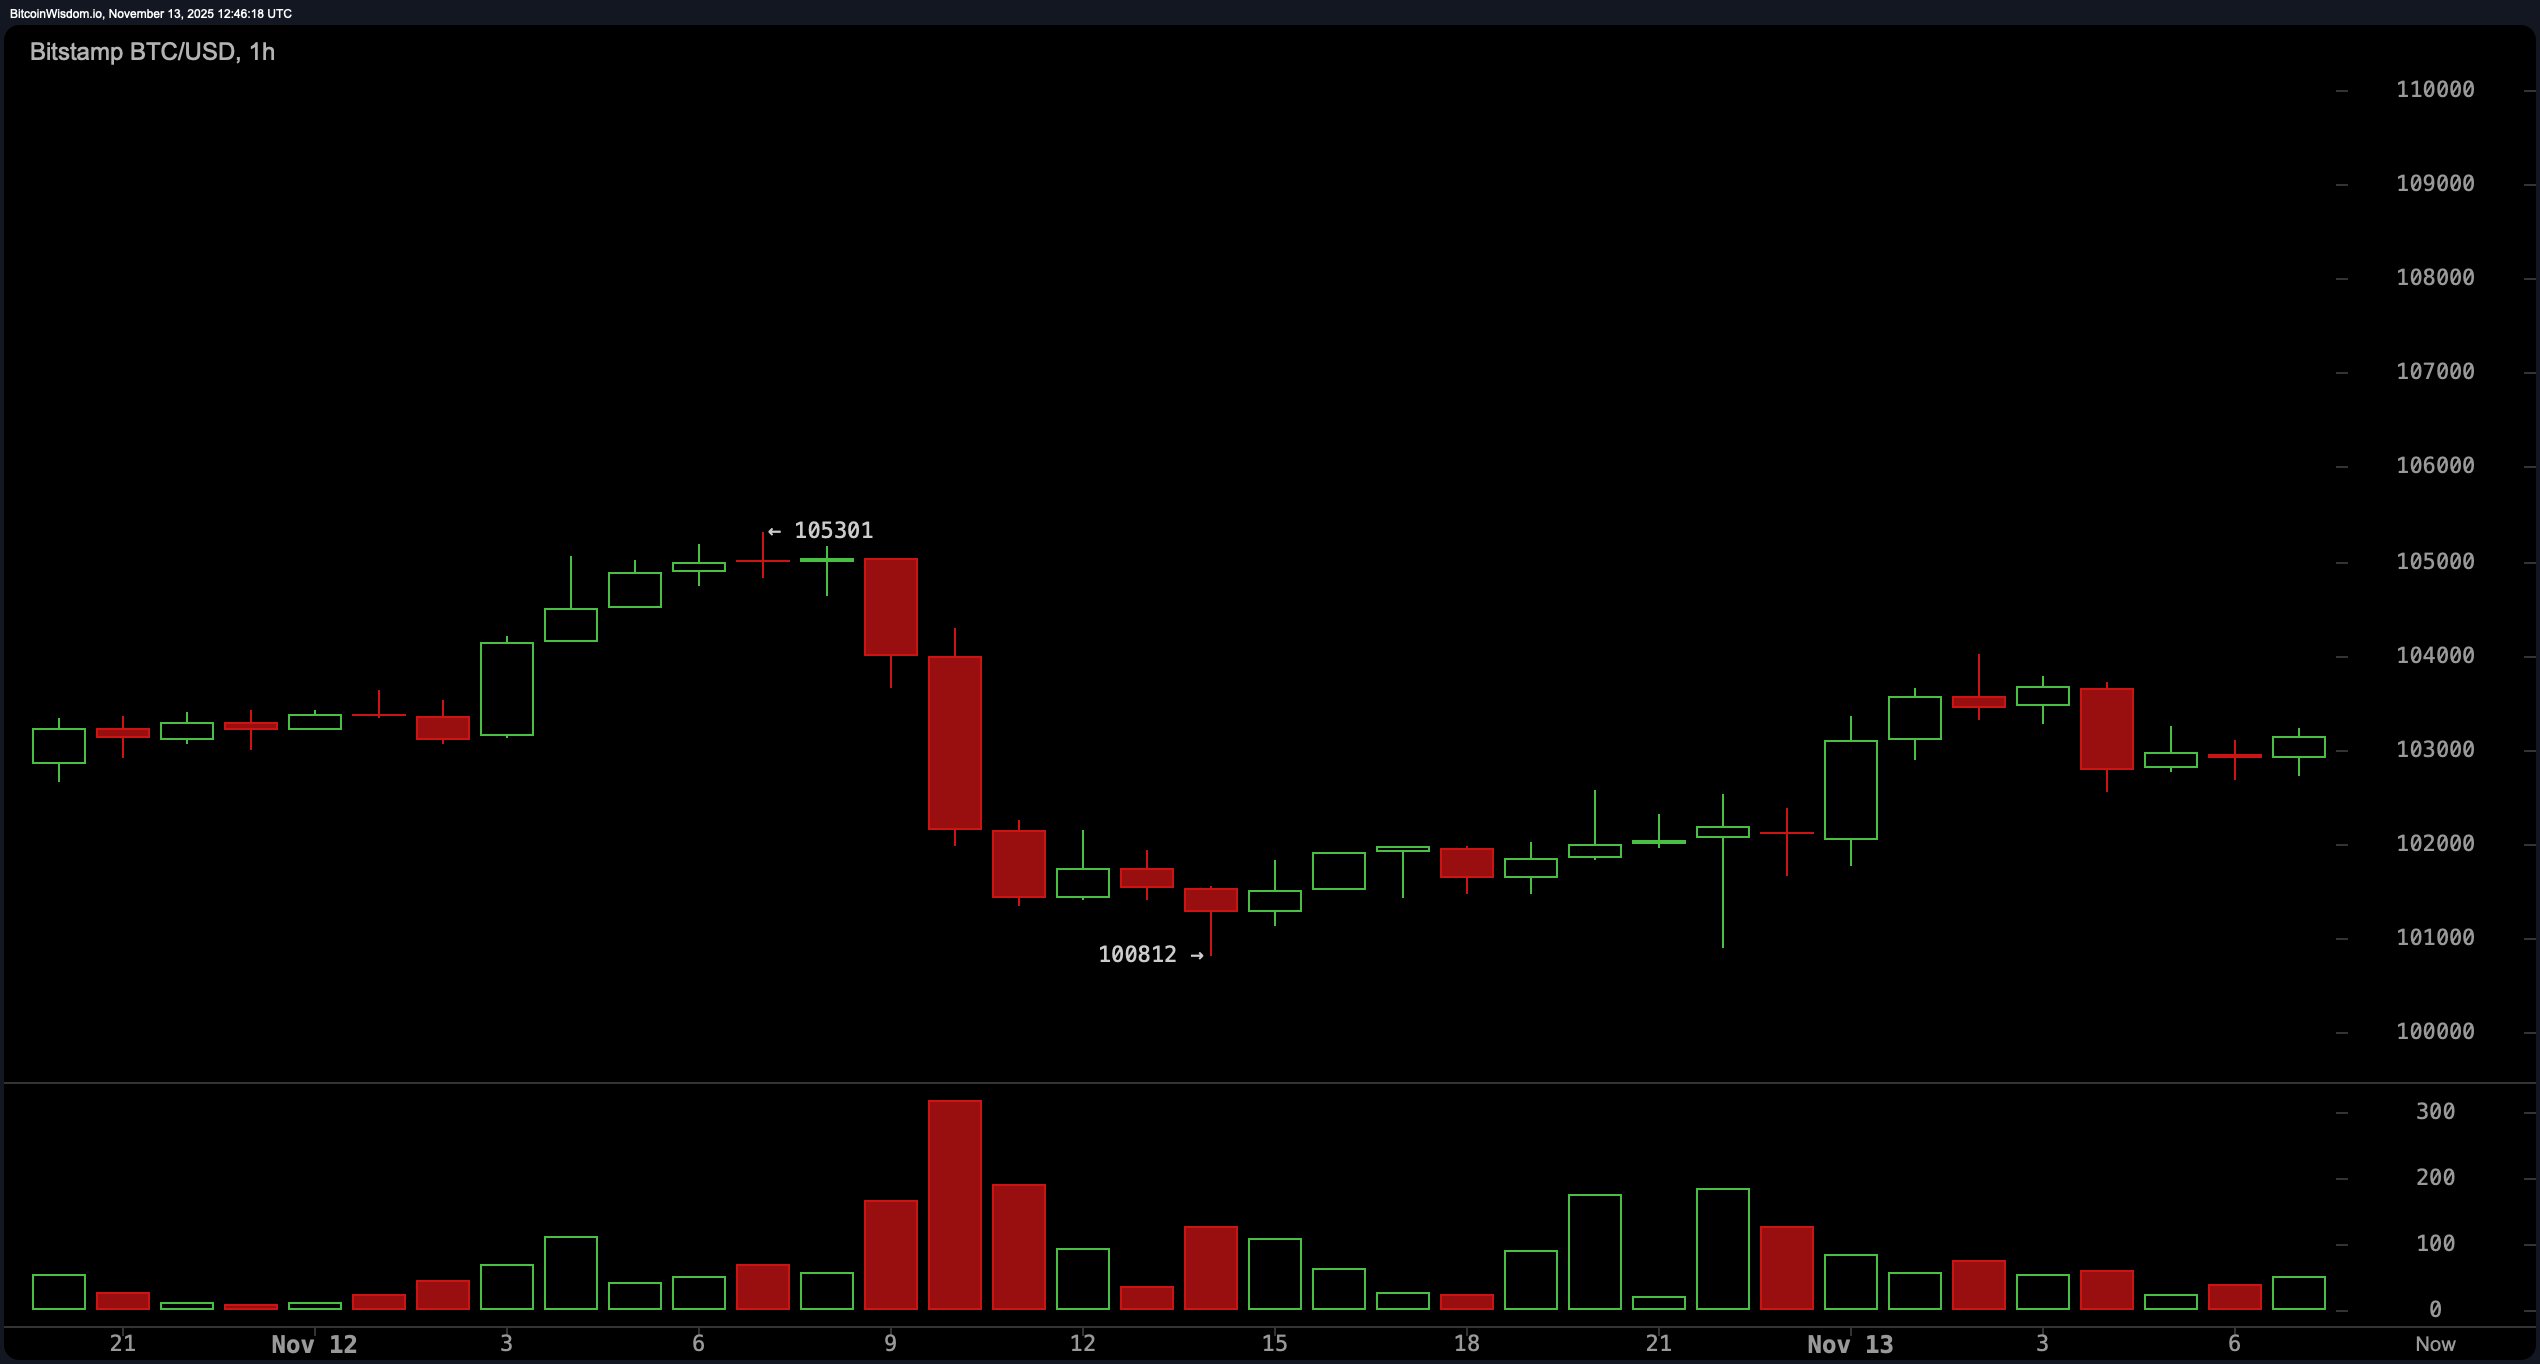
On the one-hour chart, bitcoin shows a small bounce off $100,812 into the $103,000–$104,000 region, but the strength behind this move appears half-hearted at best. Upward candles are accompanied by thinning volume, signaling limited enthusiasm from intraday traders. The result is a tight consolidation between $102,000 and $104,000, a range that reflects hesitation more than conviction. While a break above $104,000 could bring some short-lived momentum, the current action reads more like bitcoin stretching before deciding whether it’s running or walking.

BTC/USD 1-hour chart via Bitstamp on Nov. 13, 2025.
Oscillators offer a mixed bag, as if the indicators themselves couldn’t agree on whether to raise an eyebrow or shrug. The relative strength index (RSI) at 42, stochastic at 28, commodity channel index (CCI) at −73, average directional index (ADX) at 27, and awesome oscillator at −4,541 all settle into neutral territory. Momentum arrives at −3,391 with an upward implication, while the moving average convergence divergence (MACD) level sits at −2,476, reflecting a downward lean. It is a full ensemble of signals giving polite but contradicting commentary, leaving traders to pick which voice they trust most.
Most moving averages lean above the current market price, creating a layer of overhead pressure that bitcoin has yet to overcome. The exponential moving average (EMA) 10 at 104,061 sits above the price, as does the simple moving average (SMA) 10 at 103,066, while the EMA 20 at 105,976 and SMA 20 at 106,946 also remain out of reach.
Also read: Fibonacci Retracement: A Trader’s Compass in the Bitcoin Market
Higher-timeframe markers such as the EMA 50, SMA 50, EMA 100, SMA 100, EMA 200, and SMA 200 all maintain positions well above current levels, reinforcing the broader downward structure. Until bitcoin gathers enough strength to reclaim these averages, the market remains locked in a technically defensive posture, with every rally attempt forced to prove it isn’t just another head fake.
Bull Verdict:
Despite the heavy cluster of moving averages overhead, bitcoin’s ability to hold above the $100,000 zone while volume on the recent downturn fades leaves room for an upside surprise. If buyers can push through the $104,000–$107,000 pocket, the broader structure could shift toward recovery, signaling that momentum may be ready to turn the tables.
Bear Verdict:
With nearly every major moving average stacked above the current price and oscillators offering little clarity, bitcoin remains vulnerable to renewed downside if support near $100,000 weakens. A break toward the $98,000 level could reopen the path toward deeper retracements, showing that the market’s recent bounce may have been more of a pause than a turning point.
- What is bitcoin’s current price trend?
Bitcoin is consolidating between $102,000 and $104,000 with mixed technical signals. - Where are the key support and resistance levels?
Support sits near $98,000, while resistance strengthens between $107,000 and $110,000. - Are momentum indicators showing strength?
Most oscillators remain neutral, signaling hesitation rather than a clear direction. - How does volume affect bitcoin’s outlook right now?
Declining sell volume suggests weakening downward pressure, but not enough to confirm a shift.
免责声明:本文章仅代表作者个人观点,不代表本平台的立场和观点。本文章仅供信息分享,不构成对任何人的任何投资建议。用户与作者之间的任何争议,与本平台无关。如网页中刊载的文章或图片涉及侵权,请提供相关的权利证明和身份证明发送邮件到support@aicoin.com,本平台相关工作人员将会进行核查。


