Good evening, brothers!
If the real market price acts as an anchor point, then some economists' thoughts can explain why the stock market sometimes goes astray. The real market prices of all stocks act like a strong anchor, aligning the estimates of all investors, savers, asset managers, and other capital market decision-makers with the real stock prices. If this idea is correct, it means that the real market prices have a significant impact on future prices. People align their decisions for tomorrow with today's stock prices.
As a result, people may overlook the factors that drive prices in a new direction. Because the old set is treated as an anchor, as a reference point, the market drifts along the old track. In extreme and dynamic forms, one has to imagine: people buy because stock prices rise; people sell because stock prices fall. This quickly develops into a conscious process. The anchoring effect can explain why capital markets sometimes lose control.
……
Tech stocks are seeing bottom-fishing funds, gold is rebounding after a sharp drop, but Bitcoin is sinking alone, "unable to recover." What exactly is happening behind this? Why is the once-glorious cryptocurrency market now "tragic"?
On Friday (November 14), the U.S. stock market experienced a dramatic reversal. After a panic sell-off at the beginning of the trading session, funds began bottom-fishing tech stocks, and the Nasdaq and S&P 500 indices rebounded strongly after hitting key technical support levels. Meanwhile, gold, which had plummeted by more than $150 during the session, rebounded to around $4080, but Bitcoin became a clear exception: it fell 5% that day, dropping below the $94,000 mark, hitting a six-month low.
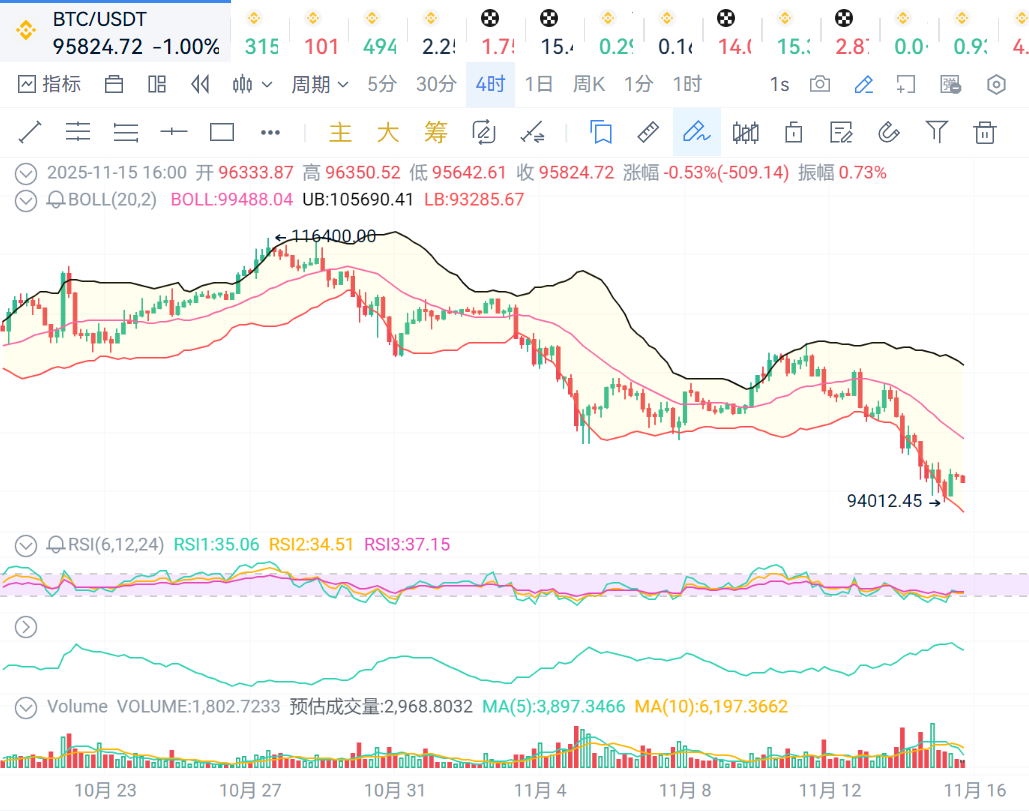
BTC: On the 4-hour level, the price continues to stay below the middle band of the Bollinger Bands, showing a weak price trend.
On the daily level, the price has broken below multiple moving average supports, showing a weak price trend.
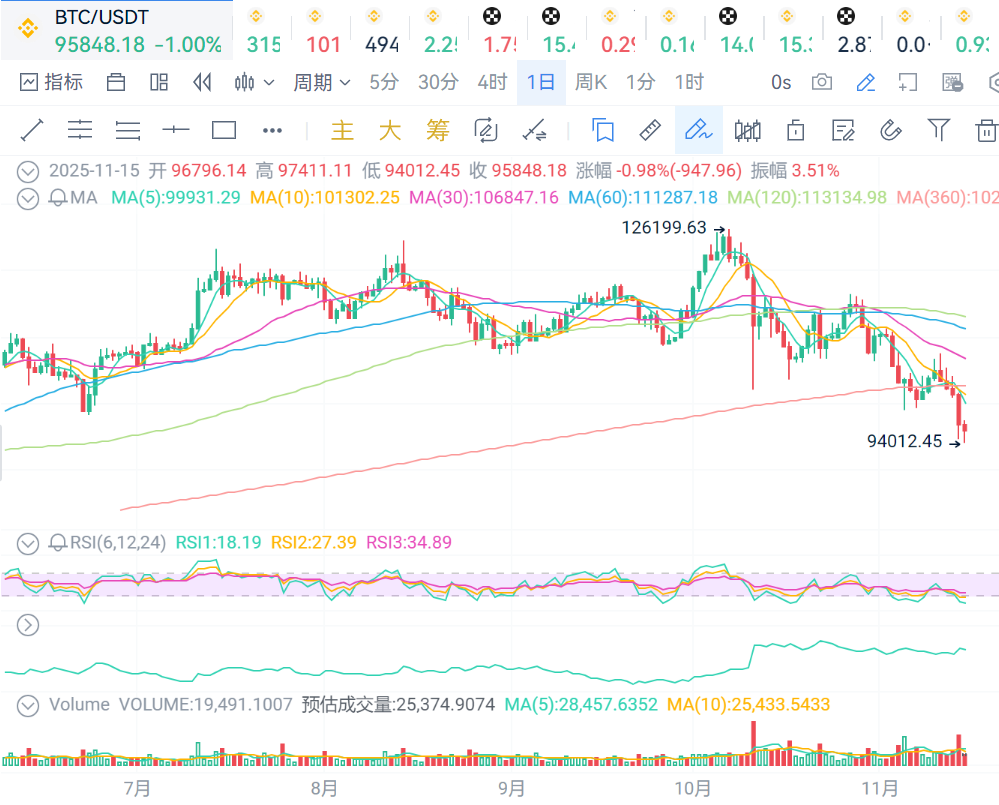
In summary, support level at 95,600, resistance level at 96,000.
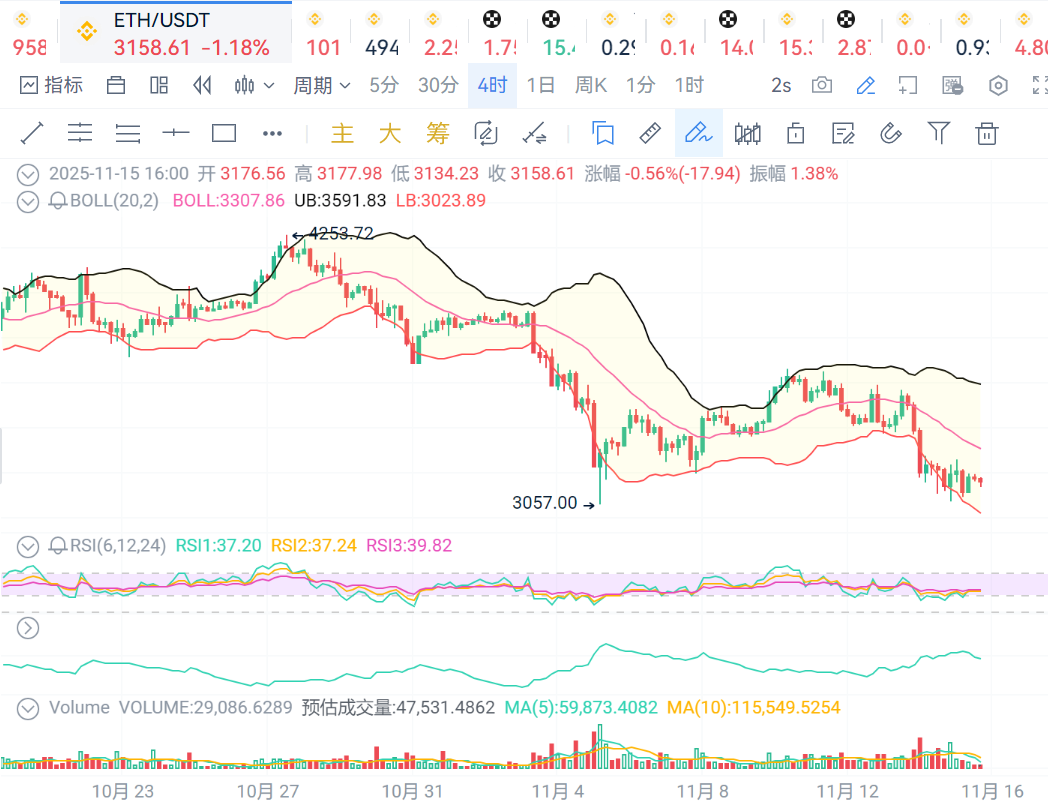
ETH: On the 4-hour level, the price continues to stay below the middle band of the Bollinger Bands, showing a weak price trend, with a support level at 3,150 and a resistance level at 3,170.
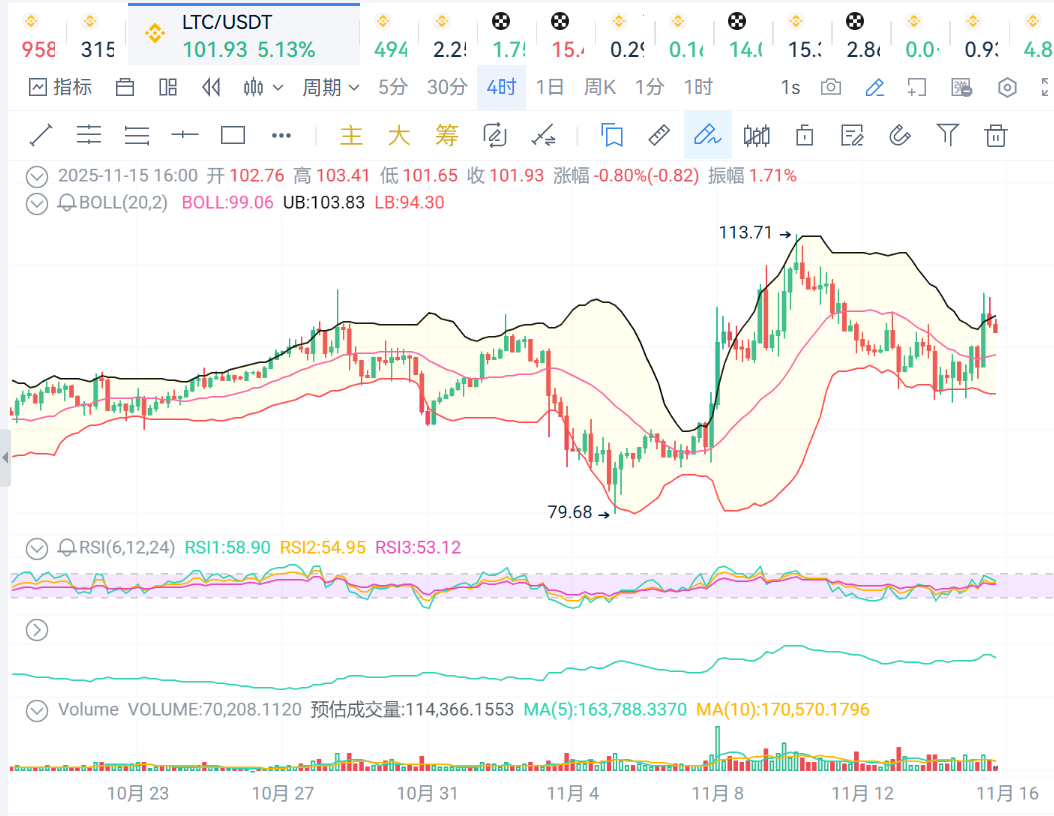
LTC: The price continues to stay above the middle band of the Bollinger Bands, showing a strong price trend, with a support level at 100 and a resistance level at 103.
BCH: The price continues to stay below the middle band of the Bollinger Bands, showing a weak price trend, with a support level at 480 and a resistance level at 510.
That's all for now, good night!

免责声明:本文章仅代表作者个人观点,不代表本平台的立场和观点。本文章仅供信息分享,不构成对任何人的任何投资建议。用户与作者之间的任何争议,与本平台无关。如网页中刊载的文章或图片涉及侵权,请提供相关的权利证明和身份证明发送邮件到support@aicoin.com,本平台相关工作人员将会进行核查。