11.17 Weekly K Bitcoin gap widens. It is expected that there will be a rebound for repair this week before continuing to decline? Pay attention to the following resistance and support levels?
After the weekly K update, Bitcoin broke below the lower Bollinger Band. The current MACD indicator is in negative territory, and the KDJ three lines are still diverging below the waterline. The MA5, 10, and 30-day moving averages are maintaining a downward resonance. The indicators are severely oversold, and the TD indicator has reached TD4, creating a gap of nearly 8000-9000 points between it and the MA5 daily moving average. A rebound repair trend is expected this week, with a focus on the key resistance above, at the 96700-98000 level. If it cannot stabilize effectively, the overall direction still needs to be viewed with caution.
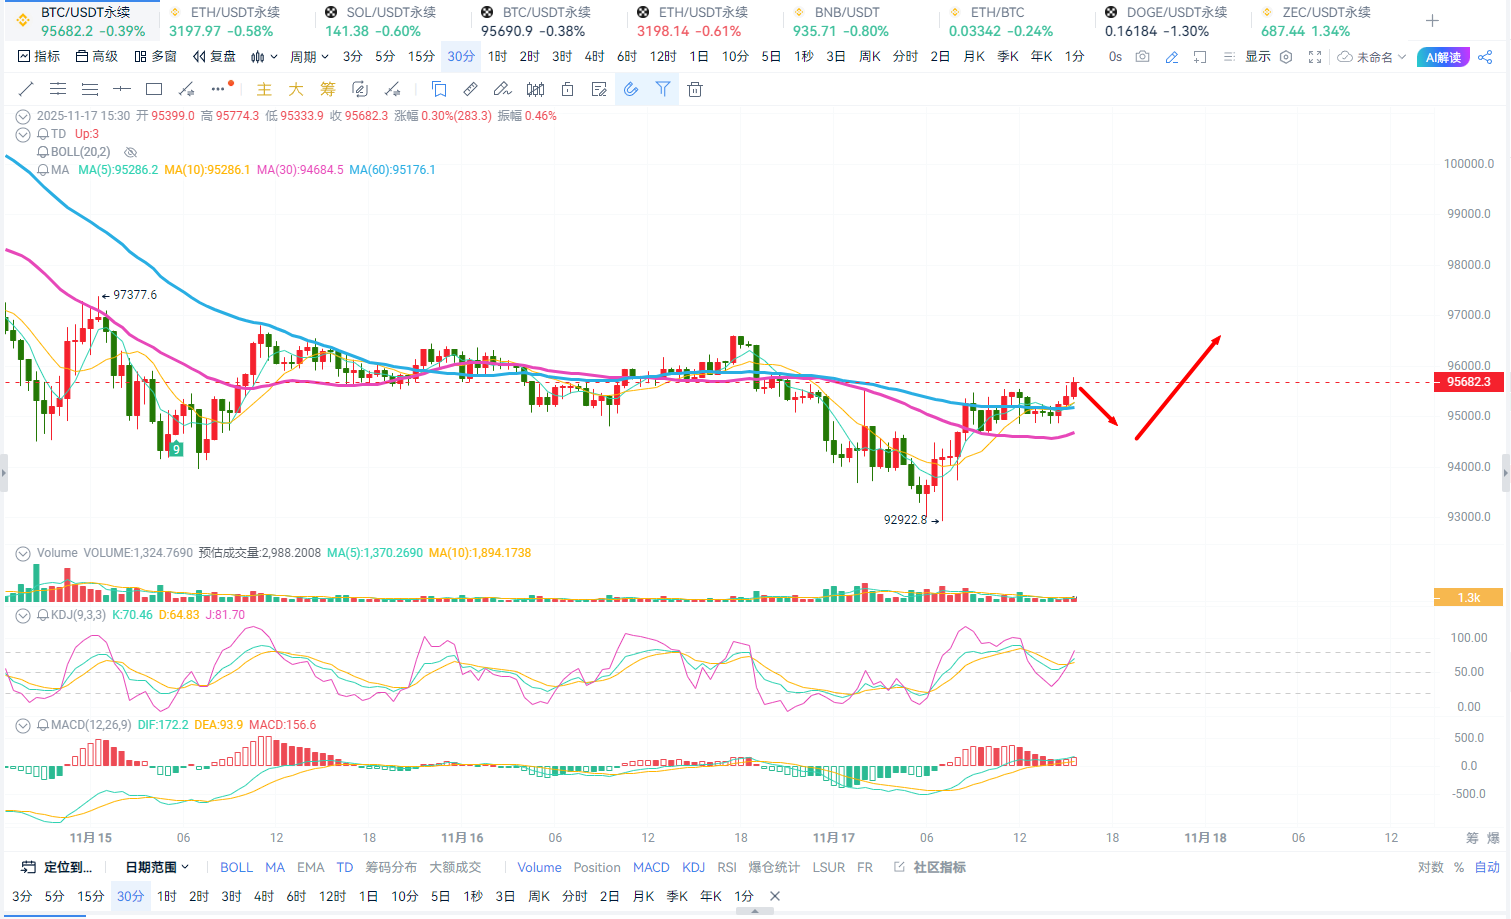
On the daily line, the current K column shows a mixed arrangement. The MACD and KDJ indicators are diverging in a mixed sentiment in the short term. Combined with the 12-hour line, the current price is slightly inclined towards a small range of oscillation and adjustment. The short-term volume is showing signs of slowing down, and a significant breakthrough above the 96700-98000 key resistance is needed to confirm the return of a short-term bullish trend.
On the 4-hour line, Bitcoin is showing a slight rebound sentiment. The MACD and KDJ indicators are slightly inclined to rise in the short term, and the MA5 and 10-day moving averages are showing a slight upward sentiment. The lower Bollinger Band is starting to narrow, indicating a short-term halt in the decline. The short-term support reference is at the 93000-88000 level. Judging from the hourly line, Bitcoin is likely to experience a slight oscillation and rebound to test the strength of the upper resistance. Therefore, for intraday trading strategies, my personal view is to consider buying low and selling high.
Trading strategy: Try to buy at 95000-94200. Target: 96500-98000. Stop loss: 93700.
After the rebound, further instructions will be provided.
Ethereum's short-term trend is basically in sync with Bitcoin. After touching the 3000 mark in the morning, it started to pull back. The current key resistance is at the 3248-3370 level. Only after stabilizing above the first resistance can Ethereum have a chance to test the 3370 level. Therefore, for intraday trading strategies, my personal view is to consider buying low and selling high.
Trading strategy: Buy at 3170-3130. Target: 3240-3310, with a spike towards 3370. Stop loss: 3100.
The current trend is expected to be sufficient, and follow-up will continue.
Personal views are for reference only. There may be delays in article review and push notifications. The market changes rapidly, and specific entry and exit points should be based on real-time guidance. Please invest cautiously.

免责声明:本文章仅代表作者个人观点,不代表本平台的立场和观点。本文章仅供信息分享,不构成对任何人的任何投资建议。用户与作者之间的任何争议,与本平台无关。如网页中刊载的文章或图片涉及侵权,请提供相关的权利证明和身份证明发送邮件到support@aicoin.com,本平台相关工作人员将会进行核查。