Bitcoin erased more than 30% of its gains since the beginning of the year just over a month after reaching a historic high. The recent cooling of AI tech stocks has led to a decline in overall risk appetite, causing Bitcoin funds to exit first. Additionally, most investors believe in Bitcoin's four-year cycle and are rushing to sell Bitcoin before the bear market arrives, with the fear and greed index having fallen back into the extreme fear zone.
With Trump increasing tariffs in April, Bitcoin's price briefly dropped to a low of $74,508, then rebounded to a historic high of $126,199, but has recently seen a pullback, dipping below the closing price of the annual K-line for 2024 on Sunday, effectively nullifying this year's gains.
Moreover, with Powell and Federal Reserve officials continuously lowering expectations for a rate cut in December, the crypto market experienced severe fluctuations this morning, with Bitcoin's price plummeting to $93,005 in just a few hours before rebounding sharply, while Ethereum also briefly dipped to the $3,000 mark. In the past 24 hours, forced liquidations for bulls reached as high as $390 million.
Bitcoin Four-Hour Chart
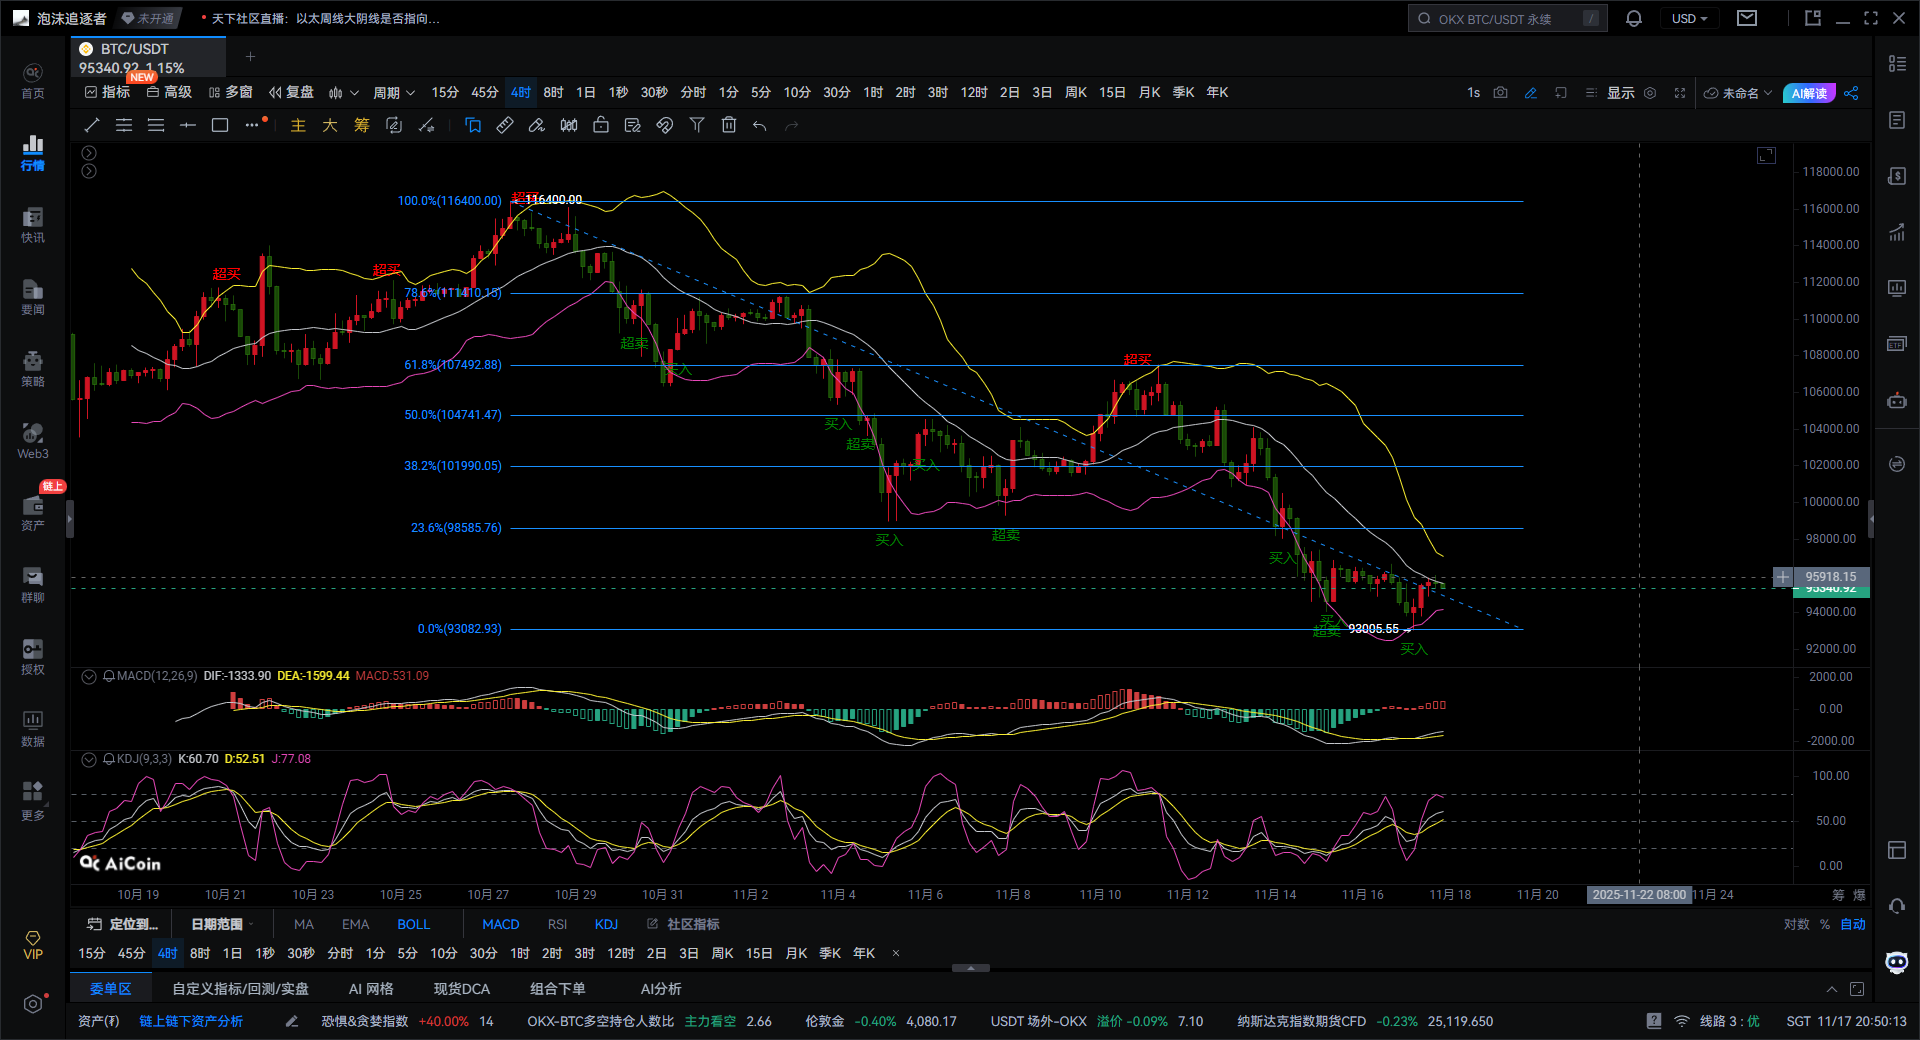
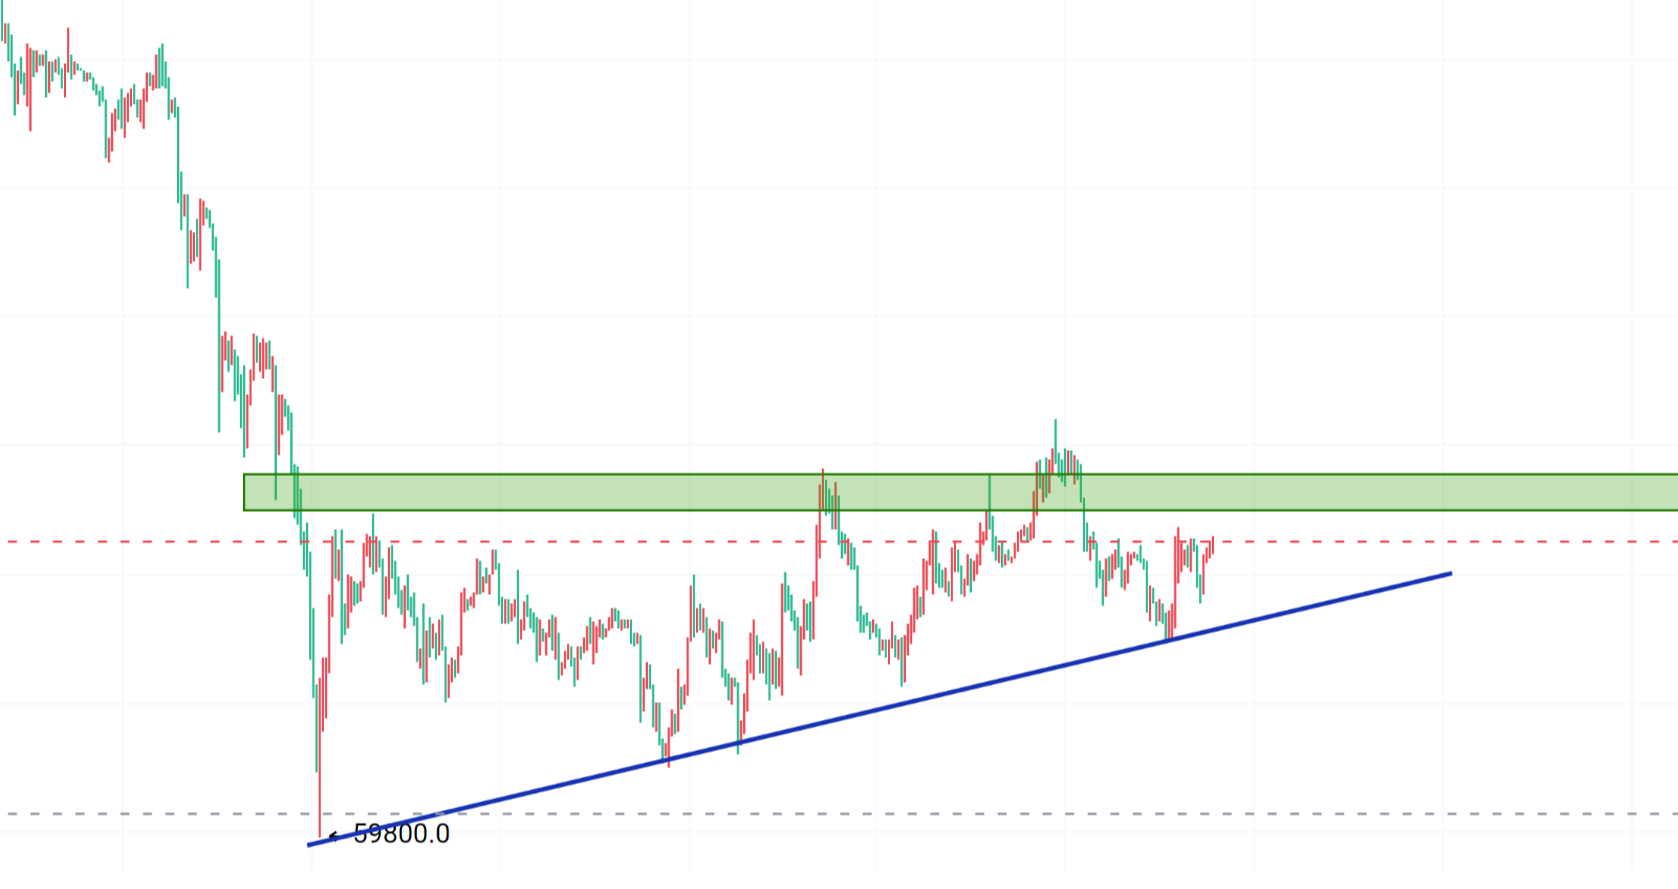
Bitcoin is currently at the end of a descending wedge consolidation, with the price rebounding from a recent low of $93,005 to around $95,918, showing signs of a bottom in the short term. The Bollinger Bands indicator shows strong support at the lower band between $93,000 and $94,000, with the price testing this area multiple times effectively; the current price is attempting to break through the middle band at $97,000, and if it can hold above this level, it will open up space towards the upper band at $101,000-$102,000.
The MACD indicator has formed a golden cross, with the MACD histogram turning from green to red, indicating that rebound momentum is strengthening, but overall it remains below the zero axis, temporarily classifying it as a rebound within a downtrend, and the trend reversal has not yet been confirmed. In the KDJ indicator, the K line and D line values have formed a golden cross, with the J line value being relatively high, indicating a possible short-term pullback, but the overall structure is bullish.
Fibonacci retracement shows that from the swing low of $93,005 to the high of $116,400, the key resistance levels are $98,585 (23.6%), $101,990 (38.2%), and $104,700 (50%). The current price is below the 23.6% resistance, and it needs to break through this level to confirm the continuation of the rebound.
In summary, Bitcoin is at a critical reversal point, and there are three potential paths ahead:
1. Main upward path: Break through the upper edge of the wedge at $97,000-$97,500, targeting $98,585 and $101,990, with a break above $104,700 confirming a trend reversal.
2. Consolidation pullback path: If the rebound fails to break through $97,000, it may pull back to the support at $94,500, or even test the low of $93,000 again.
3. Extremely weak downward path: If it breaks below $93,000, it may test the $90,000-$92,000 area, but the current technical support is low.
Based on the above, the following suggestions are provided for reference:
Bulls can pay attention to rebound opportunities after breaking $97,500, targeting $98,500 and above; the support zone of $94,000-$94,500 can be used as a reference for adding positions. Bears should be cautious of resistance levels at $101,800-$102,200 and $104,700.
Giving you a 100% accurate suggestion is not as good as providing you with the right mindset and trend; teaching someone to fish is better than giving them fish. It’s suggested to earn for a moment, but learning the mindset will help you earn for a lifetime!

Written on: (2025-11-17, 20:50)
(Text - Master Says Coin) Disclaimer: Online publication has delays, and the above suggestions are for reference only. Investment carries risks; proceed with caution!
免责声明:本文章仅代表作者个人观点,不代表本平台的立场和观点。本文章仅供信息分享,不构成对任何人的任何投资建议。用户与作者之间的任何争议,与本平台无关。如网页中刊载的文章或图片涉及侵权,请提供相关的权利证明和身份证明发送邮件到support@aicoin.com,本平台相关工作人员将会进行核查。