Yesterday we mentioned that various indicators are trending towards bearish, so we maintain a bearish outlook. At the same time, we emphasized that it is best to close with a bearish candle, and the market performed strongly, closing with a bearish candle as we expected. Looking at the weekly chart, last week exceeded expectations, and there is a possibility of continuing downward this week.

Weekly Level
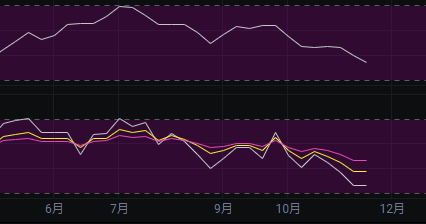
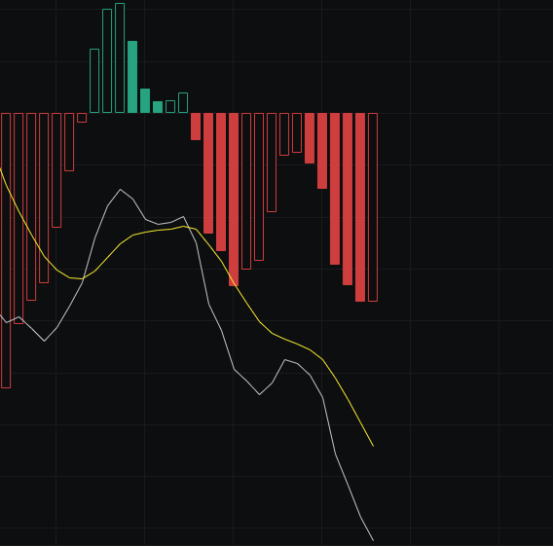
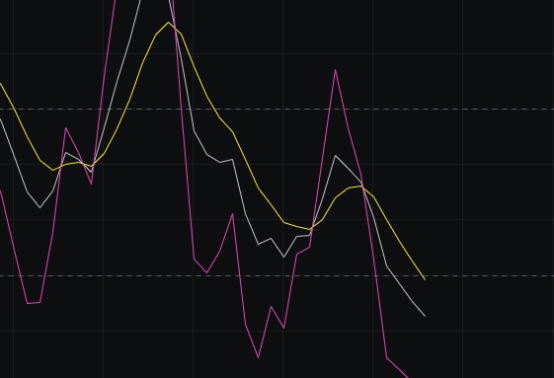
From the MACD perspective, the fast line has currently touched the zero axis. We have previously stated that we should first look for the fast line to touch the zero axis, and that target has been achieved. Next, we will see if it can rebound from here; if it does, it will move up a bit, but if it cannot, it will continue to decline.
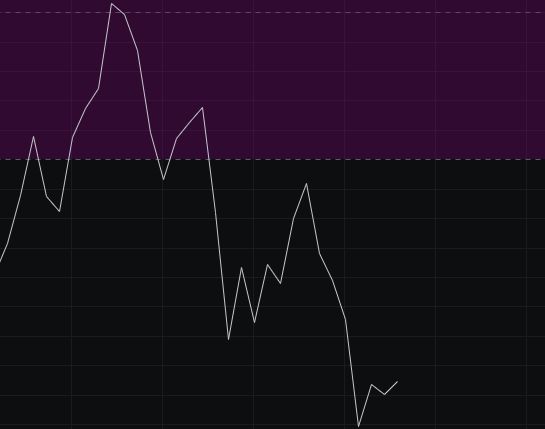
From the CCI perspective, the CCI has now moved far from 100. Since the CCI has chosen to move downward and is far from 100, its next target is to approach the zero axis, so there is still a possibility of further decline from the CCI perspective.

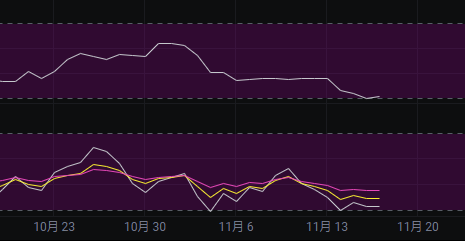
From the OBV perspective, the continuous outflow of OBV over the past few weeks has caused the fast line to diverge from the slow line, and the slow line has also turned downward, so we continue to look bearish here.
From the KDJ perspective, the KDJ has touched 20 and shows signs of continuing downward, indicating that the market is leaning towards bearish.
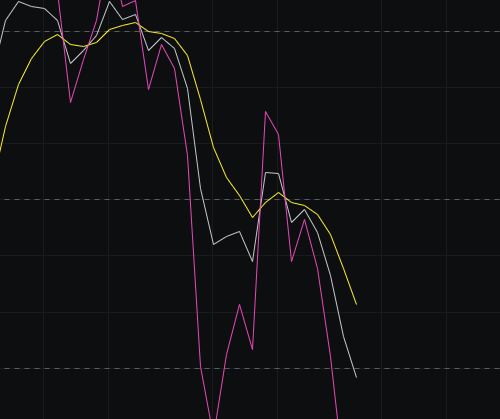
From the MFI and RSI perspectives, both indicators are in a weak zone and are moving downward, which also indicates a bearish outlook.
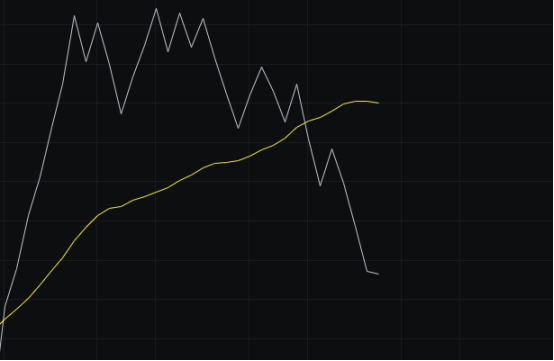
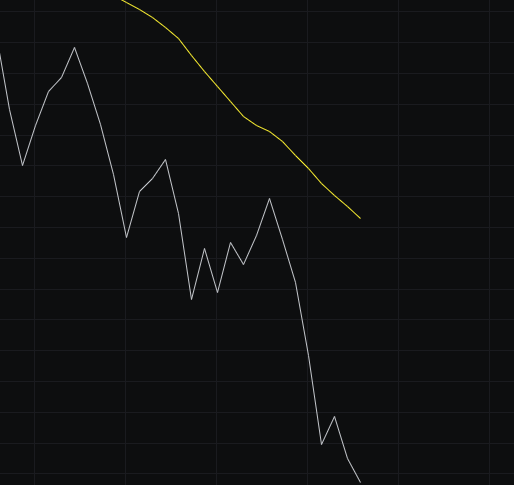
From the moving averages perspective, last week the BBI and the 30-line completed a death cross, and this week the 30-line has nearly flattened out. These all indicate a weak market, and the next step is to see if the 30-line turns downward.

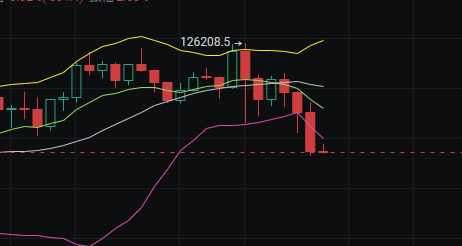
From the Bollinger Bands perspective, after opening, last week saw a significant drop that exceeded our expectations, so we believe last week exceeded its targets. Currently, the Bollinger Bands show a negative divergence; normally, there would be a rebound to correct this negative divergence, but it cannot be ruled out that it may continue to decline and maintain the negative divergence. Due to the weak market trend, we do not recommend bottom fishing here.
Daily Level
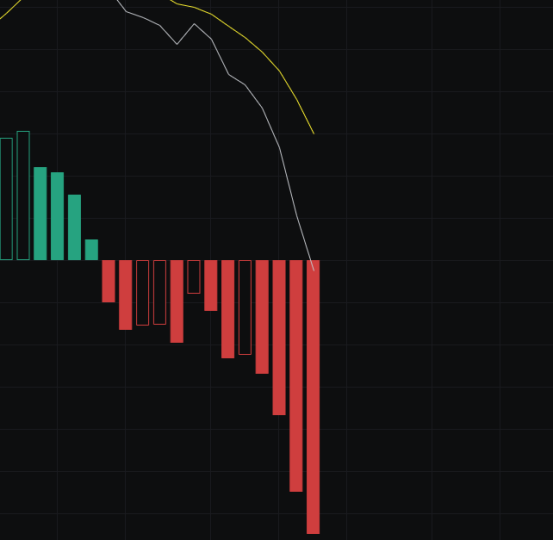
From the MACD perspective, the energy bars show signs of stopping the decline, but the fast line and slow line are still moving downward. If we are looking for a rebound here, we need to first see the fast line flatten out.
From the CCI perspective, the CCI is currently far from -100 and cannot return to the vicinity of -100 in the short term, so overall we still maintain a bearish outlook.
From the OBV perspective, the OBV continues to flow out, and there is almost no decent defense from the bulls here, so it is still too early to be bullish.
From the KDJ perspective, we previously mentioned that if the KDJ breaks below 20, there is a possibility of continued decline. Currently, it has already declined for two consecutive days, which aligns with our judgment on the KDJ. To stop the decline, we need to first see the KDJ flatten out.
From the MFI and RSI perspectives, both indicators are moving downward and are close to the oversold area, indicating a very weak market, so we are not bullish and will not bottom fish here.
From the moving averages perspective, several moving averages are pressing down, so the moving averages also indicate a bearish outlook. Additionally, there have been upper shadows for three consecutive days; will it drop significantly like last time after three consecutive days of upper shadows? We will wait and see.
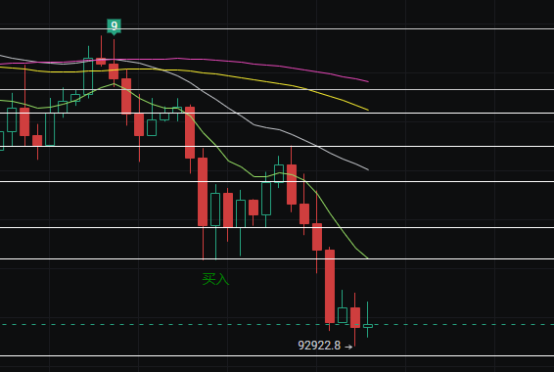
From the Bollinger Bands perspective, yesterday we emphasized that it is best to close with a bearish candle, and the market closed with a bearish candle as we expected. Currently, although today is a bullish candle, the Bollinger Bands pattern has been solidified, so we continue to maintain a bearish mindset. To change our outlook, we need to wait for a change in the pattern.
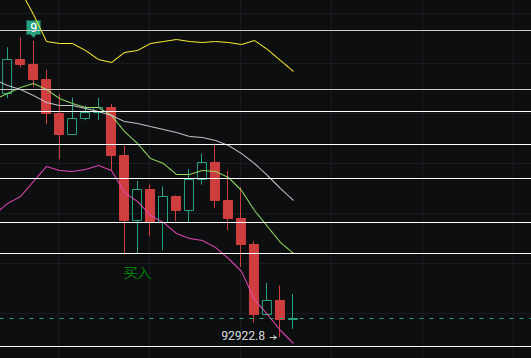
In summary: Last week's significant drop exceeded our expectations. This week, looking at the weekly and daily charts, all indicators are leaning towards bearish, so we continue to maintain our bearish mindset. Today's resistance is seen at 96,000-97,000, and support is at 93,500-92,500.
免责声明:本文章仅代表作者个人观点,不代表本平台的立场和观点。本文章仅供信息分享,不构成对任何人的任何投资建议。用户与作者之间的任何争议,与本平台无关。如网页中刊载的文章或图片涉及侵权,请提供相关的权利证明和身份证明发送邮件到support@aicoin.com,本平台相关工作人员将会进行核查。