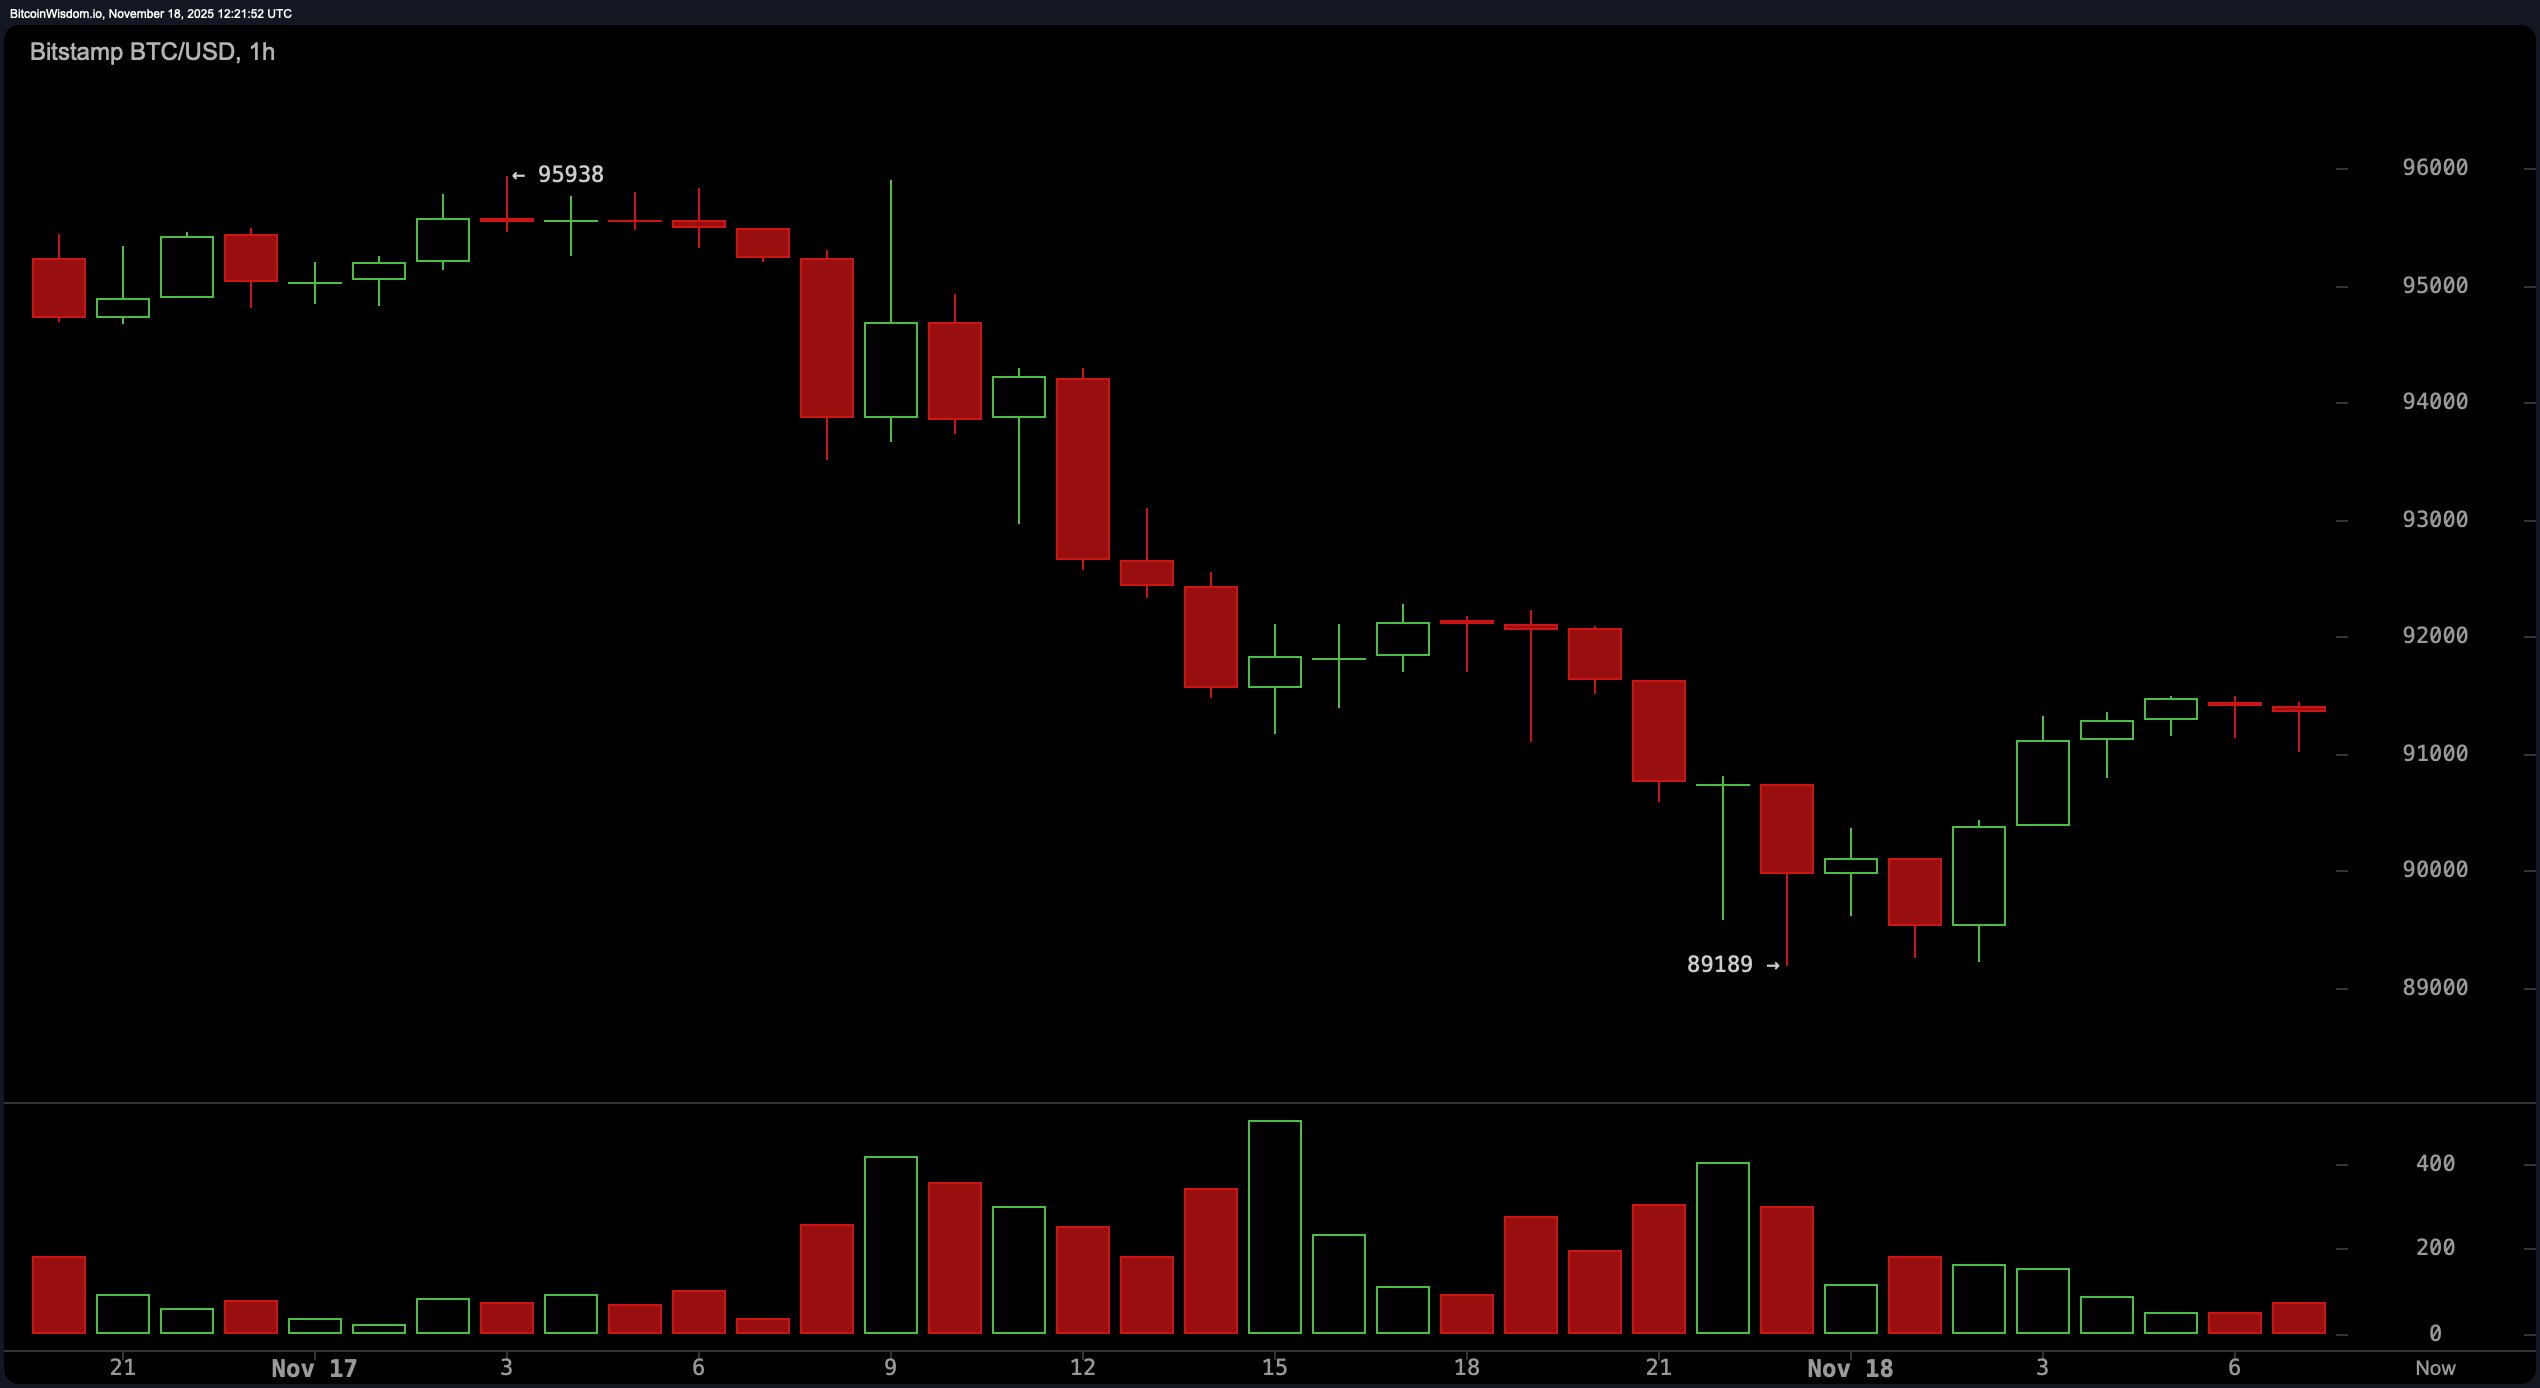
The 1-hour chart hints at a faint heartbeat after bitcoin dropped to $89,189, eking out a few green candles in what might generously be called a recovery. The short-term ascending movement is just convincing enough to trap hopefuls, yet structurally it resembles a bearish retest of former support.
With price action flirting with $91,500 to $92,000, don’t pop the champagne just yet—this rising wedge formation is notorious for breakups, not breakthroughs. And unless volume kicks in to support a breakout, this dance is headed downward.

BTC/USD 1-hour chart via Bitstamp on Nov. 18, 2025.
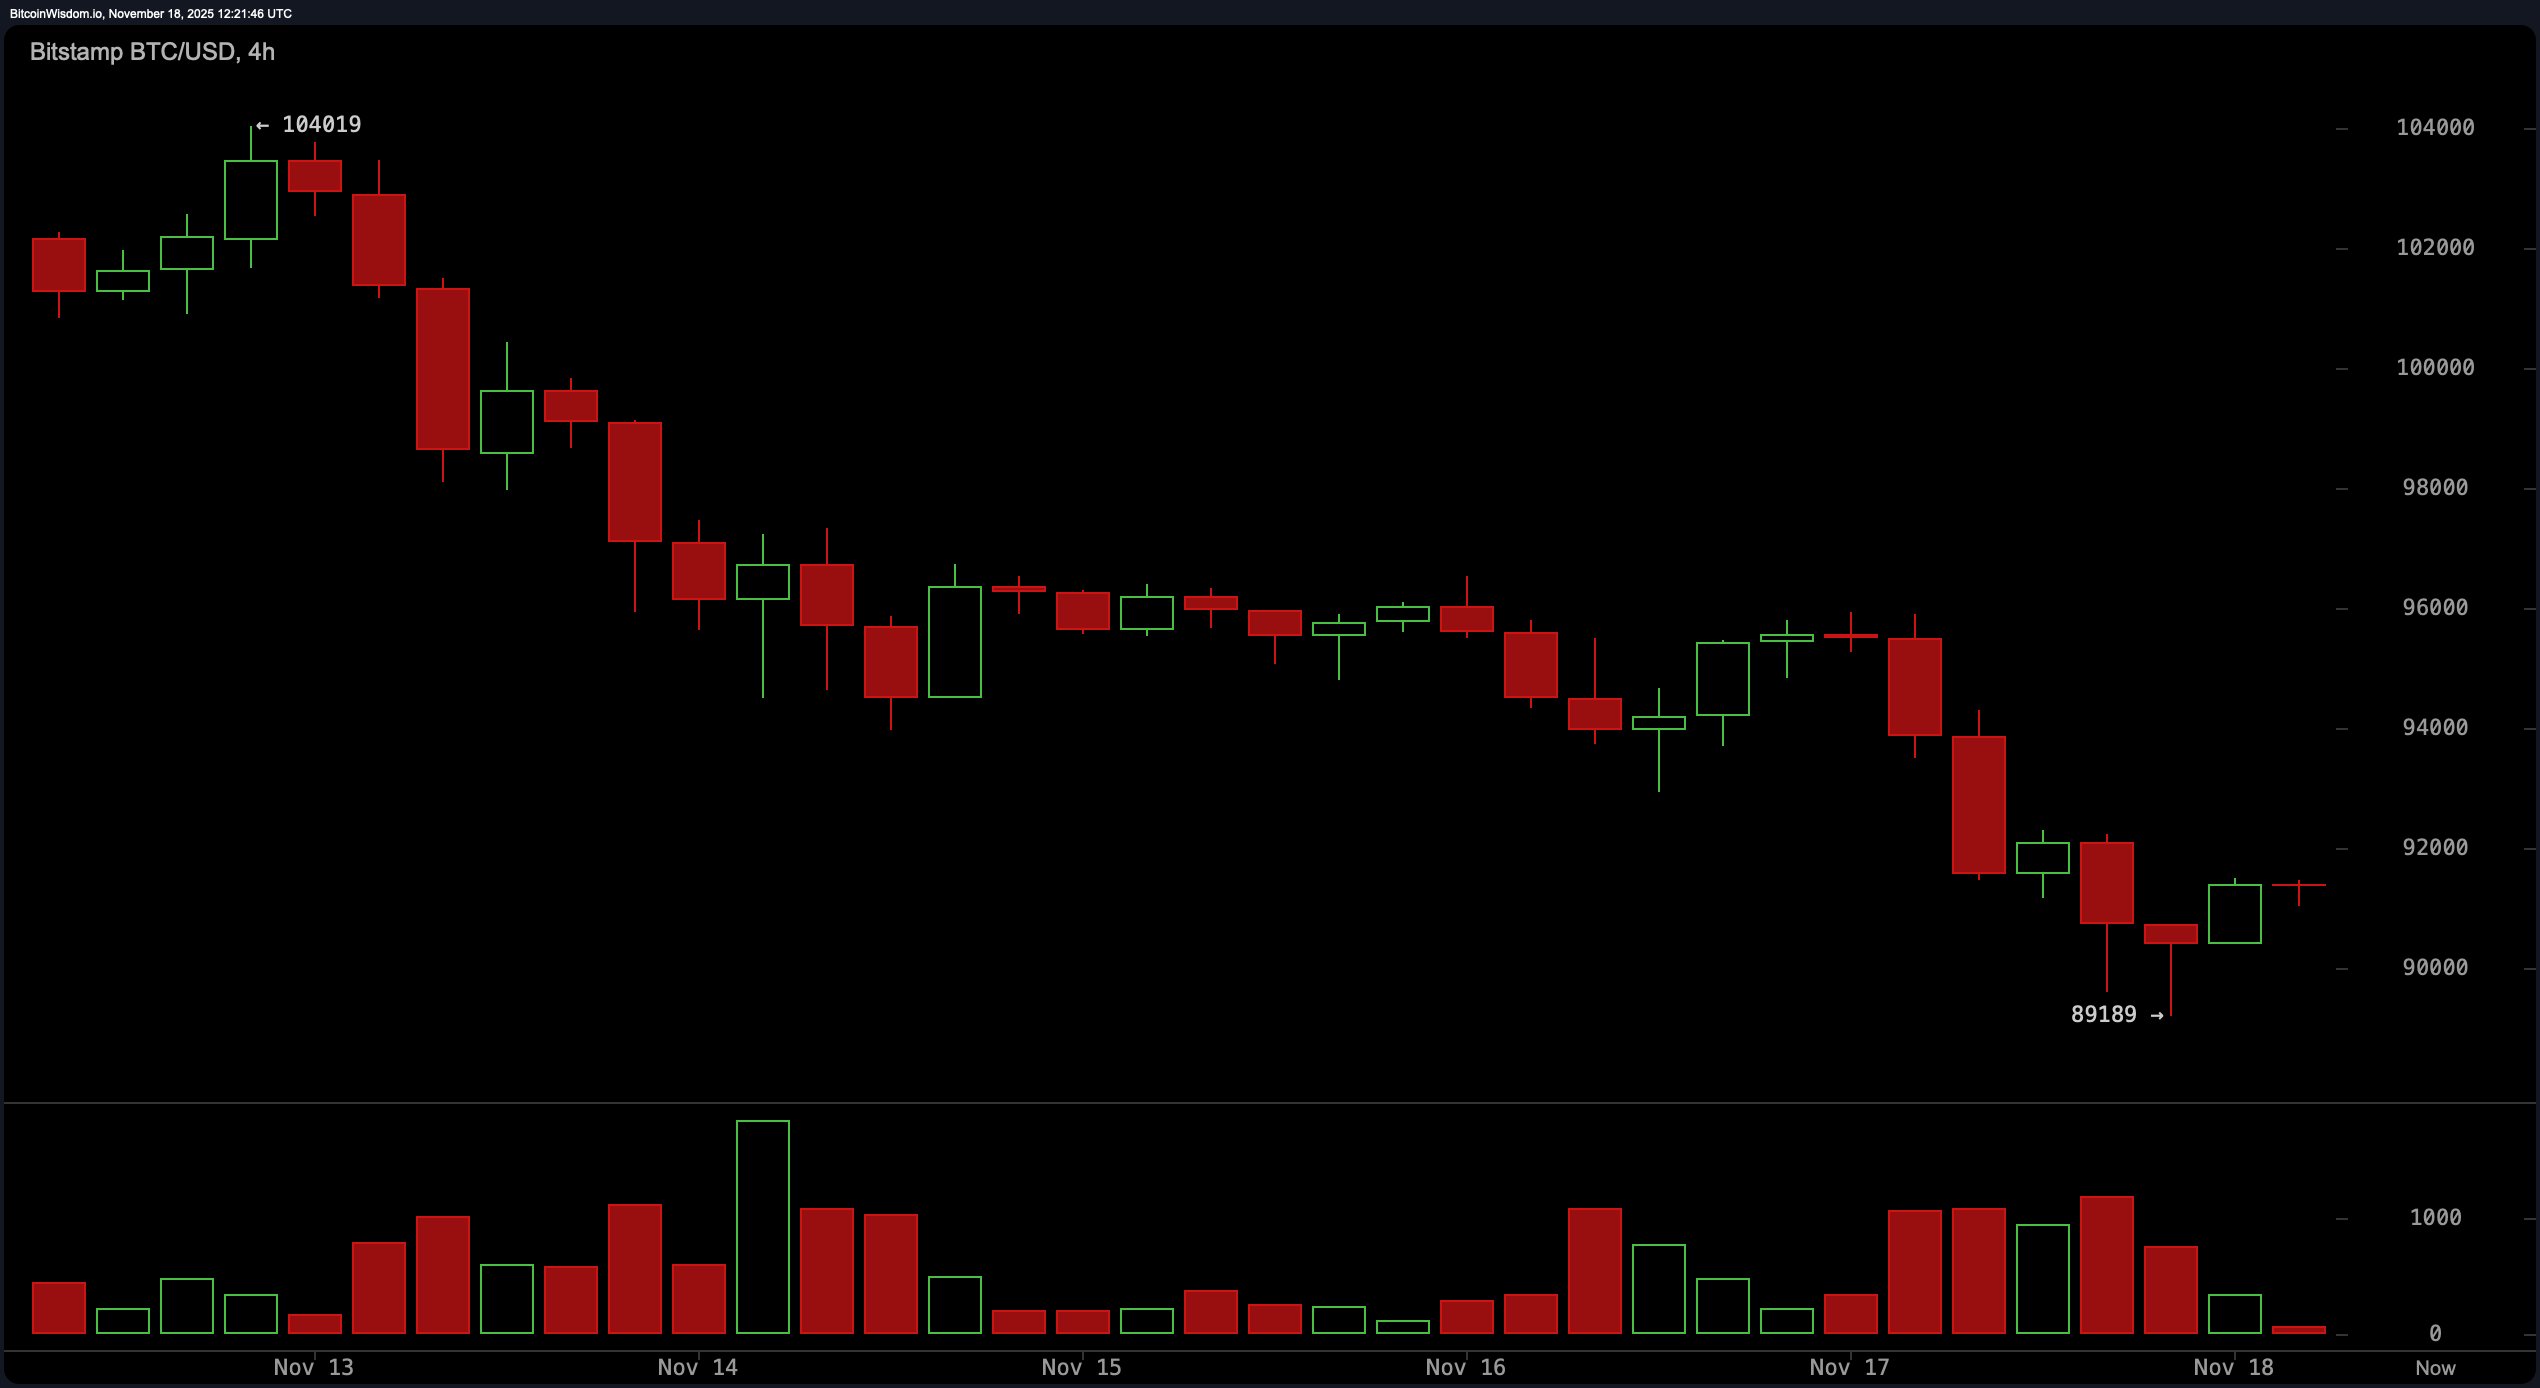
The 4-hour chart doesn’t pull any punches either. Bitcoin’s nosedive from $104,000 was met with only half-hearted consolidation attempts and one dramatic green candle, likely driven by short covering—not organic demand. Subsequent action has been textbook bear flag territory, followed by swift, sobering sell-offs. There is no sustained buying pressure here, and unless bitcoin can muscle its way past $92,000 with conviction, the charts are bracing for another slip, possibly down to $85,000 or even $83,000.

BTC/USD 4-hour chart via Bitstamp on Nov. 18, 2025.
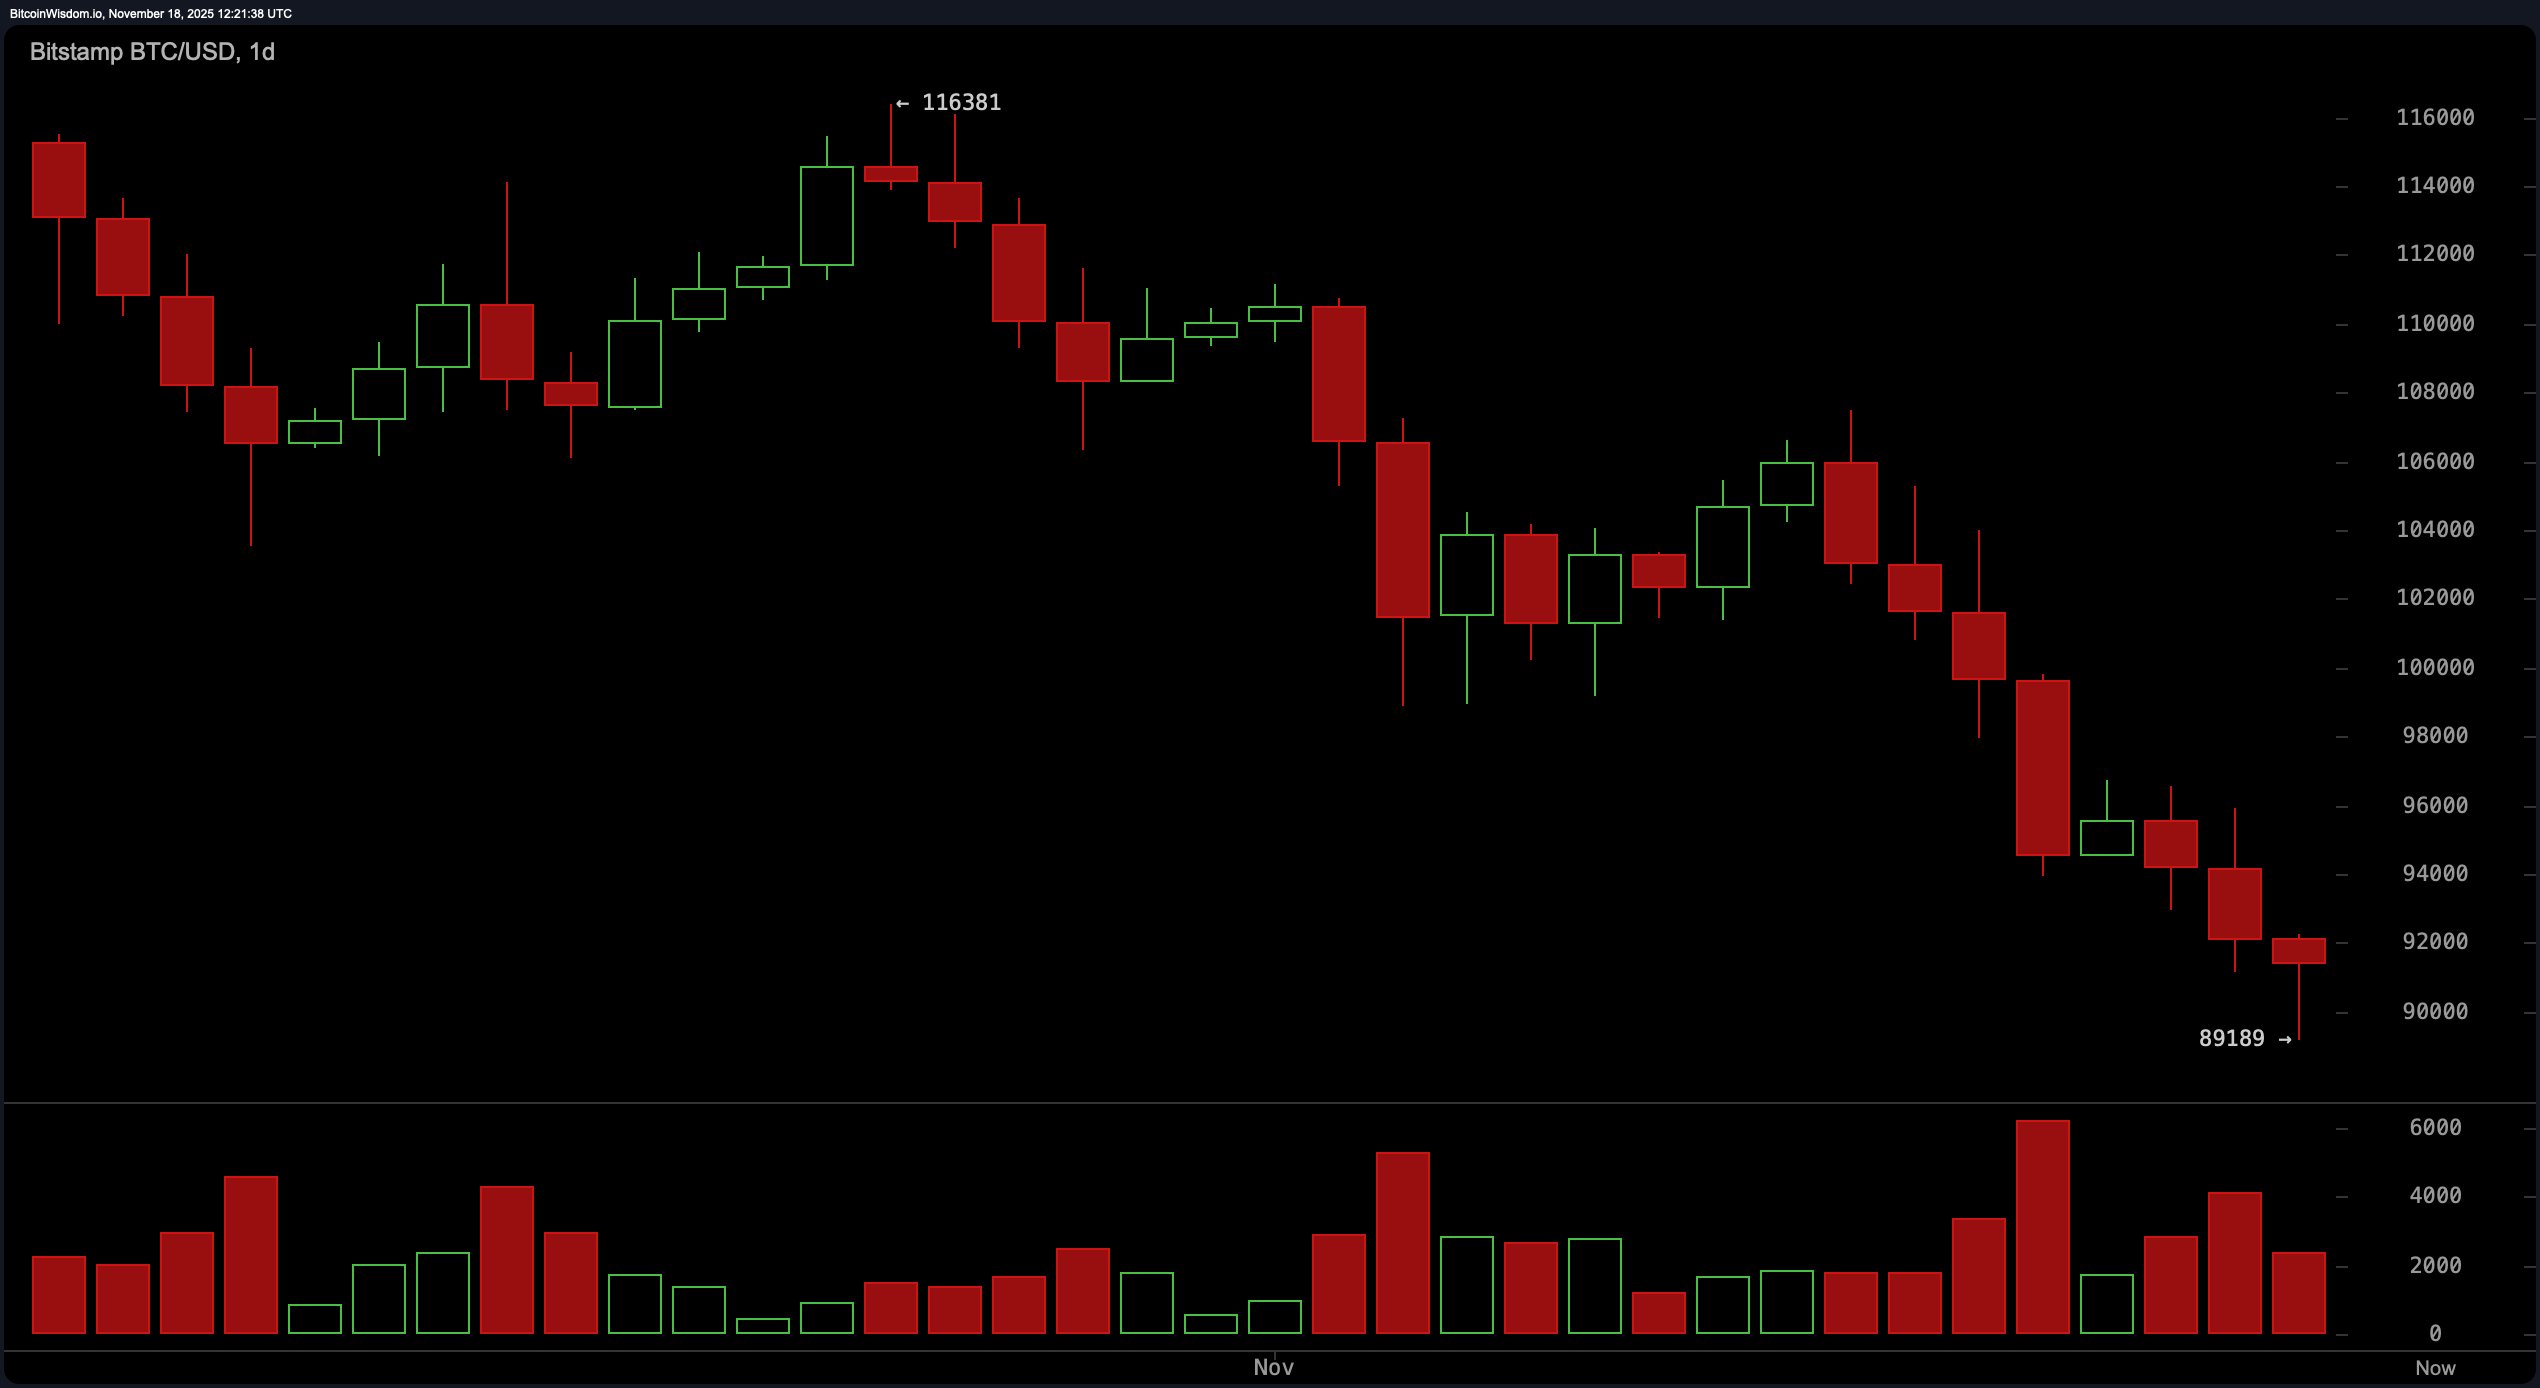
Zooming out to the daily chart reveals a dismal parade of lower highs and lower lows, capped by a failed attempt to reclaim the psychological $100,000 level. The current small-bodied red candle, resting just above the $89,000 support, screams indecision—not inspiration. Volume surges on down days suggest distribution, not accumulation. And with no bullish reversal patterns or meaningful divergence in sight, the bears are still very much calling the shots.

BTC/USD daily chart via Bitstamp on Nov. 18, 2025.
Technical indicators are hardly throwing a lifeline either. Among the oscillators, the relative strength index (RSI) languishes at 28, reflecting oversold conditions—but no decisive reversal. The stochastic oscillator at 8 and momentum at -10,959 offer a faint glimmer, but the moving average convergence divergence (MACD) level at -4,582 firmly disagrees. Average directional index (ADX) at 36 signals trend strength, but doesn’t care which direction the trend heads. In this case, the trend is not bitcoin’s friend.
The moving averages are a symphony of bearish dissonance. Every key marker—from the exponential moving average (EMA) 10 at $96,898 to the simple moving average (SMA) 200 at $110,425—is stacked above the current price, a stairway to heaven that bitcoin seems to have tripped down. With all short- to long-term moving averages pointing south, any bullish case right now would need more than optimism—it would need a miracle wrapped in a catalyst with a bow of volume confirmation.
Bull Verdict:
If bitcoin manages to hold the $89,000 support and push decisively above $92,000 with strong volume, a short-term rebound toward $95,000 or even $98,000 isn’t off the table. But until buyers show they can reclaim ground with conviction, this is a bounce narrative looking for a backbone.
Bear Verdict:
Should bitcoin break below the $89,000 threshold with volume confirming the move, it opens the trapdoor to $85,000 or even lower. With every major moving average looming above and no momentum to speak of, the path of least resistance remains down—gravity is still winning.
- What is bitcoin’s current price today?
Bitcoin is trading at $91,200 as of November 18, 2025. - Is bitcoin in a bearish trend right now?
Yes, bitcoin is showing a clear short-term downtrend across all major timeframes. - What are the key support and resistance levels for bitcoin?
Key support is near $89,000, with resistance between $92,000 and $95,000. - Are technical indicators signaling a reversal for bitcoin?
Most indicators remain bearish, with little evidence of a strong reversal.
免责声明:本文章仅代表作者个人观点,不代表本平台的立场和观点。本文章仅供信息分享,不构成对任何人的任何投资建议。用户与作者之间的任何争议,与本平台无关。如网页中刊载的文章或图片涉及侵权,请提供相关的权利证明和身份证明发送邮件到support@aicoin.com,本平台相关工作人员将会进行核查。


