Yesterday we mentioned that there is a possibility of continued decline this week. Currently, we have seen two days of decline, which aligns with our previous expectations. The market has now broken below the 90,000 mark, marking a significant victory for the bears.
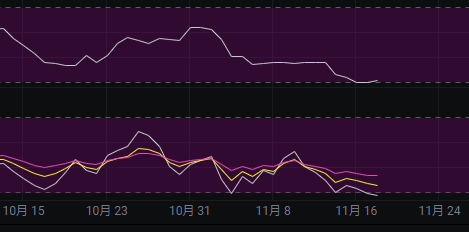
From the MACD perspective, the energy bars continue to move downward, and both the fast and slow lines are under pressure. Overall, it still shows a bearish trend, so there is no need to look for bullish opportunities here.
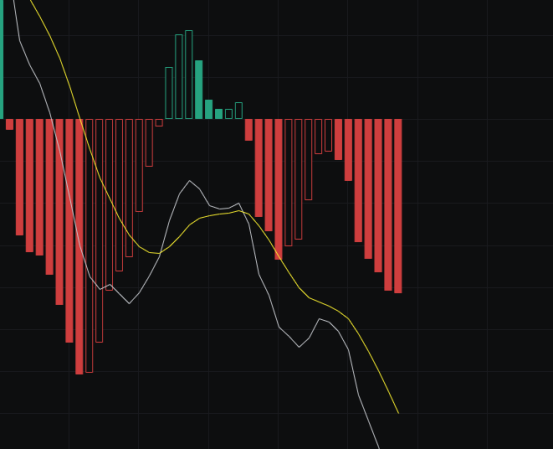
Looking at the CCI, it continues to decline and is far from -100. The CCI also indicates a bearish trend, so we maintain a bearish outlook.
From the OBV perspective, there has been a continuous large outflow, and there are no signs of a stop in the decline, so we also maintain a bearish view on the OBV.
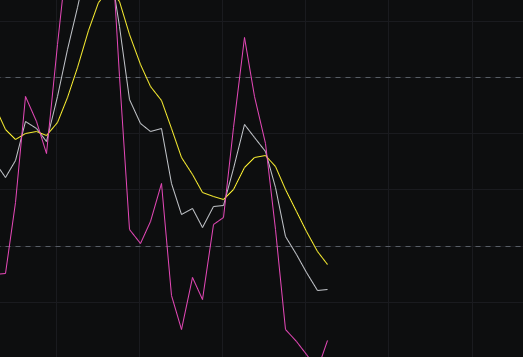
In terms of KDJ, it has dropped below 20 and is currently moving sideways. There are signs of a potential stop in the decline on the KDJ, but we need a few more days of market movement to confirm this.
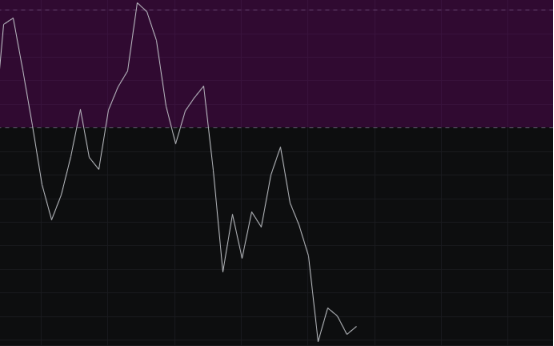
Looking at the MFI and RSI, both indicators are in a weak zone, with the RSI already in the oversold area. If the RSI continues to hover in the oversold zone, the market is likely to experience a continuous downward trend.
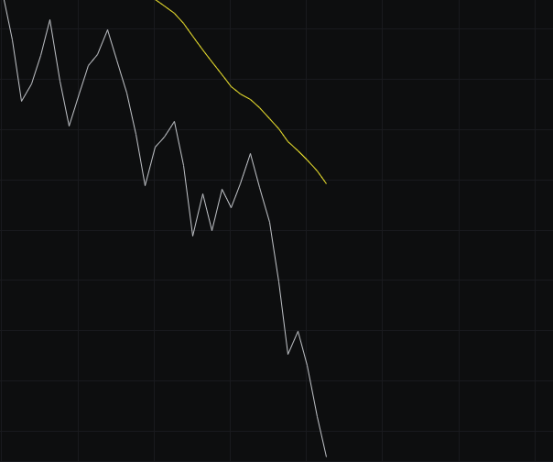
From the moving averages perspective, several moving averages are under pressure, indicating a bearish trend. However, the candlestick pattern has formed a long lower shadow, which theoretically suggests signs of a stop in the decline. Yet, lower shadows in a trend generally lack reference value, especially since we have not yet closed the line.
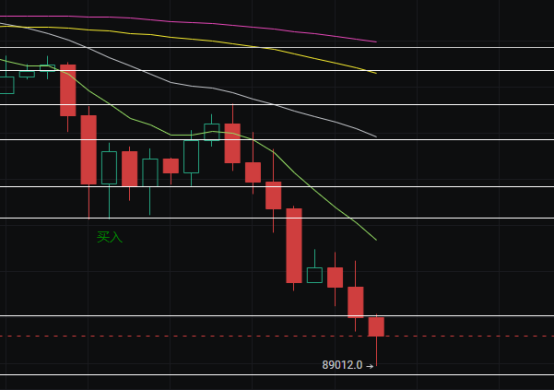
Looking at the Bollinger Bands, they are currently maintaining a downward channel, and the price is moving along the lower band. The overall pattern still indicates a bearish trend, so we continue to maintain a bearish outlook.
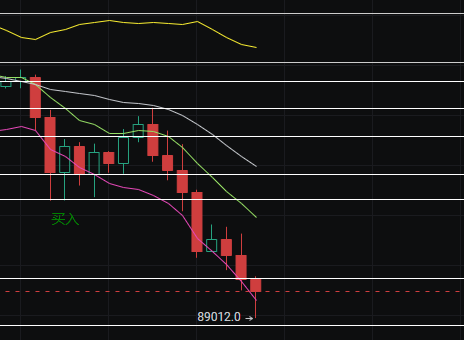
In summary: Today, the price has broken down below 90,000, marking a significant victory for the bears. Additionally, all indicators are trending towards a bearish outlook, so we continue to maintain a bearish view. Today's resistance is seen at 92,500-93,500, and support is at 90,000-88,500.
免责声明:本文章仅代表作者个人观点,不代表本平台的立场和观点。本文章仅供信息分享,不构成对任何人的任何投资建议。用户与作者之间的任何争议,与本平台无关。如网页中刊载的文章或图片涉及侵权,请提供相关的权利证明和身份证明发送邮件到support@aicoin.com,本平台相关工作人员将会进行核查。