Original Title: "Deconstructing DAT: Building In-Depth Analysis Beyond mNAV"
Original Authors: @sui414, @0xallyzach, @cosmo_jiang, Pantera Capital
Original Compilation: @kokii_eth
Abstract
• 80/20 Dichotomy: The DAT industry exhibits a power-law distribution, with leading projects in each category capturing the vast majority of market share, while long-tail projects struggle to survive. Despite the existence of bubbles, DATs based on real assets and differentiated treasury strategies still represent significant financial innovation.
• Divergence of Value and Sentiment: mNAV often obscures long-term value drivers. Our growth-driven decomposition model separates fundamental compounding growth from market sentiment. Data shows that companies like BMNR and HSDT continue to see per-share value growth, while the decline in most DAT stock prices is primarily due to sentiment contraction, not fundamental deterioration.
• Fragile Flywheel Effect: DATs rely on a reflexive capital cycle—issuing stock to grow the treasury when at a premium, and defending per-share value when at a discount. This is particularly challenging in a declining market. Companies like Bitmine manage prudently, while some aggressive issuances by other firms lead to dilution, harming long-term sustainability.
• Dual Assessment Framework: A complete evaluation must focus on 1. Fundamental value growth independent of sentiment; 2. Issuance and treasury management—whether management responds responsibly to market conditions. Together, these determine whether DATs are creating or eroding value.
• Data Infrastructure Gap: The industry urgently needs structured comparable data, including establishing disclosure standards, enhancing transparency, and optimizing operational practices. Stronger data transparency will drive industry maturity and safeguard investors' right to information.
2025 marks the arrival of DAT Summer, as DATs like Bitmine (BMNR), Sharplink (SBET), and Solana Company (HSDT) enter the mainstream, rapidly expanding the field. Currently, the total market capitalization of the 30 BTC, ETH, and SOL DATs we track has reached $117 billion. However, following market shocks, the initial hype has begun to cool.
Despite ongoing market noise, most investors still evaluate DATs through the narrow lens of mNAV (Market Cap / Net Asset Value ratio), failing to understand the intrinsic mechanisms of their core value, treasury strategies, or issuance discipline.
To address this, we have compiled this report referencing the DAT dashboard constructed by our partner Pantera, aiming to promote discussion, clarify misunderstandings, and establish a more rigorous DAT assessment framework.
What are Digital Asset Treasuries (DATs)?
Digital Asset Treasuries (DATs) are one of the most intriguing financial experiments in today's public markets. They are publicly traded companies with a balance sheet primarily composed of digital assets, allowing investors to gain indirect exposure to risks associated with BTC, ETH, SOL, and other digital assets through the stock market. This means investors can trade in a regulated environment via traditional brokerage accounts, avoiding the complexities of on-chain platforms.
Unlike ETFs or trusts, DATs are operational companies rather than passive investment tools. They can directly hold, trade, or even stake digital assets, issue new shares, or raise funds, forming actively managed treasury tools whose value is linked to both the underlying digital assets and the company's capital management strategies.
A typical DAT starts as a small publicly listed company or newly listed vehicle (SAPC) holding digital assets, with its net asset value (NAV) reflecting the total fair value of its holdings, while market capitalization (MCAP) represents the stock market's pricing of the same asset exposure—often trading at a premium or discount due to market sentiment, liquidity, and management confidence.
Some DATs, like BTC's Strategy, have a business model centered on using equity financing to continuously increase target assets. Other DATs explore staking yields, derivative exposures, or diversified portfolios, layering returns on top of price exposure.
For investors, DATs serve as a bridge between traditional finance and on-chain assets:
• For retail and institutional investors, DATs provide regulatory clarity, broker accessibility, and compliance compatibility, allowing them to gain exposure to digital assets through familiar channels.
• For the crypto ecosystem, DATs create new channels for capital inflow, increasing the liquidity scarcity of underlying assets, supporting staking infrastructure, and deepening secondary market liquidity.
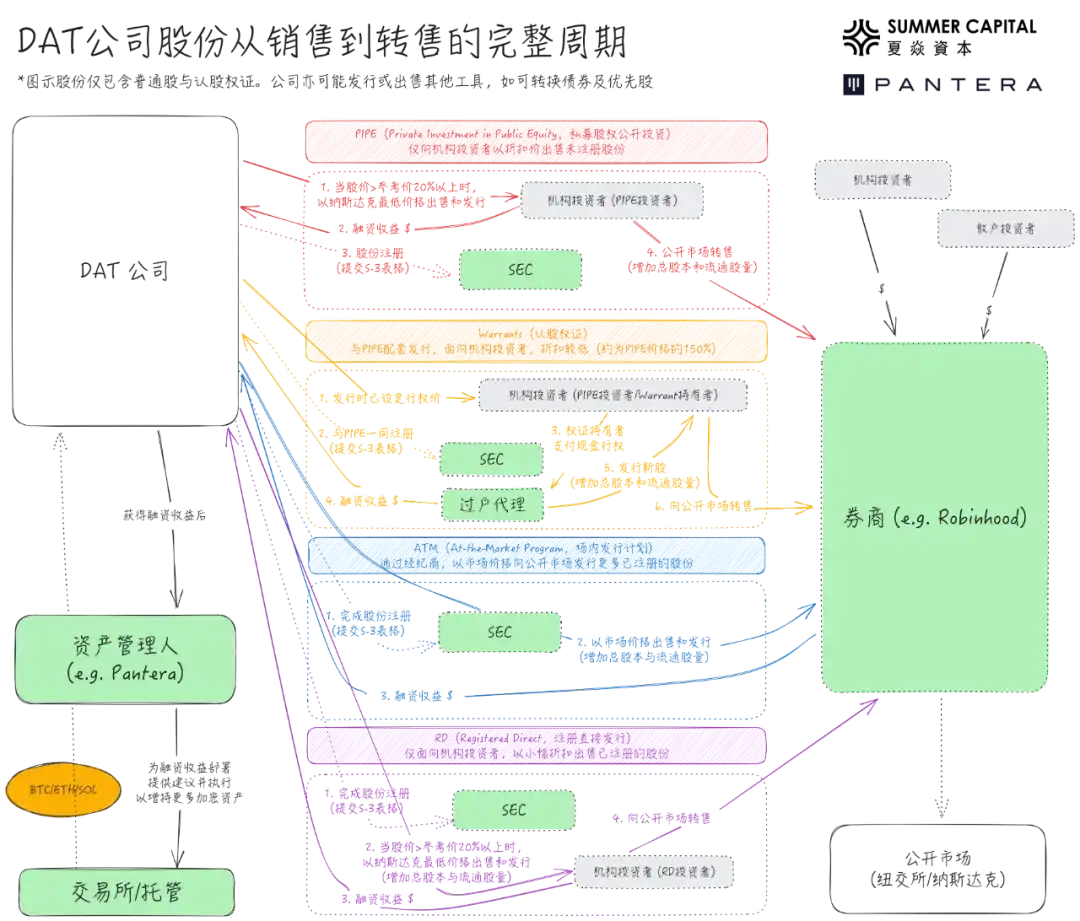
Many companies and institutions participate in DAT issuances through PIPE (Private Investment in Public Equity), with their investment logic based on the "positive flywheel" illustrated below:

However, there are many doubts about DATs in the market:
• This positive flywheel can easily be seen as an eternal bull market engine, but what happens when both mNAV and the prices of underlying digital assets decline?
• PIPE investors often set prices before DAT announcements (usually lower than retail), raising concerns about insider trading or harvesting retail investors.
• Trading above NAV is seen as problematic because retail investors are forced to pay a high premium; trading below NAV is also viewed as problematic because it requires selling assets to repurchase shares.
This article will analyze these doubts through data, clarify misunderstandings, explain the true meanings of various indicators, and share the methodology for evaluating DATs.
1. Core Indicator Analysis: mNAV and Its Limitations
Since March 2025, the total market capitalization of the 30 DATs we track has risen from $88 billion (primarily due to Strategy/MSTR) to approximately $117 billion, covering the three major digital assets: BTC, ETH, and SOL. However, market discussions still overly focus on the single metric of mNAV, neglecting its true meaning and other important indicators.
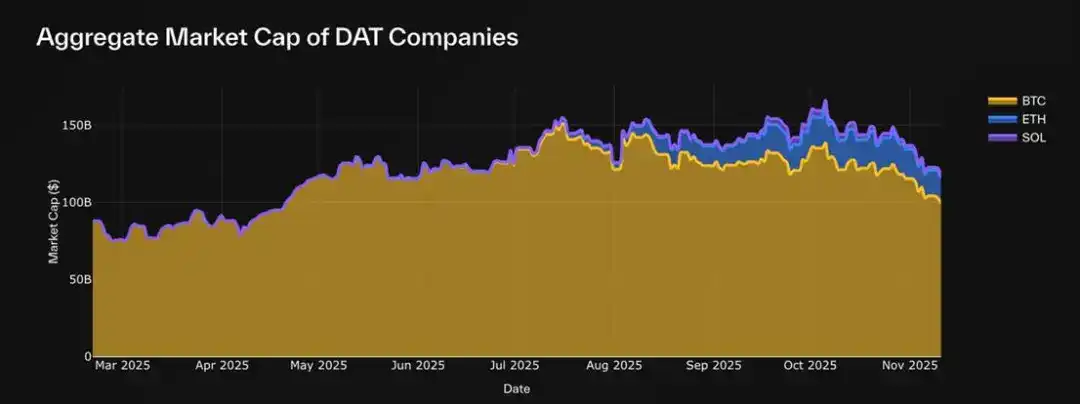
Market Capitalization Growth Trend of DAT Companies (Based on 30 Tracked Assets)
DATs are essentially publicly traded stocks, and their evaluation must focus on two key elements:
• Company Value (NAV/Net Asset Value): Reflects the true value of the company. For DATs, this refers to the total liquid assets held on the balance sheet—including digital assets and unallocated cash equivalents. The core value drivers for DATs are not traditional operating profits but rather the holding and growth of digital assets.
• Market Value (MCAP/Market Capitalization): The market's assessment of the company's value, calculated by multiplying the stock price by the total number of outstanding shares.
Net Asset Value (NAV)

NAV reflects the fundamental value of the assets held, but its specific composition varies by company. Some companies hold cash reserves, short-term government bonds, or other equities, while others hold convertible bonds or warrants, making NAV difficult to standardize. Existing data dashboards often use simplified formulas, with some extending to include debt and convertible instruments.
Multiple NAV (mNAV)
While NAV reflects the company's underlying assets, it does not capture the market's assessment of these assets. This is where market capitalization comes in: the real-time assessment of the company's value by the market.
The relationship between market capitalization and NAV provides the most closely watched metric in the DAT space: mNAV (Multiple NAV).
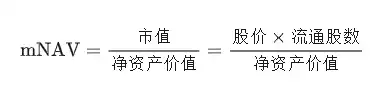
mNAV represents how much the market is willing to pay for each dollar of net asset value:
• mNAV > 1 → Indicates that the market has an optimistic view of the company's prospects or believes the company has growth potential. The market values the company higher than the assets on its balance sheet, often considering expected future per-share token growth.
• mNAV = 1 → Reflects a skeptical market attitude. Investors may be concerned about equity dilution, question management's discipline, or believe the company's digital asset exposure has not effectively translated into shareholder value.
Essentially, mNAV is an emotional multiplier built on fundamentals, revealing the market's belief in the ability of DATs to accumulate digital asset holdings.
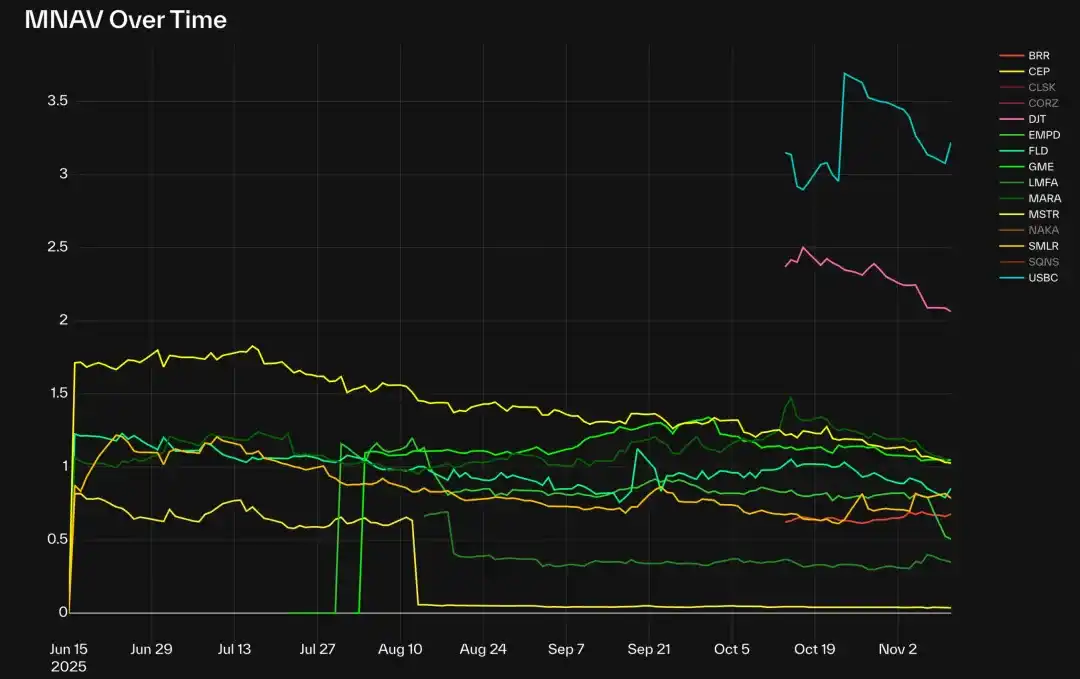
mNAV Multiples of BTC DATs (Excluding CLSK, CORZ, NAKA, and SGNS)
As of today, in the BTC DAT category, Strategy (MSTR), GME, and MARA are all close to 1.0 following recent market adjustments. However, most other BTC DATs have mNAVs below 1.0, with EMPD being the lowest at around 0.5.
Newly emerged DATs like DJT and USBC currently have mNAVs around 2-3, reflecting the speculative nature of early DATs. A few exceptions include CLSK at about 4 and CORZ close to 7, both AI data center companies (formerly BTC miners), indicating that despite overall market normalization, specific narratives or structural factors are still driving premiums.
The ETH DAT market is similar: BMNR, SBET, and GAME trade around 1x mNAV, reflecting fair value pricing; BTBT and COSM have higher multiples because these companies possess profitable business lines beyond their digital asset holdings, which the market may not view as pure DAT evaluations.
Among the Solana DATs with registered PIPE shares, only HSDT trades at a slight premium of 1.12x (as of November 12, 2025), while the others are slightly below 1, indicating that market trends are largely consistent with fundamentals, cooling from earlier cycles.
Premiums and Discounts
Premiums/Discounts are essentially another presentation of mNAV, measuring the market's trust or speculative degree regarding the company's treasury value, expressed in relative prices rather than multiples. High premiums indicate leverage, strong sentiment, or operational excess returns, while discounts typically reflect concerns about equity dilution or weak capital discipline.


The data dashboard shows extreme premium cases of about 800% for COSM, CORZ, and others, primarily due to the market valuing them based on existing core business valuations rather than their DAT attributes.
Per Share Digital Assets
Evaluating the intrinsic growth of DATs requires tracking both the amount of digital assets held and the number of outstanding shares. Healthy DATs aim to achieve growth in two metrics: increasing digital asset holdings to enhance the scale of underlying assets and issuing new shares to raise funds to support growth. Although issuing new shares dilutes existing shareholders' equity, if the growth rate of assets exceeds the rate of new share issuance, this dilution can actually yield benefits.
The key derived metric, per share digital assets, measures how much digital asset each share effectively represents, reflecting the extent of shareholder exposure. An increase in per share digital assets indicates that the funds raised from issuance are being used for asset growth rather than offsetting equity dilution.

Among the 30 tracked DATs, few companies have been able to maintain a stable upward trend in per share digital assets. Notable exceptions include Strategy (MSTR), BMNR, HSDT, ETHM, BTCS, CEP, and UPXI.
Experience shows that many DATs, even if they perform robustly in the early stages, can experience sharp equity dilution due to large issuances of new shares. In contrast, the aforementioned companies have maintained continuous growth without significant declines, indicating a more prudent strategy in balancing capital issuance and asset accumulation.
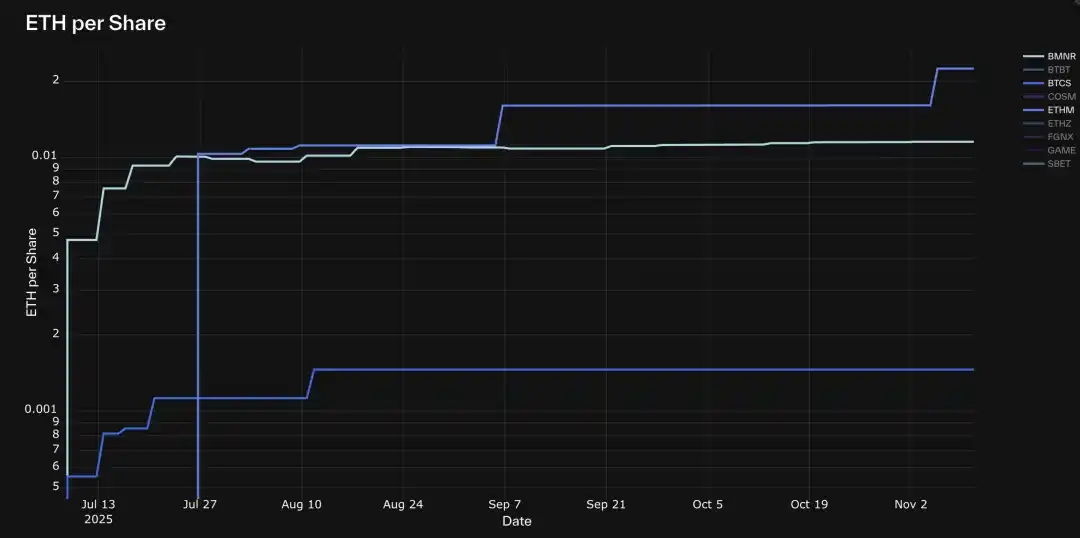
ETH DATs with Continuous Growth in Per Share Assets: BMNR, ETHM, BTCS
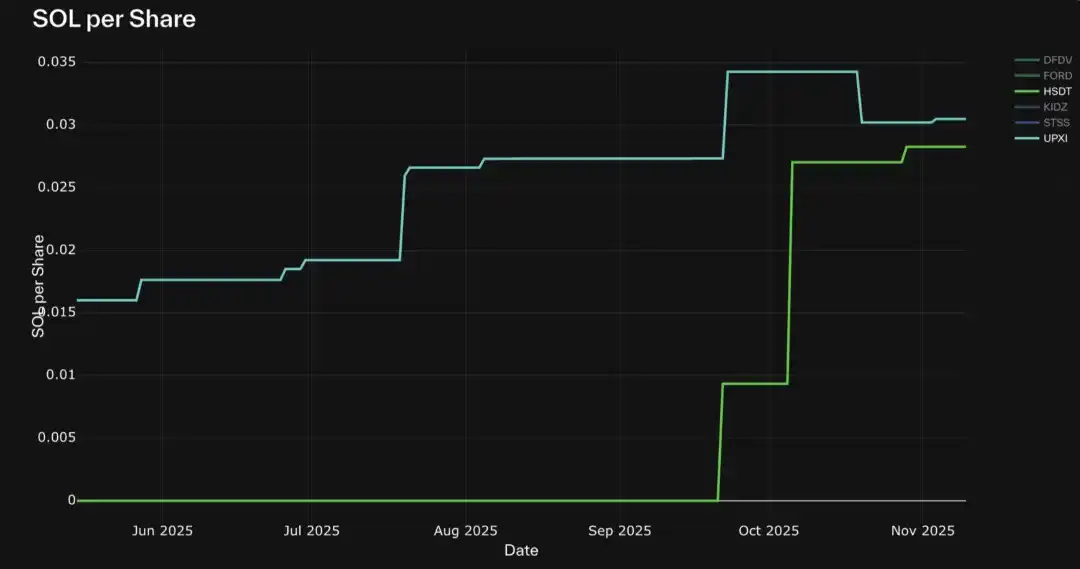
SOL DATs with Continuous Growth in Per Share Assets: HSDT, UPXI
Other Market Indicators
In addition to company-level metrics, several comparative indicators help measure the position of DATs within the broader ecosystem:
• Market Share (by NAV, Market Cap, or Trading Volume): Measures the relative dominance of different DATs across various digital assets. Since each DAT stock represents different underlying asset values, comparing raw trading volumes may be misleading; turnover rate (trading volume / market cap) more accurately measures liquidity and activity.
• Asset Supply Ratio %: The proportion of tokens held by DATs relative to the total supply, reflecting their systemic impact within the underlying ecosystem.
In the BTC DAT category, Strategy has a significant dominant position: holding 83.3% of the total BTC DAT holdings (accounting for 3.22% of total BTC supply), capturing 72% of the market cap in the category. GME and BRR have shown notable increases in trading volume share, reflecting heightened retail activity.
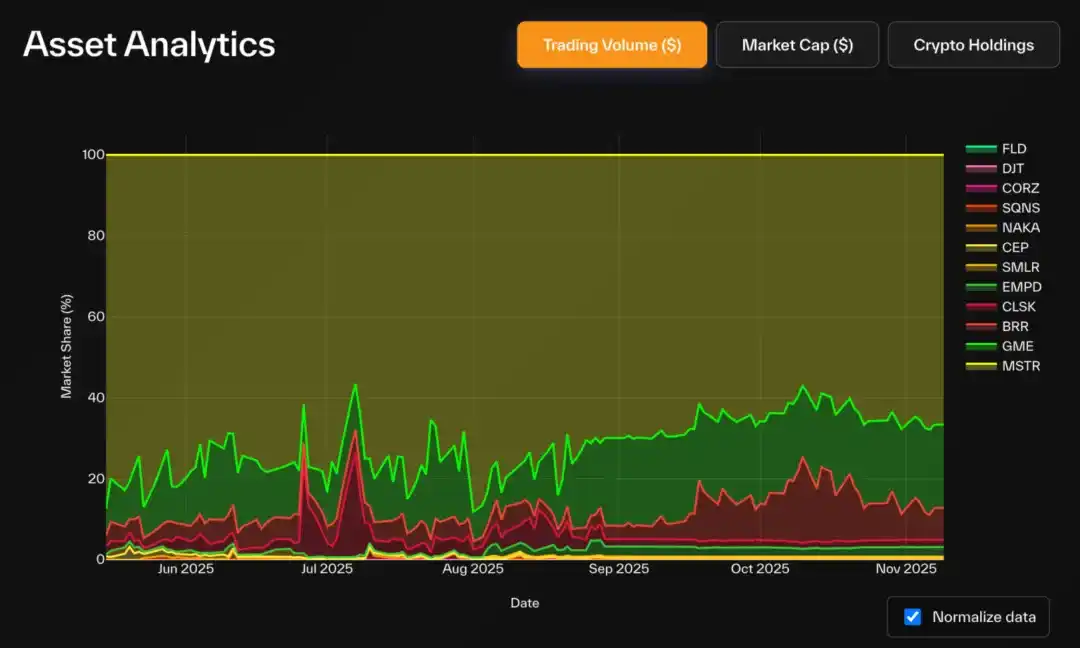
BTC DATs Trading Volume (USD) Market Share
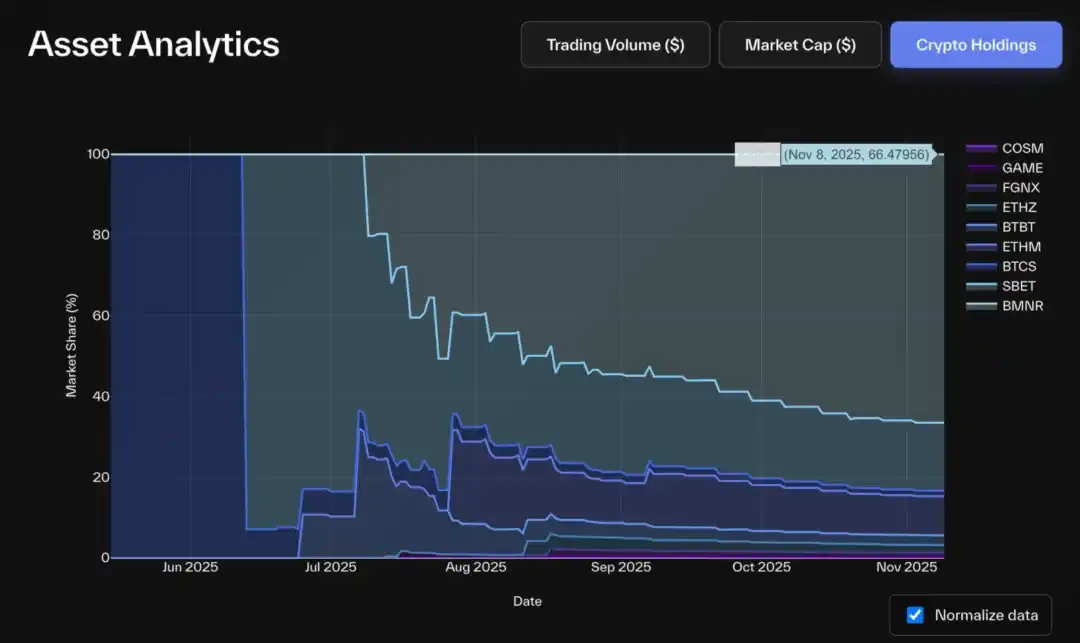
ETH DATs Crypto Asset Holdings Market Share
In the ETH DAT sector, Bitmine also leads: holding over 66% of the total ETH DAT holdings (approximately 2.9% of ETH supply), accounting for 68% of market cap and 85% of trading volume. The second-largest player, SBET, holds about 16-20% of ETH holdings and market cap, while BTBT ranks third (around 6%).
The Solana DAT market has a lower concentration: FORD leads with a market cap of 45% and SOL holdings of 44%. HSDT, DFDV, STSS, and UPXI each hold about 13-14% of the holdings, but Solana Company (HSDT) leads its peers with approximately 22% market cap share.
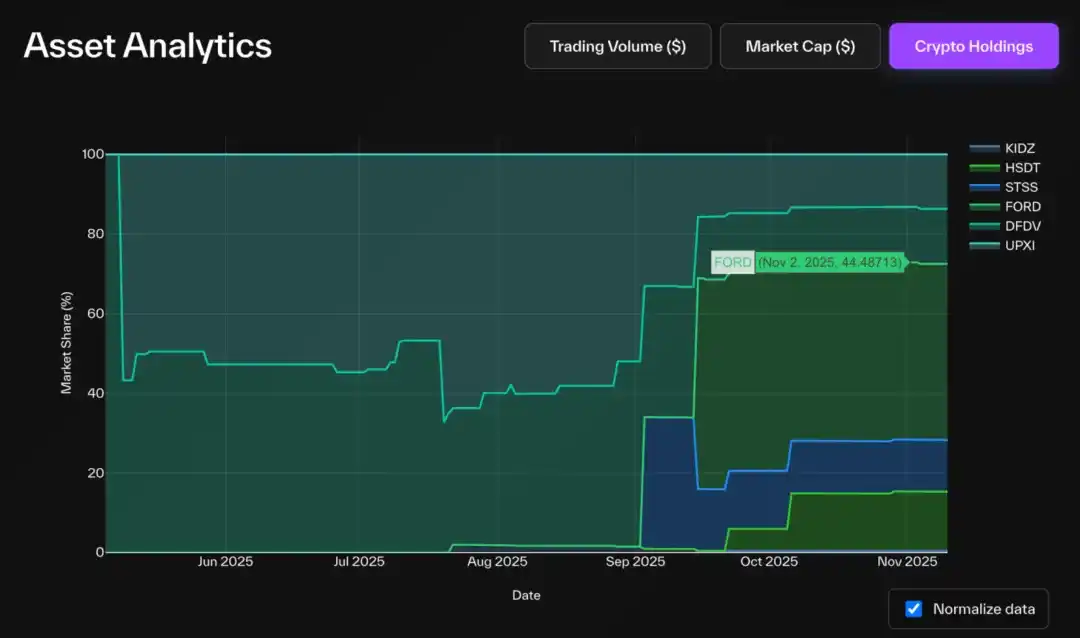
SOL DATs Crypto Asset Holdings Market Share
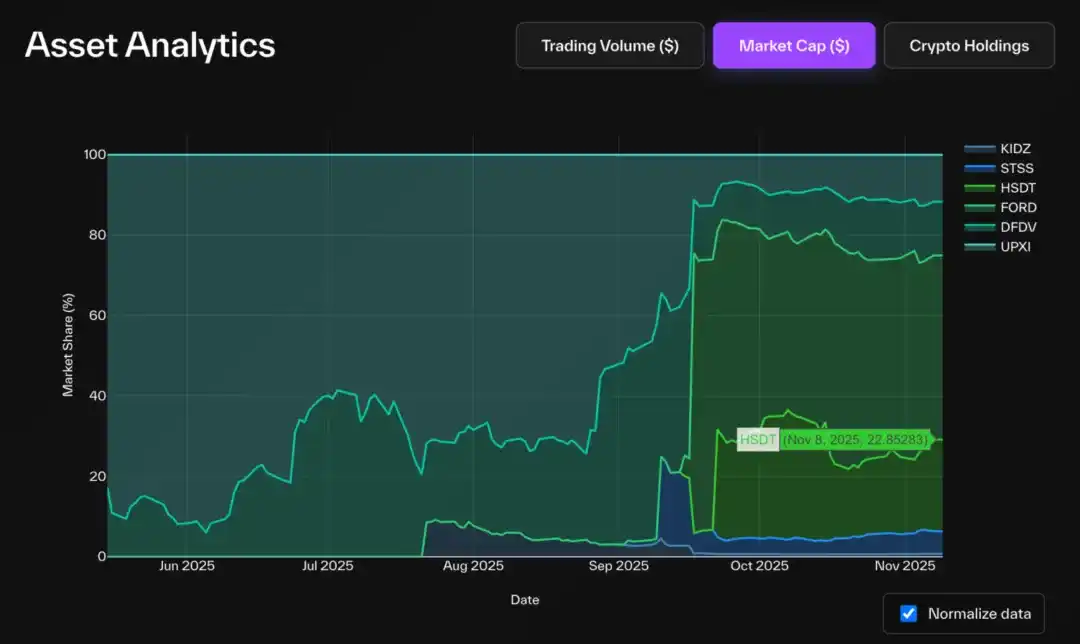
SOL DATs Market Cap Market Share
Interestingly, in terms of trading volume, the situation is reversed: DFDV and UPXI lead in activity over FORD. Historical trends indicate that these two are pioneers in the Solana DAT category, and this advantage seems to persist today, even though FORD later achieved a higher NAV; the trading momentum and market attention maintained by early entrants remain difficult to disrupt.
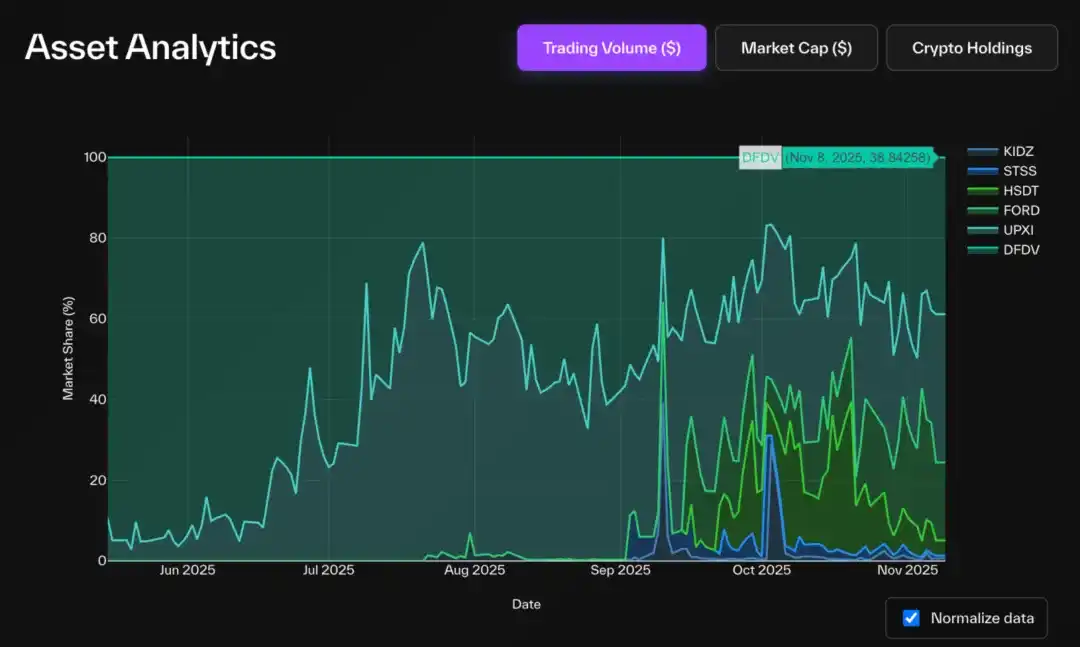
SOL DATs Trading Volume (USD) Market Share
2. Limitations and Misunderstandings
Although the definitions are simple, tracking these fundamental metrics is not easy—primarily because the data from SEC filings is neither real-time nor standardized like on-chain data.
The best format for balance sheet accounting comes from the 10-Q form, but it is only released quarterly. Many companies use custom-designed or branded PDF files, making extraction more difficult. Even when data is reported in the same format, it is often embedded in text files that require semantic parsing. Additionally, each company reports project formats differently, considering their equity structures and financial asset differences, which is understandable.
The sources for holding updates can be very fragmented—some companies do not even submit filings through the SEC but disclose changes via Twitter, press releases, or media interviews.
Nevertheless, most stock market metrics (such as price and trading volume) are relatively standardized. However, tracking the number of outstanding shares remains challenging—companies are not required to report daily through filings, and many data dashboards rely on third-party APIs that obtain data from market makers or banks, often with delays of several days.
One of the best practices comes from Bitmine, which reports its digital asset holdings weekly (sometimes more frequently) through 8-K filings.
When interpreting DAT data, it is essential to be aware of how these data challenges distort the metrics:
• Holding Updates
• Low frequency (monthly/quarterly) leads to outdated NAV, inflating mNAV or premiums
• Some DATs hold DeFi tokens, NFTs, other stocks, or semi-liquid assets, complicating asset valuation
• Share updates: Failure to submit large-scale issuance or repurchase filings will affect estimated market cap, mNAV, premiums/discounts, and per share digital assets.
We have identified some common blind spots in public reporting:
• Pro-Forma Accounting: Most data dashboards rely solely on reported outstanding shares, without considering the potential exercise of previously issued warrants. In PIPE transactions of DATs, warrants are often bundled with PIPE shares, and the exercise price is usually equal to or higher than the PIPE share price. At any time after the exercise date, as long as the stock trading price is above that level, the warrants can be exercised—this is a reasonable action for holders. Since exercised warrants increase the number of outstanding shares but do not necessarily increase corresponding value, they have a significant dilutive effect on key metrics. Including these unexercised warrants in simulated calculations can more accurately reflect potential dilution effects and the true risk exposure of shareholders.
• Prefunded Warrants: These warrants have already received proceeds and are included in NAV, but the corresponding shares have not yet been issued. In many cases, the exercise price of these warrants is close to zero, meaning that once exercised, the number of shares will increase without new proceeds—resulting in a one-sided impact on equity dilution. We believe these warrants should be included in outstanding shares; otherwise, the resulting mNAV calculations will underestimate market cap while overestimating NAV, creating an imbalance.
• Pending Mergers and PIPE: When a company announces a new PIPE, cash proceeds are typically reflected in the NAV update before the shares are officially issued through an S-3 filing. If share adjustments are not made, the per share NAV denominator is underestimated, artificially inflating that metric. The following diagram summarizes the main types of share issuance plans and their impact on outstanding shares.
Debt Data and Derivative Exposure: With the exception of Artemis, very few data dashboards currently include information on debt liabilities or leverage exposure. This omission distorts NAV, especially for DATs that employ structured yield or staking strategies.
After considering debt, adjusted NAV (and adjusted mNAV) should reflect the true book value. This allows for a clear comparison between pure treasury exposure DATs (like MSTR) and mixed operational DATs (like BMNR or SBET). What role does debt play in DAT management? In traditional finance, companies issue debt to finance growth while protecting shareholder ownership. The motivation is similar in the DAT space. Equity issuance means selling future earnings to new shareholders, diluting existing shareholders' equity. In contrast, debt issuance means borrowing against existing assets without causing equity dilution (if managed properly). Therefore, DATs utilize debt to expand on-chain asset scales without reducing per share digital asset value.
Due to these complexities, Pantera has constructed the DAT dashboard—aiming to present a clearer and more in-depth overview. In addition to data cleaning and standardization, the goal is to advance the dialogue: comparing DATs with the broader stock market, not just within their own category; and advocating for higher on-chain transparency by tracking treasury wallets, yield generation, and other on-chain activities in future versions.
3. Choosing the Right Metrics
mNAV alone cannot comprehensively reflect DAT performance. Below is our summary of the most valuable analytical framework for a comprehensive assessment of DAT performance.
Growth Drivers and Fundamental Pricing
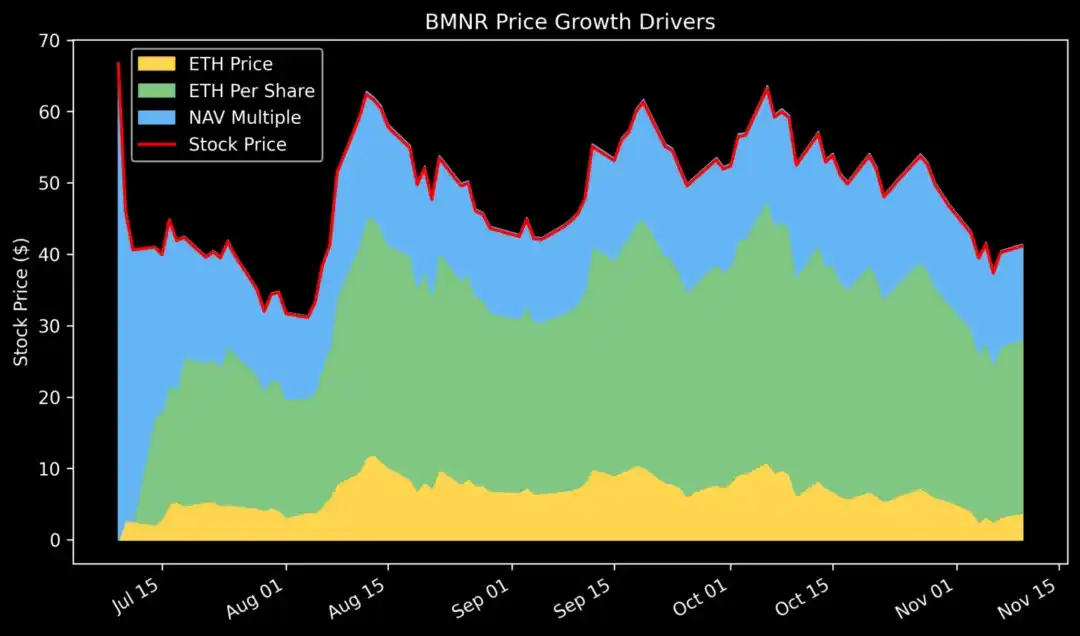
If we view the stock price of DAT companies as a product of several potential growth factors (per share token growth, token price, and market sentiment), we can break it down to see the true drivers of performance rather than mere narratives.
Formally, we can express the stock price at time t as:
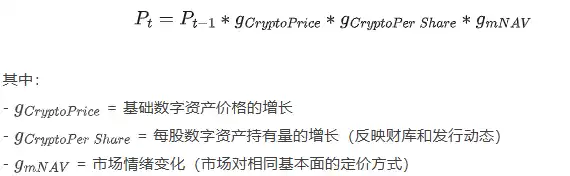
This decomposition method allows us to isolate each factor and independently track the true drivers of price fluctuations:
• When the stock price declines, we can examine whether this is due to a cooling of market sentiment, a drop in the price of underlying assets, or a deterioration in the company's fundamentals—conversely, which of these factors drove the stock price up.
• It also helps us see through the noise—for example, when a company's intrinsic value continues to grow while the market price declines.
When we decompose the price growth of Bitmine (BMNR), we find that since its launch, the per share ETH has steadily increased, while mNAV (sentiment multiple) has significantly contracted. This indicates that its fundamentals remain strong, with only the market hype cooling down.
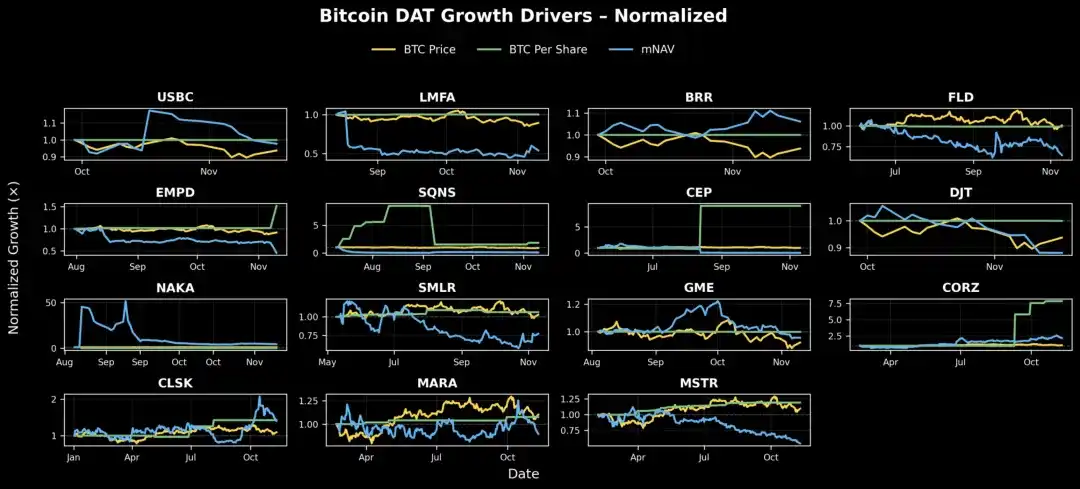
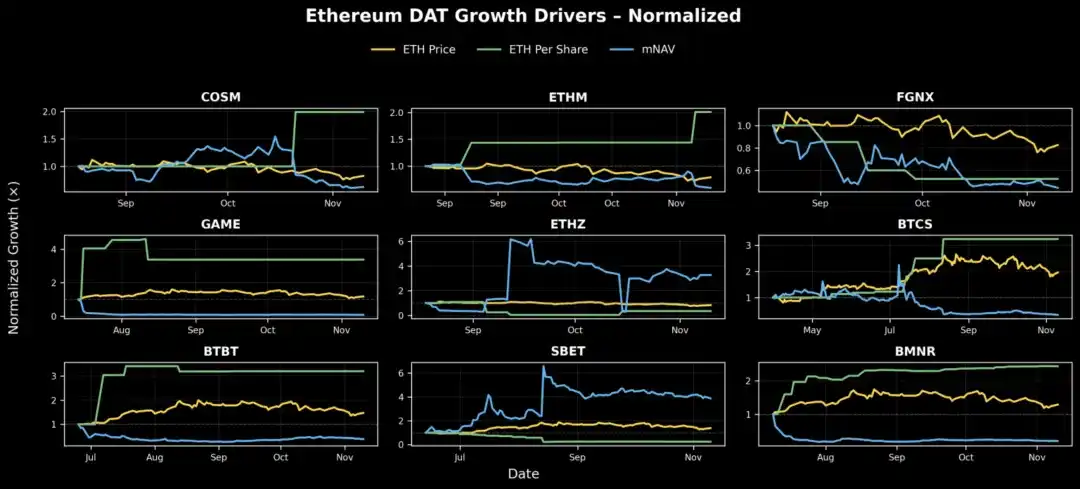
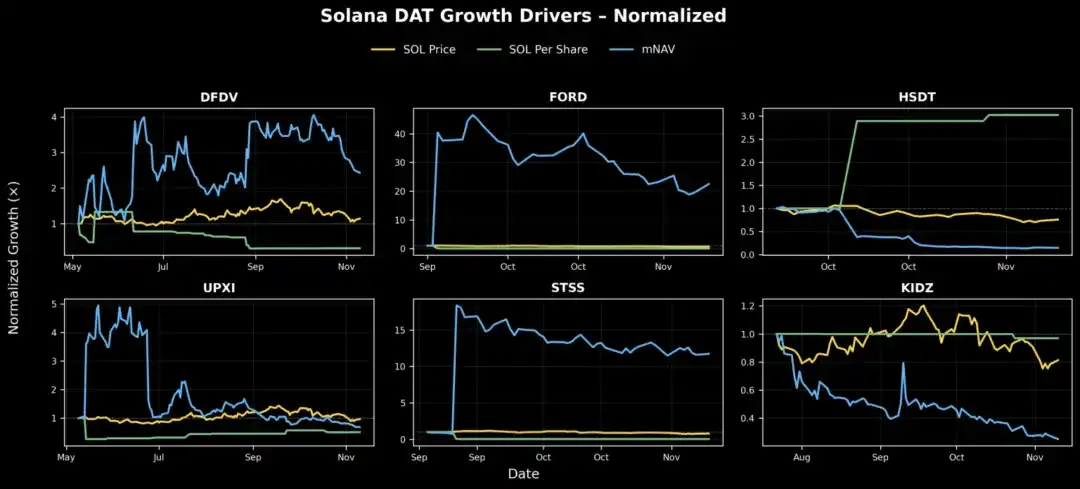
Summarizing this framework into three growth factors, we can chart DAT companies by category to assess their overall health:
BTC DAT: Most fundamental value growth is relatively stable, with companies like MSTR, CLSK, and CEP showing a clear upward trend. In contrast, although SMLR, FLD, DJT, LMFA, and EMPD have stable fundamentals, market sentiment for these companies has sharply declined since tracking began, which is the main reason for their stock price drop. The only DAT that has shown an actual decline in value is SQNS.
ETH DAT: As category pioneers, ETHZ and SBET benefited from an initial rise in market sentiment, even though per share ETH remained relatively stable. Subsequently, BMNR, ETHM, BTCS, BTBT, and GAME have all seen steady growth in per share value, despite their mNAV growth showing a downward trend—possibly indicating that they launched near the top of the market cycle. FGNX is an exception, experiencing severe equity dilution and a sharp decline in market sentiment, leading to significantly underperforming expectations.
SOL DAT: HSDT has shown the most significant growth in per share SOL, tripling from October to the report's release; UPXI has also grown steadily, but on a smaller scale. DFDV benefited from rising market sentiment, but its per share SOL declined during the same period, indicating that the increase was driven more by market sentiment than by fundamentals. Meanwhile, both FORD and STSS saw significant expansions in mNAV, but their fundamental value growth remained flat, indicating that performance was driven by market sentiment rather than balance sheet strength.
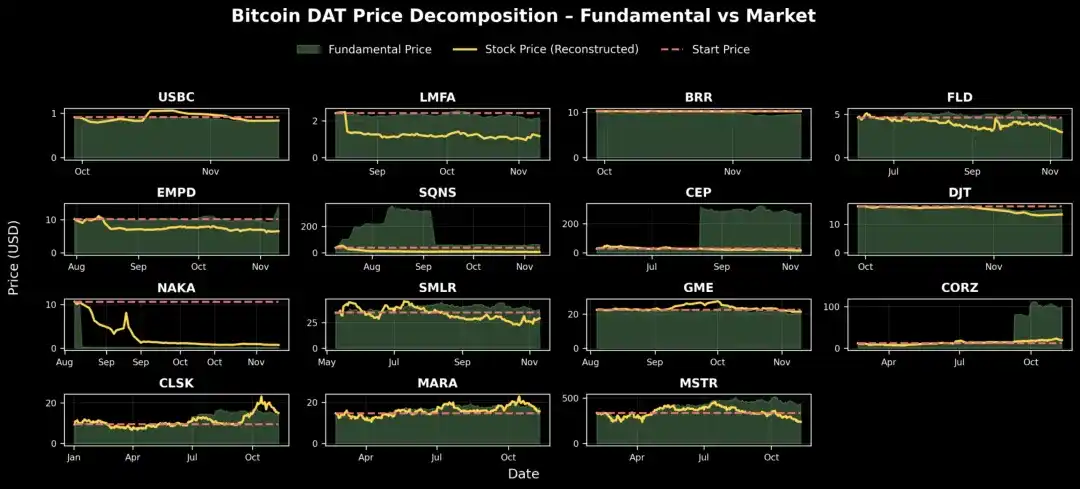
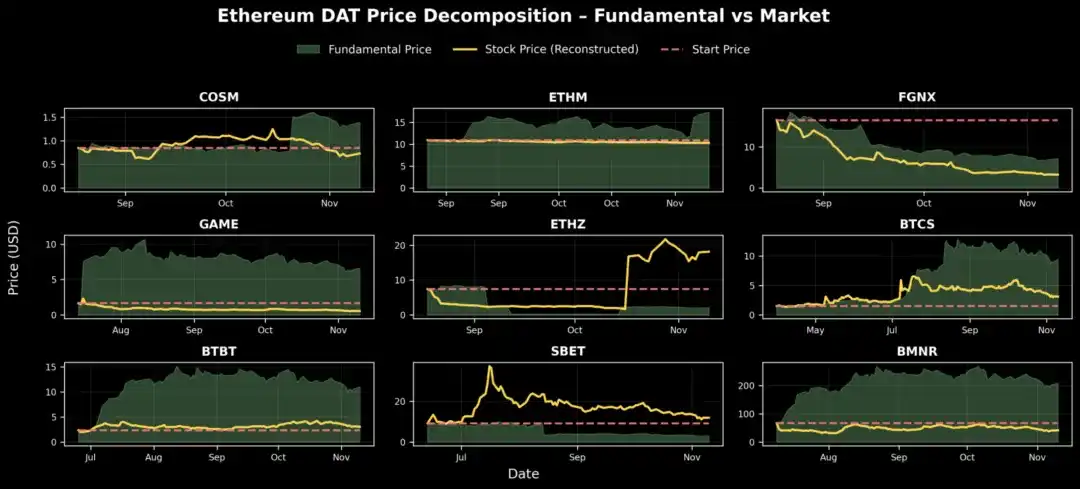
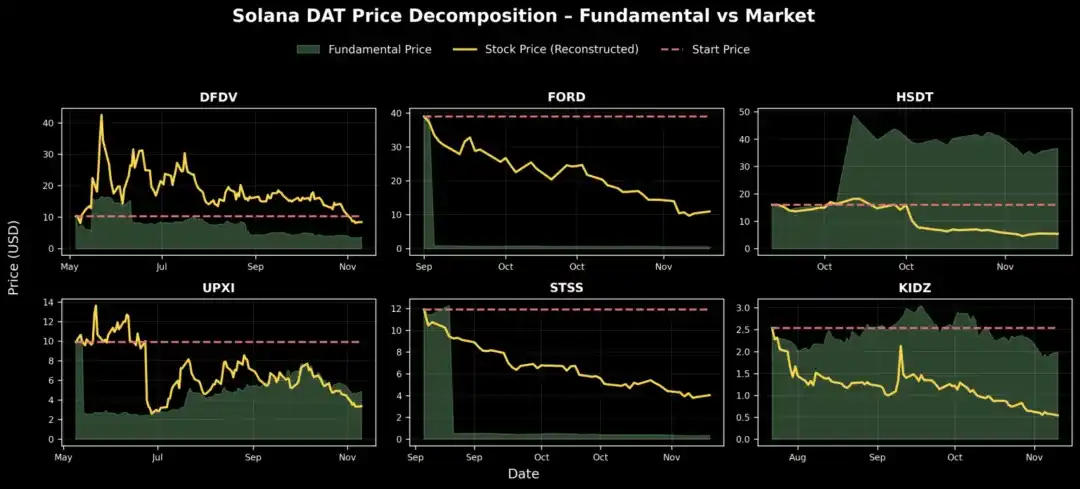
Fundamental Pricing
As shown in the above chart, most DAT companies have experienced a phase of market cooling or contraction since their launch. To understand their potential development trajectory, we can further reconstruct each company's theoretical fundamental price—essentially answering the question: "If market conditions were the same as on the day of the DAT's launch, what would today's stock price be?"
In other words, if you had held one share of stock since the company's inception and allowed the company to gradually accumulate inventory and issue shares over time, what would the actual value of that share be today?
The following chart shows that several DAT companies—HSDT, BMNR, BTBT, BTCS, CORZ, and CEP—have steadily increased their fundamental value, but their stock prices have not fully reflected this due to changes in the market environment. Since their establishment, these companies' fundamental metrics have significantly grown, even as overall market sentiment has contracted.
Share Issuance and Dilution
The success or failure of DAT companies depends on their discipline in equity issuance. A key dimension in evaluating DAT companies is how management responds to market conditions—whether they take strategic actions when market sentiment changes or respond passively.
• When mNAV > 1: The company has the opportunity to issue shares at a premium. The key issue is issuance discipline; overly aggressive issuance will erode per share digital assets, depress per share NAV, and ultimately destroy market sentiment. Disciplined issuers responsibly expand their issuance scale, while reckless issuers engage in what is known as the "infinite ATM game."
• When mNAV < 1: The challenges are greater. A valuation multiple below 1 indicates a lack of market confidence in the company's capital discipline, liquidity, or funding management strategy. The market may price in expectations of future equity dilution, fearing that management will continue to issue shares during periods of low market sentiment. This may also indicate inefficient capital use, where the company fails to convert its digital asset exposure into shareholder value.
Sustained mNAV below 1 will break the DAT flywheel effect. The company can no longer issue new shares at a premium without diluting existing shareholders' equity. If forced to issue, per share digital assets will further decline, damaging trust and losing the ability to use equity as a growth tool. Over time, this dynamic may cause the company to become a "zombie DAT": a static holding company with a trading price below its liquidation value.
When mNAV falls below 1, the correct approach is to take defensive measures and restore credibility: stop all equity issuances (including ATM and PIPE) and make protecting per share digital assets a core metric. The company must also enhance transparency and financial reporting—issuing wallet proofs, dashboards, and regularly updated NAV to demonstrate that it is a clean, verifiable financial package rather than an opaque shell. If liquidity allows, repurchasing shares at a price below NAV can increase earnings and send a strong confidence signal, often restoring premium levels. Management can also leverage on-chain yields—staking ETH, participating in re-staking, or earning from financial assets—to naturally enhance NAV growth and convert passive asset holdings into income sources. Finally, the company must strengthen its narrative, positioning itself as a clear and reliable representative of specific assets or ecosystems, as investor trust often returns when investment ideas are clear.
For DATs with mNAV < 1, the correct strategy is to protect per share value, enhance transparency, and rebuild trust. By studying issuance data, stock repurchases, and funding management behaviors, we can understand which companies choose value-added paths and which continue to dilute equity.
Data shows that the best-managed DATs have historically been able to protect shareholder leverage during economic downturns—laying the groundwork for rebounds when market sentiment recovers.
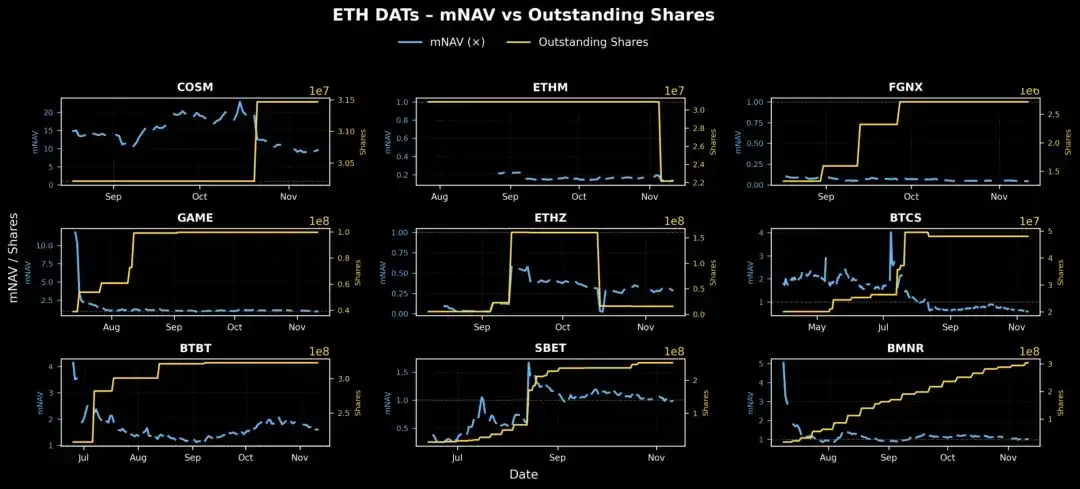
From the above chart, it is evident that ETH DATs exhibit significant differences in equity issuance and market sentiment management. Most companies show a gradual increase in the number of outstanding shares—indicating possible PIPE or ATM issuances.
BMNR's data shows that the company's stock issuance and mNAV change patterns are more gradual compared to its peers. This sets a benchmark for how the company can responsibly scale—using equity as a growth tool without disrupting the mNAV growth flywheel.
BTBT, GAME, and BTCS have seen sharp, sudden increases in the number of outstanding shares, while mNAV remains stable or declines, but their issuance timing remains reasonable, as the issuance occurred when mNAV trading prices were above 1, within a premium window.
In contrast, FGNX and ETHZ conducted large-scale issuances when mNAV was below 1, effectively issuing shares during a market downturn rather than waiting for favorable market conditions, which is a typical characteristic of lax capital discipline. For FGNX, early and aggressive dilution when mNAV was close to zero resulted in a destructive dilution event, erasing investor leverage and long-term confidence. However, ETHZ showed brief signs of corrective measures, reducing the number of shares in mid-October, helping its mNAV rebound from below 0.2 and partially restoring balance.
4. Open Questions for Further Research
Pantera's dashboard data also opens up new research directions:
• Unlock events: How much do they contribute to price declines?
• PIPE investor return on investment: Which transactions in the DAT space achieve positive returns? How do the results change when adjusted for underlying token performance (e.g., relative to spot ETF returns)?
• Market microstructure: How do PIPE pricing messages affect trading behavior?
• mNAV dynamic modeling: Is there a quantifiable relationship between issuance/repurchase and mNAV recovery?
More work is needed in the area of DAT data, calling for the establishment of more comprehensive data standards. Stock data is much more chaotic than on-chain data: inconsistent formats, low update frequency, and no unified model. To develop DAT into a legitimate asset class, we need open, standardized APIs for companies to report financial updates daily, covering:
• Issued shares (including prefunded and PIPE shares)
• Treasury holdings classified by asset
• Warrant and debt data
Just as on-chain data transparency drives DeFi analysis, this layer of financial data transparency can change the way capital flows into DATs.
5. Conclusion
DATs are neither angels nor demons; neither saviors nor villains.
They represent a new form of capital formation—an innovative investment tool that operates in both directions: enhancing the value of digital assets while providing financial institutions with leveraged exposure that includes on-chain yields. They are not perpetual motion machines, as the flywheel can break under market shocks; rather, they require disciplined strategies and execution from asset management companies. At their best, DATs can release meaningful value for both sides of the ecosystem:
• For traditional investors, they offer regulated, highly liquid, and yield-enhancing exposure to digital assets—often providing additional on-chain yields that ETFs or trusts cannot offer.
• For the crypto ecosystem, they directly channel traditional market funds into token treasuries—anchoring asset value within a compliant structure and enhancing liquidity.
• If managed properly, they can amplify the positive feedback loop between capital markets and the fundamentals of digital assets: rising mNAV leads to new issuances, new funds flowing into digital asset purchases, and then the cycle continues to develop upward.
In this sense, DATs act as the "second cornerstone" of digital assets: institutionalizing capital inflows while providing investors with new, yield-enhanced investment opportunities.
Admittedly, criticisms are valid and often instructive:
• Some DATs are merely speculative shells, lacking genuine operational strategies, serving as short-term tools for PIPE investors to exit to retail, essentially akin to Memecoins;
• The market does not need dozens of DATs tracking the same assets. If the capital management strategies or governance methods lack differentiation, the proliferation of DATs will only increase market noise and weaken trust in the model. Similarly, there is no need to establish DATs for hundreds of digital assets that lack long-term value, especially those operated by teams with low credibility, limited community recognition, or minimal technological innovation. This expansion could reduce DATs to speculative fads rather than reliable financial tools;
• The death spiral (mNAV < 1) remains the most challenging issue. DATs inherently amplify exposure to an already highly volatile asset class, and once market sentiment shifts, the discount may widen rapidly. However, mNAV < 1 typically signals misalignment rather than collapse. Investors may reflect weak capital discipline, concerns about equity dilution, or inefficient capital management, rather than a failure of the underlying digital assets themselves. Excellent operators can turn the situation around through transparent communication and strict equity management.
Ultimately, holding DATs requires a dual belief from market participants:
• A long-term bullish outlook on the underlying assets—believing that their prices will rise over time and seeking leveraged exposure through active equity vehicles;
• Trust in the operators' execution and capital discipline—as Fundstrat's Tom Lee points out, mNAV < 1 is illogical, and a competent management team will ultimately pull the stock price back to parity.
If both conditions are met, a lower mNAV is not an alarm but merely a temporary phenomenon of market sentiment mispricing the actual balance sheet value.
The core of DATs lies in representing a new type of investment tool—they help digital assets accumulate lasting value while providing financial institutions with a regulated, yield-enhancing pathway to participate in the future development of the digital asset era.
免责声明:本文章仅代表作者个人观点,不代表本平台的立场和观点。本文章仅供信息分享,不构成对任何人的任何投资建议。用户与作者之间的任何争议,与本平台无关。如网页中刊载的文章或图片涉及侵权,请提供相关的权利证明和身份证明发送邮件到support@aicoin.com,本平台相关工作人员将会进行核查。