1. Basic Principles of the CCI Indicator
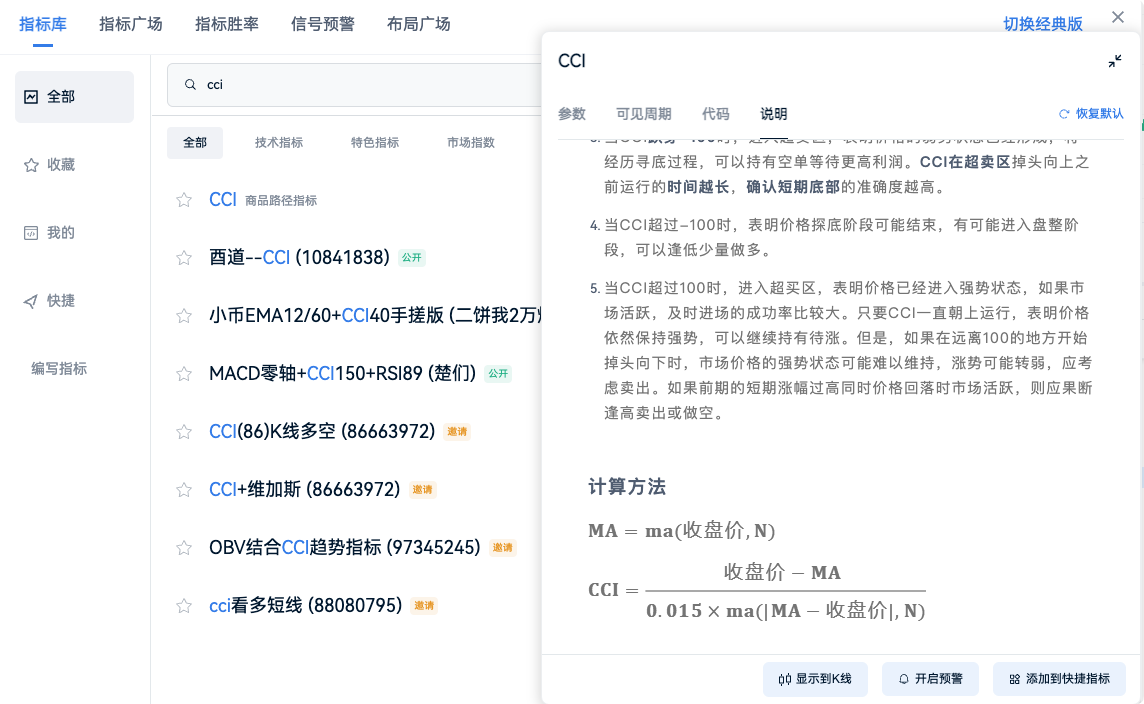
The CCI (Commodity Channel Index) was developed by Donald Lambert in 1980, initially used to determine cyclical turning points in commodity futures, and later widely applied in stock, forex, and cryptocurrency markets.

Core Formula of CCI:
CCI = (Typical Price - MA_TP) / (0.015 × Mean Deviation)

Where:
- Typical Price (TP) = (High + Low + Close) / 3
- MA_TP = N-period simple moving average of TP (common period is 14)
- Mean Deviation = Average absolute deviation of TP from MA_TP
- 0.015 is a constant set by Lambert, ensuring that about 70%-80% of CCI values fall between -100 and +100
Essential Meaning of CCI:
- Measures the degree of price deviation from the "normal fluctuation range"
- When CCI > +100, the price is significantly above the recent average, indicating an "overbought" state
- When CCI < -100, the price is significantly below the recent average, indicating an "oversold" state
- Extreme values (>200 or <-200) usually indicate excessive short-term momentum, which may reverse
2. Why Do Simple CCI Overbought/Oversold Signals Easily Fail?
The common textbook advice of "sell when CCI > 100, buy when CCI < -100" is very effective in a ranging market but continuously fails in a trending market:
- In a strong bullish trend, CCI may remain above +150 for a long time, constantly triggering "overbought" false signals
- In a strong bearish trend, CCI may remain below -150 for a long time, constantly triggering "oversold" false signals
Therefore, professional traders rarely use CCI alone; trend filtering must be incorporated.
3. Core Logic Breakdown of Signals
Core Algorithm:
Long Entry Conditions: CCI < 120 + EMA Difference > 1200 + No Short Position
Short Entry Conditions: CCI > 150 + EMA Difference > 1200 + No Long Position
Asymmetric Design of CCI Thresholds (<120 for Long, >150 for Short)
- Bullish trends are usually more persistent and stronger than bearish trends (the "slow up, fast down" phenomenon in behavioral finance).
- Allowing long positions only when CCI drops below 120 indicates acceptance of higher and longer CCI in a bullish trend;
- Allowing short positions only when CCI exceeds 150 indicates greater sensitivity to bearish overbought conditions, preventing being trapped in weak rebounds.
- This asymmetry itself respects the true skewness of the market.
EMA Difference > 1200 Trend Filtering
- Assuming you are using the difference between short and long period EMAs (e.g., EMA14 - EMA60, or EMA20 - EMA100, etc.)
- A difference > 1200 (points) indicates a very clear long-term bullish trend, with prices far from long-term moving averages.
- This serves as a dual filter of "trend strength + trend persistence":
- Large difference → Strong trend
- Continuously expanding difference → Trend is still accelerating
- In this context, CCI pullbacks are no longer reversal signals but normal corrections within the trend.
Current No Position Unidirectional Holding Logic
- Avoiding both long and short positions reduces fees and risks
- Aligns with the classic principle of "let profits run, cut losses timely"
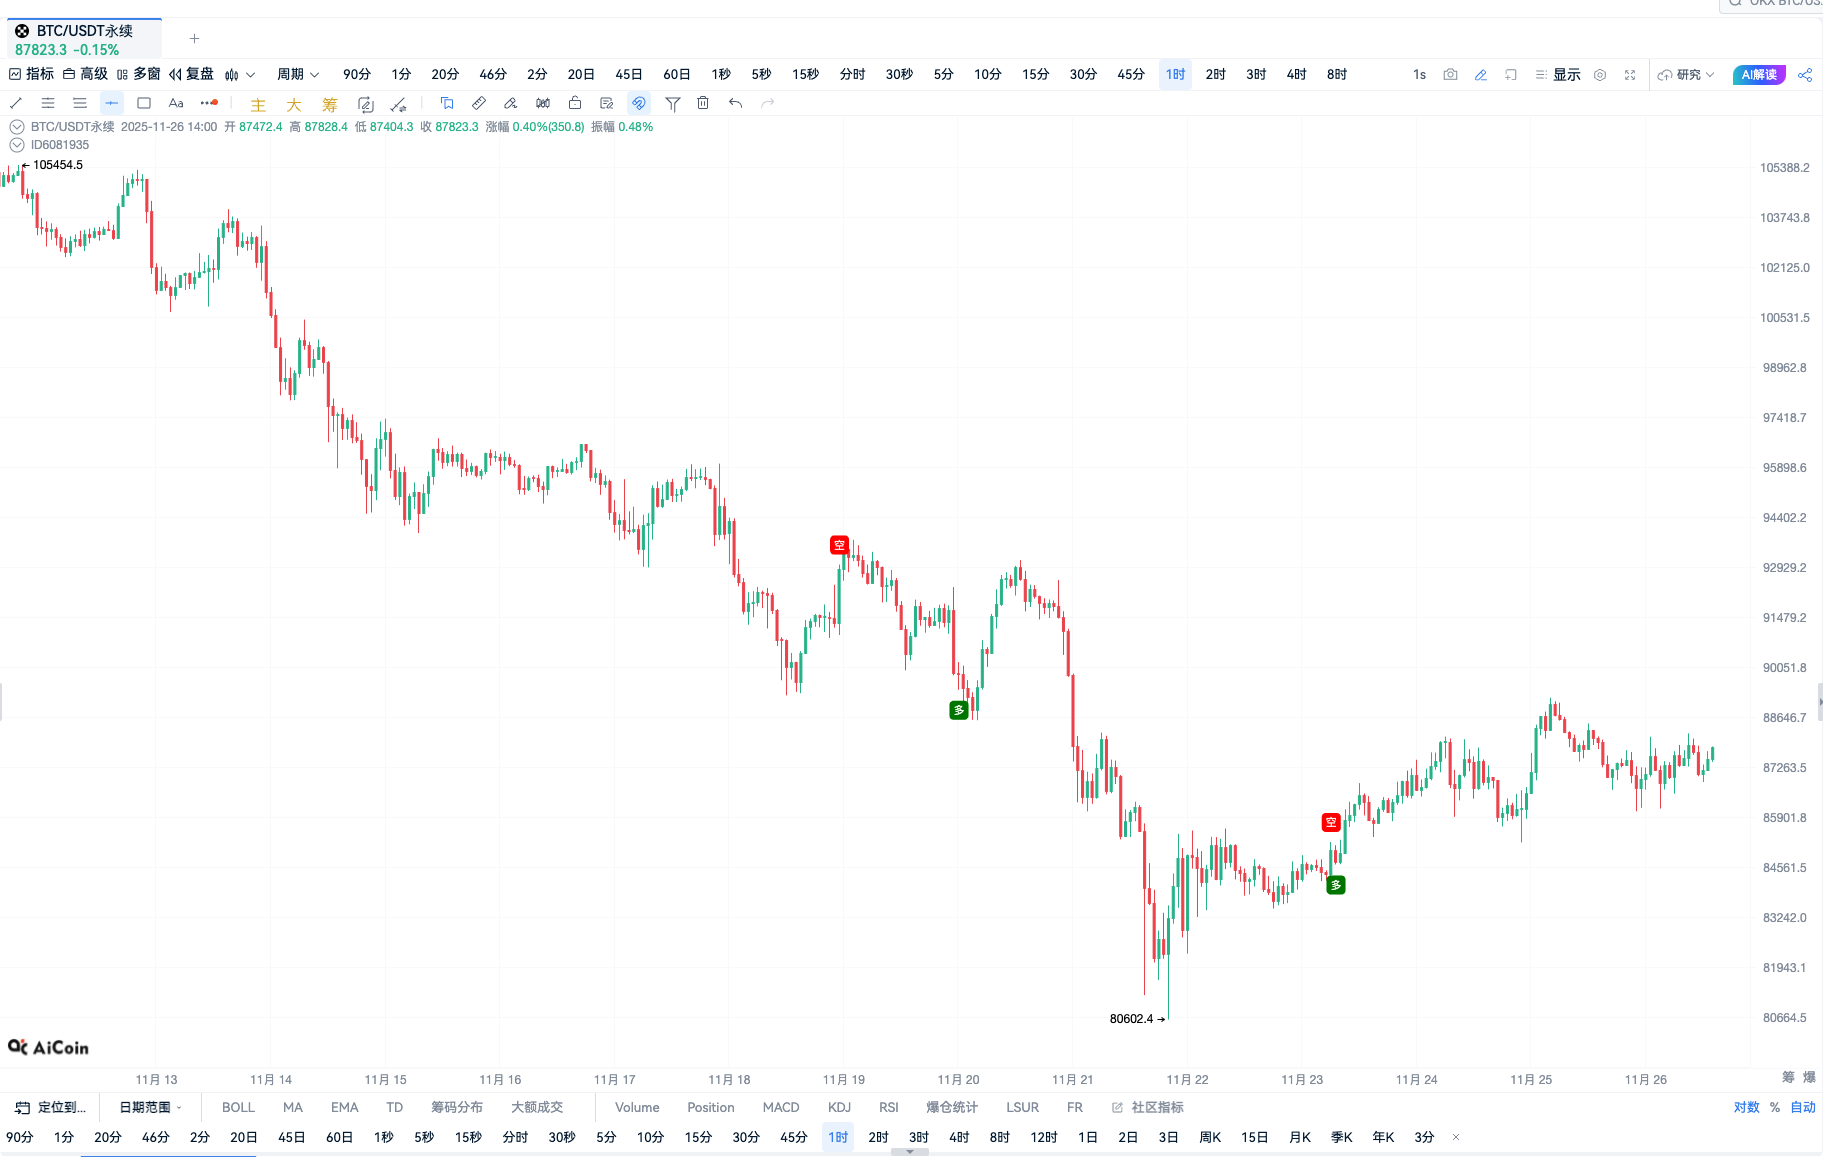
4. Signal Effectiveness

(Chart OKX - BTCUSDT Perpetual Contract 1-Hour Period)
5. Script Source Code
// @version=2
// CCI Indicator Calculation
cciValue = cci(close, 20, 'MA')
// EMA Indicator Calculation
ema14 = ema(close, 14)
ema60 = ema(close, 60)
_ema = abs(ema14 - ema60)
// === Position State Variables ===
var longcount = 0
var shortcount = 0
var longprice = nan
var shortprice = nan
// === Signal Condition Definitions ===
// Long Entry Conditions: CCI < 120, EMA Difference > 1200, No Short Position
entrylongsignal = cciValue < 120 and ema > 1200 and longcount == 0
// Short Entry Conditions: CCI > 150, EMA Difference > 1200, No Long Position
entryshortsignal = cciValue > 150 and ema > 1200 and shortcount == 0
// Close Long Conditions: Currently holding a long position and meets short entry conditions
exitlongsignal = long_count == 1 and cciValue > 150 and _ema > 1200
// Close Short Conditions: Currently holding a short position and meets long entry conditions
exitshortsignal = short_count == 1 and cciValue < 120 and _ema > 1200
// === Closing Operations (must precede opening operations) ===
// Close Long
exitShortPercent(exitlongsignal, id = 'exitLong1', price='market', percent=100)
if exitlongsignal
longcount := 0
longprice := nan
// Close Short
exitShortPercent(exitshortsignal, id = 'exitShort1', price='market', percent=100)
if exitshortsignal
shortcount := 0
shortprice := nan
// === Opening Operations ===
// Open Long
enterLongAmount(entrylongsignal, id='enterLong1', price='market', amount=1)
if entrylongsignal
longcount := 1
longprice := close
// Open Short
enterShortAmount(entryshortsignal, id='enterShort1', price='market', amount=1)
if entryshortsignal
shortcount := 1
shortprice := close
// === Plotting Markers ===
plotText(entrylongsignal, title='Long', text = 'Long', refSeries = low, bgColor='green', color='white', fontSize=11, placement='bottom', display=true)
// Short Entry Marker
plotText(entryshortsignal, title='Short', text = 'Short', refSeries = high, bgColor='red', color='white', fontSize=11, placement='top', display=true)
// === Alert Settings ===
alertcondition(entrylongsignal, title='Long Entry Signal', direction='buy')
alertcondition(entryshortsignal, title='Short Entry Signal', direction='sell')
alertcondition(exitlongsignal, title='Close Long Signal', direction='sell')
alertcondition(exitshortsignal, title='Close Short Signal', direction='buy')
6. Conclusion
This asymmetric CCI + EMA difference system essentially embodies the phrase — "Follow the super trend, dare to act on pullbacks."
It does not seek signals every day, nor does it aim to catch tops and bottoms; it only engages in the most certain, most profitable, and most comfortable waves:
In a bull market, it treats "high-level fluctuations" as entry points, while in a bear market, it considers "desperate rebounds" as escape zones.
By mechanically eliminating emotions, respecting the market's true skewness with asymmetric thresholds of 120 and 150, and discarding 90% of ranging markets with a strong trend filter of 1200 points.
The system that truly belongs to you is the one that has been refined after experiencing several rounds of bull and bear markets, enduring multiple liquidations, and adjusting parameters dozens of times.
May we all be able to secure profits in the next major market trend in 2026.
免责声明:本文章仅代表作者个人观点,不代表本平台的立场和观点。本文章仅供信息分享,不构成对任何人的任何投资建议。用户与作者之间的任何争议,与本平台无关。如网页中刊载的文章或图片涉及侵权,请提供相关的权利证明和身份证明发送邮件到support@aicoin.com,本平台相关工作人员将会进行核查。


