Written by: Michael Nadeau, The Defi Report
Translated by: Glendon, Techub News
In less than two years, Pump Fun has achieved remarkable results, generating nearly $900 million in revenue and close to $200 million in token buybacks, giving us a glimpse into the possible future form of "consumer-grade cryptocurrency."
In this week's report, we will delve into the data driving its growth, compare its core metrics with the data from the market frenzy peak in the first quarter of this year, and explore whether Pump is merely a fleeting "cyclical product" or the beginning of the first true on-chain consumer-grade super application.
Fundamental Update
Active Traders
The Pump Fun protocol currently earns fees primarily through two channels.
Bonding Curve Fees
Pump charges a 1% protocol fee on all Bonding Curve transactions. The Bonding Curve is where new tokens are traded before they "graduate" to the Pump Swap DEX.
"Graduation" refers to the point at which the tokens issued on the Bonding Curve (which account for 80% of the supply) are sold out and have sufficient liquidity to migrate to the Pump Swap DEX. This process is called "graduation."
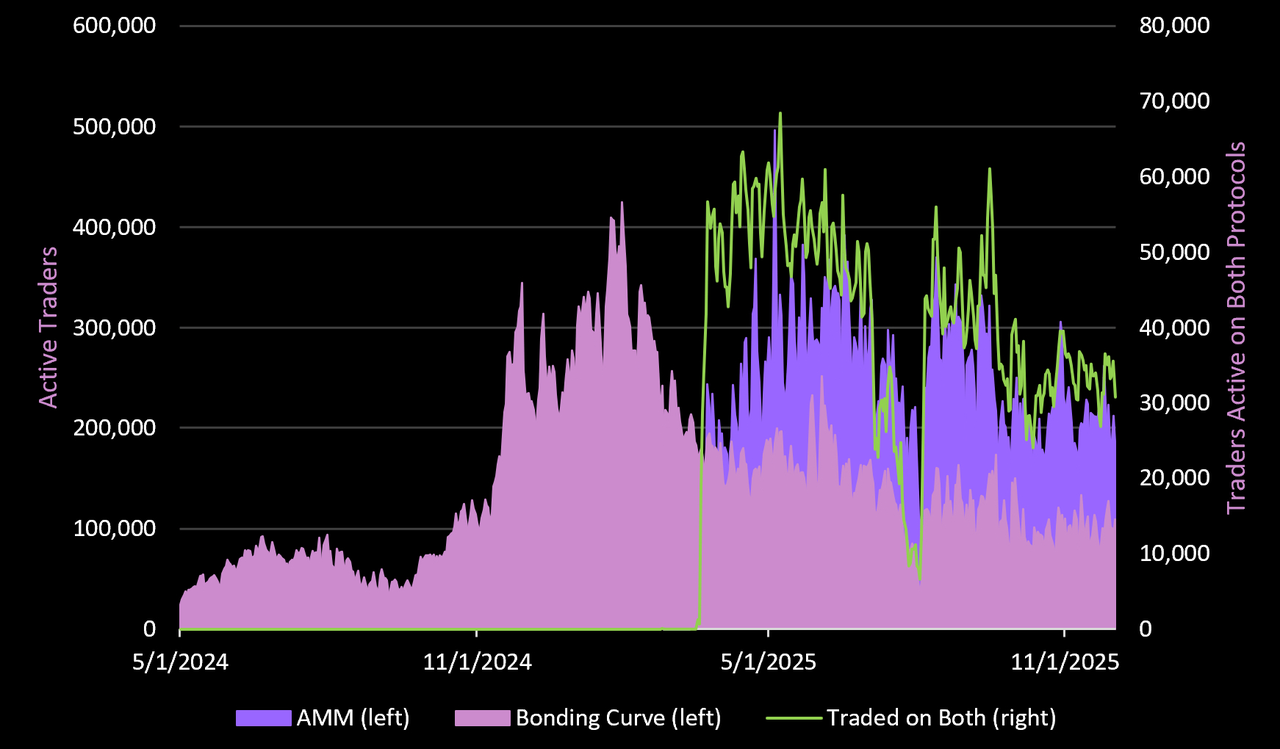
In the past 90 days, the Bonding Curve has averaged 106,000 active addresses per day—a 60% decrease from the first quarter of this year (the peak frenzy period for Pump/Solana).
Pump Swap DEX
The Pump Swap DEX is the platform where tokens migrate after "graduating" from the Bonding Curve. The protocol earns a 0.05% commission fee on each transaction on the DEX.
Over the past 90 days, this DEX has averaged 219,000 active addresses per day.
New Traders vs. Returning Traders
In the past 90 days, 37% of trading addresses were new addresses, while 63% were "returning customer" addresses—similar to the user dynamics Pump has maintained since its inception (the proportion of "new addresses" during the peak frenzy in the first quarter was 36%).
User Retention Rate
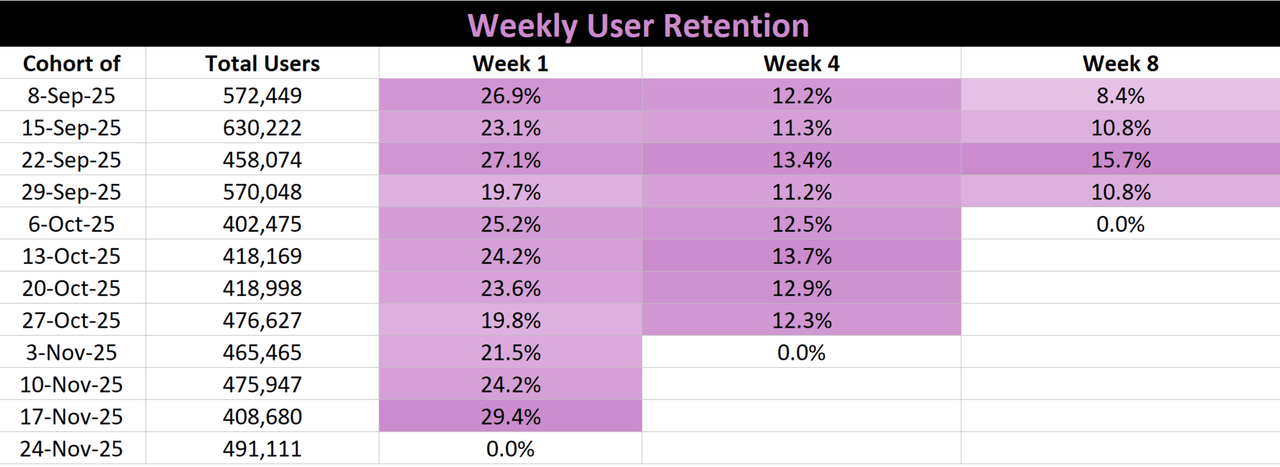
However, the user retention rate data from the last 12 weeks reveals some interesting results.
Since early September, Pump has averaged 482,000 active addresses per week. Over a week, its user retention rate averaged 24%.
The new user retention rate dropped to 12.4% after 4 weeks and to 11.4% after 8 weeks.
Key Takeaways
While these user retention figures may seem unremarkable, they actually perform exceptionally well compared to Web 2.0 platforms:
Market/Fintech platforms have a first-week retention rate of 10-15%;
Gaming applications have a player retention rate of 7-12% in the first week;
Consumer social media platforms have a first-week retention rate of 15-20%;
Retention rates across all categories in the fourth week are 5-10%;
Retention rates across all categories in the eighth week are 2-5%.
What about bots?
Web2 bot traffic often inflates "top of the funnel" metrics (due to junk clicks, registrations, and ad traffic), thereby distorting user retention rates.
On-chain bots behave differently.
Bots trade repeatedly.
They can disregard price.
They appear in the "returning customer" metrics.
In simple terms: bots are also paying customers.
Given that the current data is still far from the frenzy level of Pump in the first quarter, these figures suggest that the product meets market demand. We will keep a close eye on this, especially in the context of declining on-chain sentiment.
Token Issuance
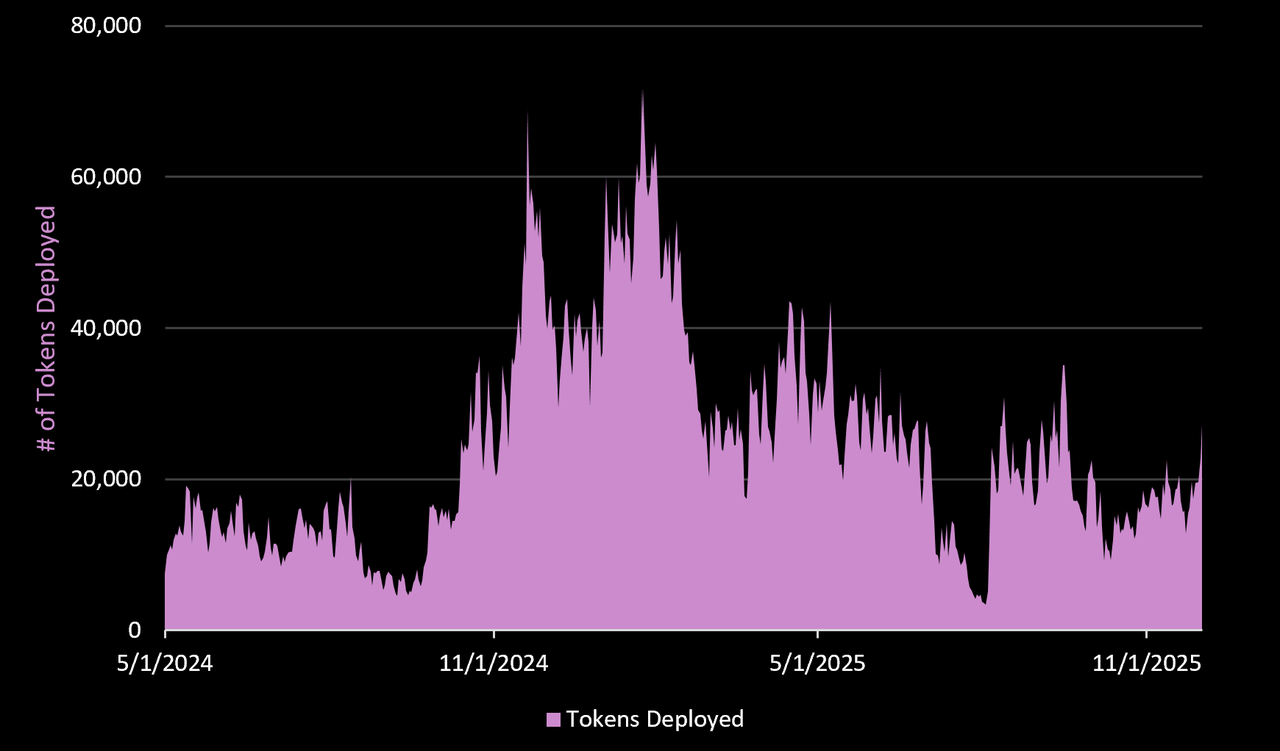
In the past 90 days, the Pump project has averaged 18,300 tokens issued per day, a 55% decrease from the first quarter.
Token "Graduation" Status
In the past 90 days, 1.77% of the newly launched products on Pump Fun ultimately "graduated" to the Pump Swap DEX (this percentage has jumped to 4.1% in the past 30 days).
Key Takeaways
During the market frenzy peak (the first quarter), only an average of 1.07% of tokens were able to successfully launch. As on-chain speculative activity has weakened, we seem to be seeing higher quality token issuances. This is interesting and worth monitoring—especially as interest in Memecoins gradually wanes.
Trading Volume
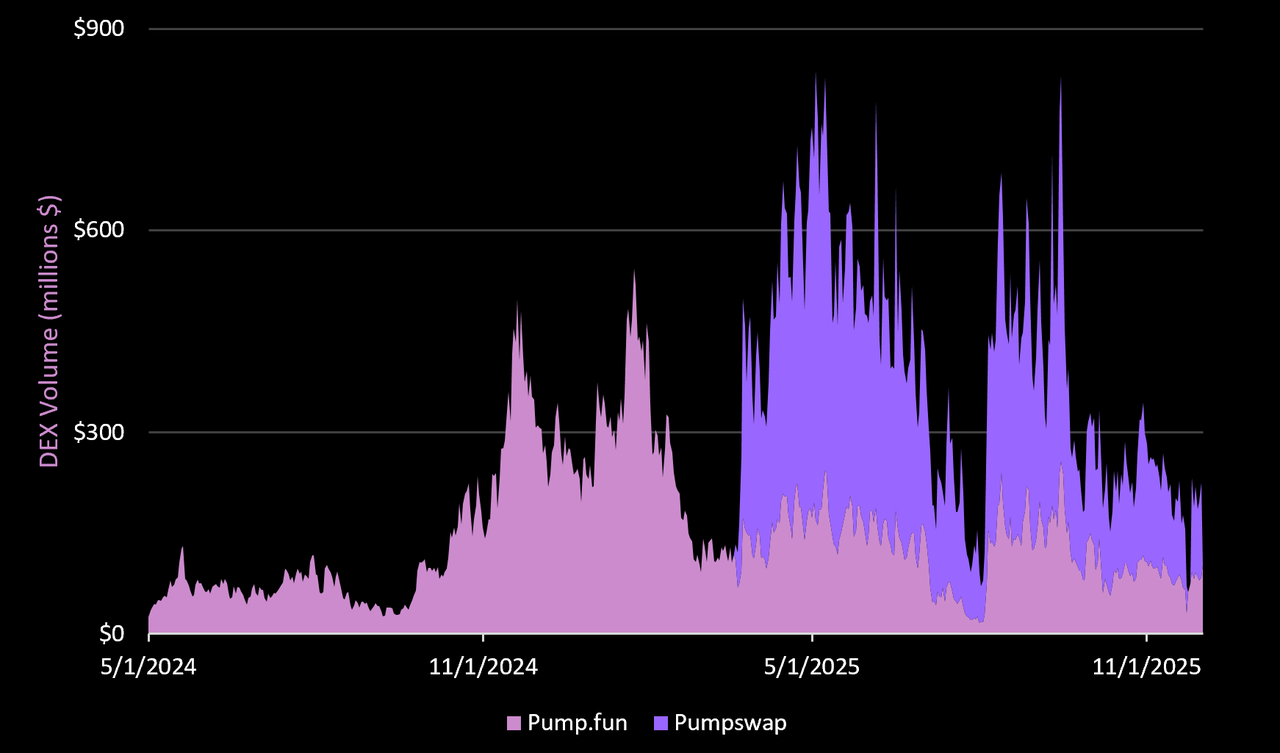
On the Bonding Curve and Pump Swap DEX, the protocol has averaged $312 million in trading volume per day over the past 90 days. This is a 16.4% increase from the first quarter (when Pump Swap had not yet launched), and it has achieved a market share of 10.8% on the Solana platform (including private AMMs).
For reference, the leading Solana DEX (HumidiFi, a private DEX) has averaged $1.24 billion in trading volume over the past 90 days.
The trading volume on the Bonding Curve accounts for about 40% of the total trading volume of Pump tokens. Considering that less than 2% of tokens can enter the Pump Swap DEX but contribute 60% of the trading volume, this data is quite intriguing.
Revenue
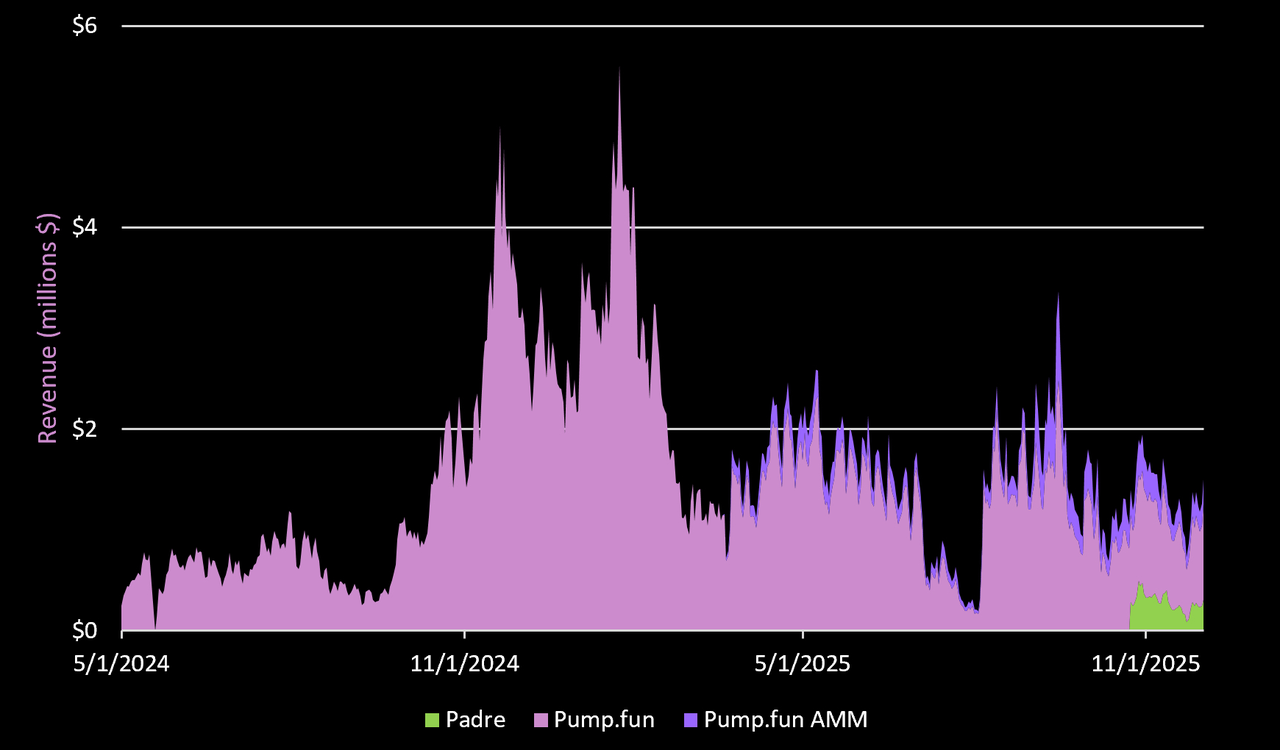
Since its inception, Pump Fun has generated:
$828 million in Bonding Curve fees (to be launched in April 2024);
$54.5 million in DEX transaction fees (to be launched in March 2025);
Pump acquired the trading application/terminal Padre on October 24, generating $11.2 million in revenue. Since its inception, Padre has generated $159 million in fees (Padre was launched in April this year).
In the past 30 days, the total fees from the three products averaged $1.28 million per day. This performance is quite impressive in a bear market. The protocol's total revenue over the past 19 months has approached $900 million. Its price-to-sales ratio over the past 12 months is 2.27. (Techub News note: price-to-sales ratio = share price/sales per share; a lower price-to-sales ratio indicates greater investment value for the company.)
For reference, Meta's price-to-sales ratio over the past 12 months is 8.83, Nvidia's is 23, Robinhood's is 29, and Coinbase's is 10.
Key Takeaways
Pump Fun is one of the fastest consumer-grade products to reach $900 million in revenue. Facebook took five years to reach this revenue level, Snapchat took five years, Twitter took eight years, Roblox took ten years, while TikTok achieved it in just three years.
Moreover, Pump Fun accomplished this without advertising, a sales team, user acquisition budget, and with a team smaller than a high school basketball team.
By Web 2 standards, this is quite incredible. It highlights how application developers can leverage cryptocurrency technology to reach global users at lightning speed.
Therefore, the key question moving forward is: Will Memecoins be as fleeting as NFTs? Will Pump Fun repeat the fate of OpenSea?
Token Economics
Total Supply: 999,989,313,535 tokens;
Circulating Supply: 590,000,000,000 tokens (approximately 59% circulating);
Price and Market Cap
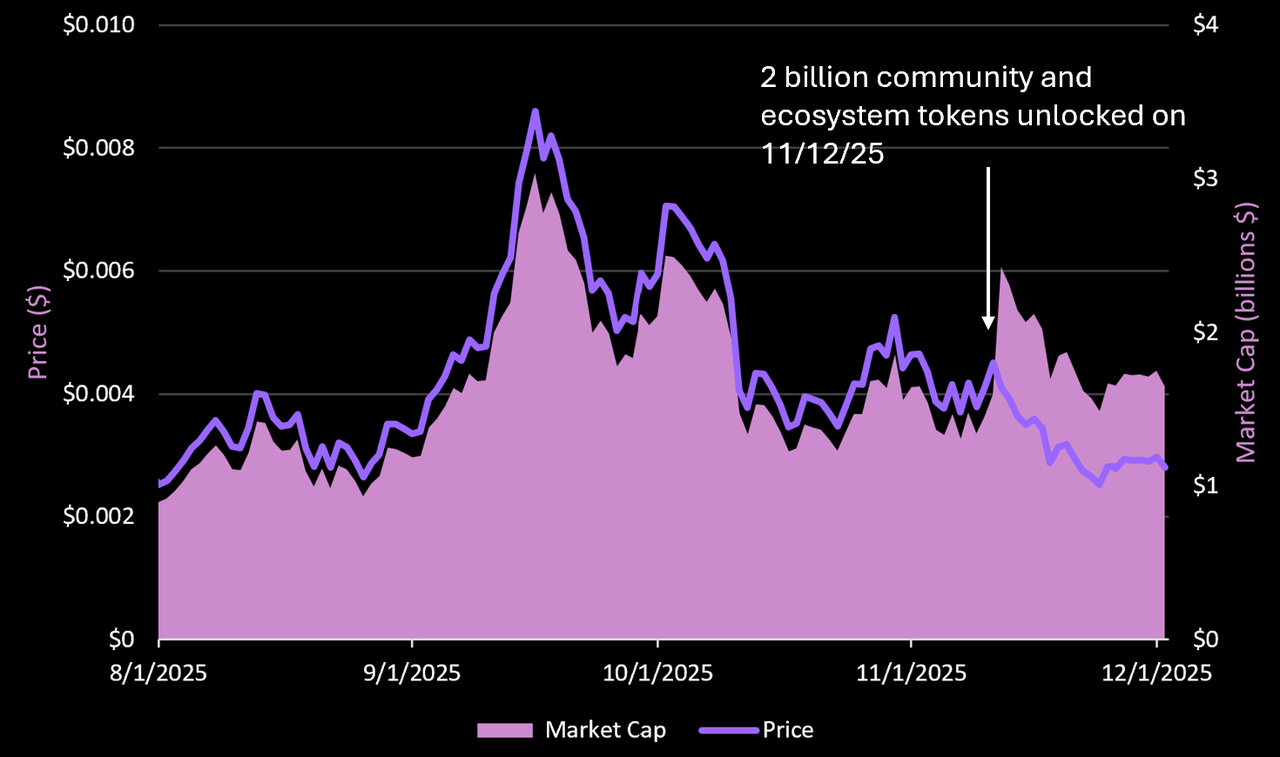
This article shares the above chart to emphasize the challenges that token unlocks present to investors during a bear market. Pump's market cap has dropped 46% from its peak in mid-September, and the token price has fallen by 67%.
Why is this? On November 12, 2 billion community and ecosystem tokens will be unlocked.
Token Distribution
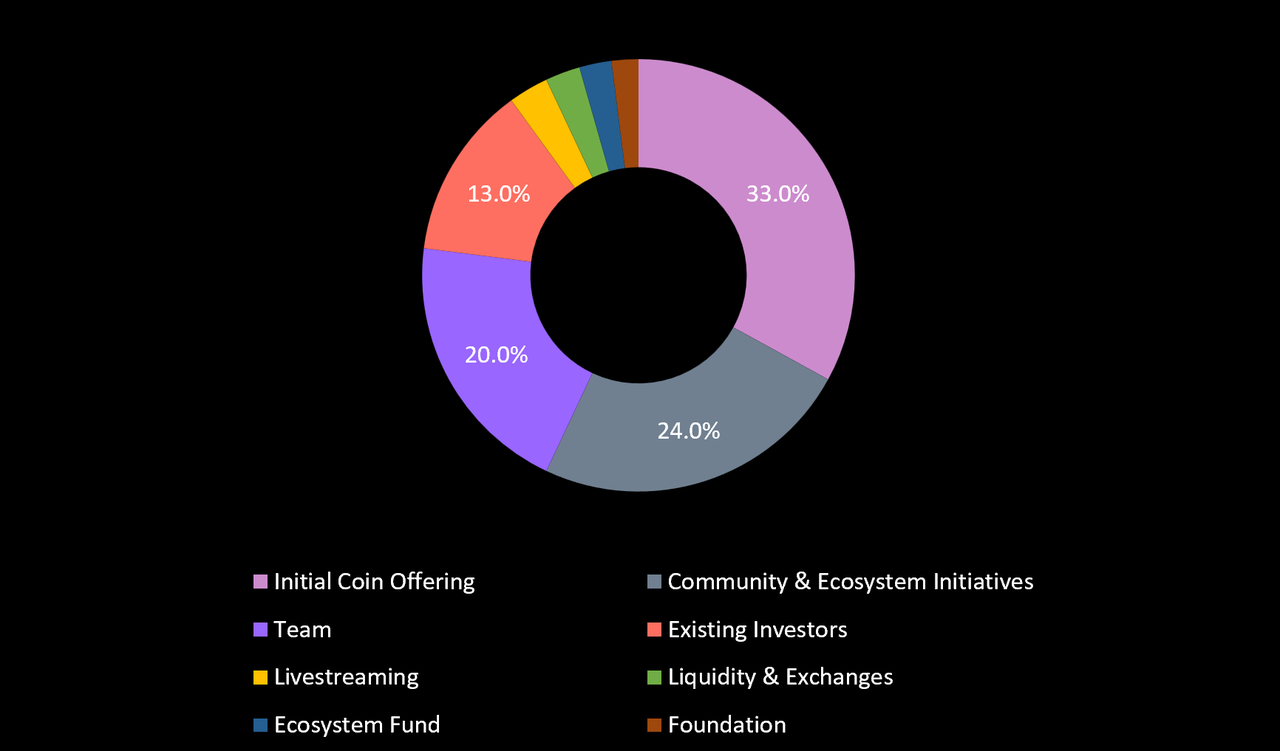
Token Unlock
ICO: All unlocked.
Community: 76% unlocked, with 2 billion tokens released in mid-November. The remaining tokens will unlock in July 2026.
Team: 100% locked, with the first 25% to be unlocked in June 2026 through a "cliff" unlock. The remaining tokens will be linearly unlocked over 36 months, until June 2029. (A "cliff" unlock refers to a large amount of previously locked tokens being released to the circulating market all at once or within a very short time after the lock-up period ends.)
Existing Investors: 100% locked, with the first 25% to be released in June 2026 through a "cliff" unlock. The remaining tokens will be linearly unlocked over 36 months, until June 2029. This unlock schedule aligns with the team's unlock timeline.
Live Stream Hosts: 100% unlocked.
Liquidity and Trading: 100% unlocked.
Ecosystem Fund: 100% unlocked.
Foundation: 100% unlocked.
Buyback
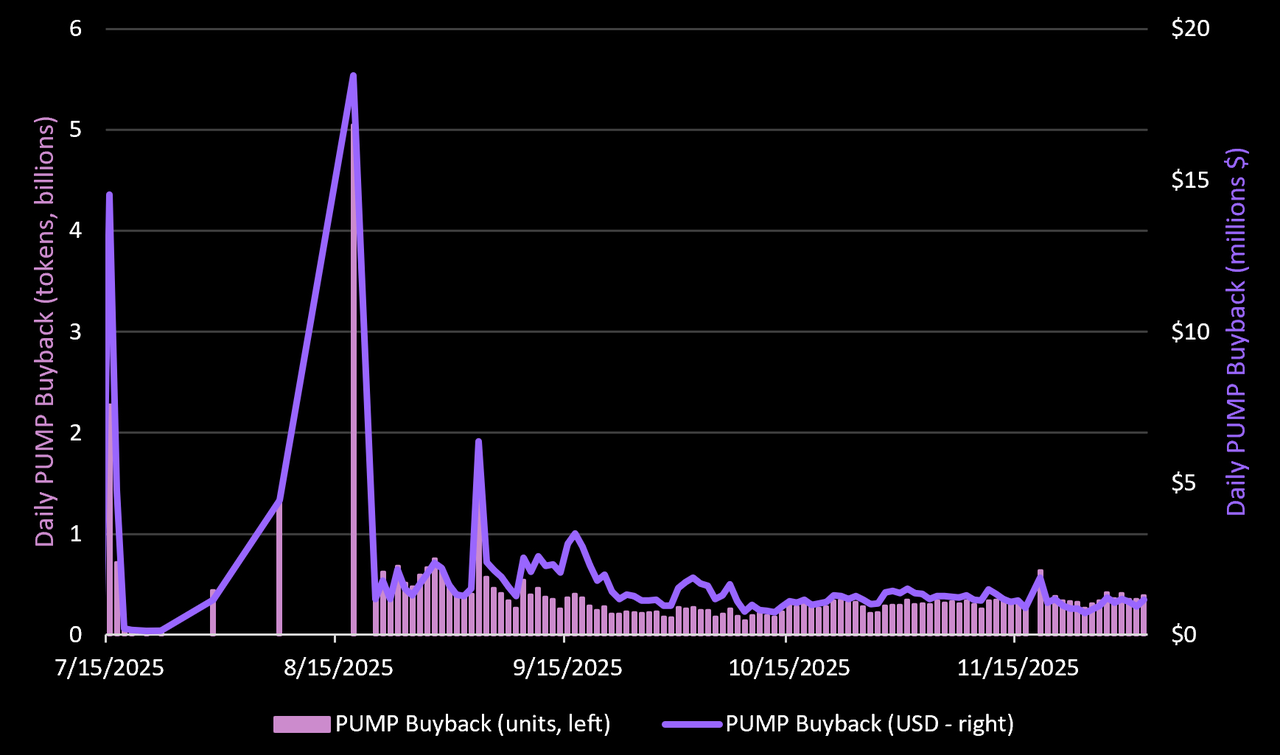
Total buyback amount: 46,024,318,185 tokens (approximately 4.6% of total supply);
Total buyback amount: $198 million (accounting for 90% of the revenue since the buyback began in July).
This is one of the most aggressive buyback programs in the cryptocurrency space. Such a large-scale buyback demonstrates that Pump is:
A real business with genuine cash flow;
A structural buyer in the market (averaging $1.7 million per day);
Committed to returning value to token holders and adjusting incentives.
Token Holder Distribution
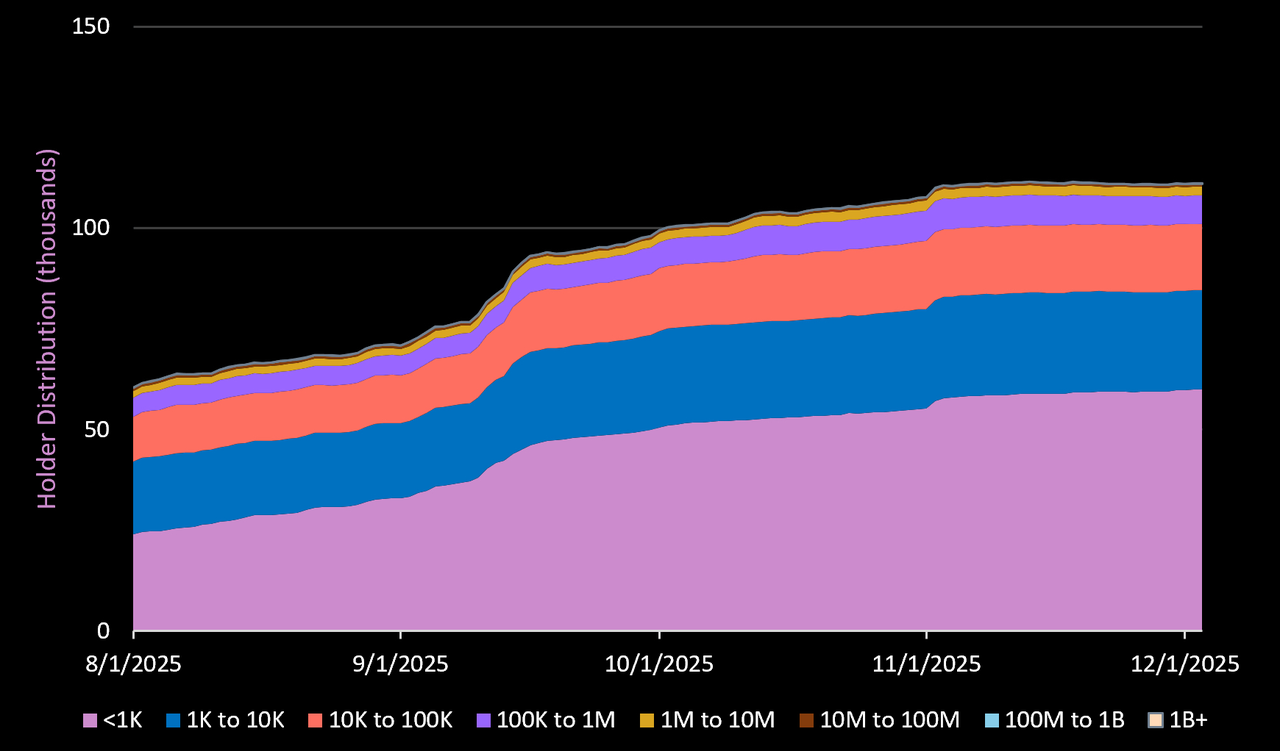
Total number of token holder addresses: 110,900
Addresses holding less than 1,000 tokens (worth $3): 59,927
Addresses holding 1,000 to 10,000 tokens (priced between $3 and $30): 24,701
Addresses holding 10,000 to 100,000 tokens (priced between $30 and $300): 16,461
Addresses holding 100,000 to 1,000,000 tokens (priced between $300 and $3,000): 7,039
Addresses holding 1,000,000 to 10,000,000 tokens (worth between $3,000 and $30,000): 2,149
Addresses holding 10,000,000 to 100,000,000 tokens (worth between $30,000 and $300,000): 553
Addresses holding 100,000,000 to 1,000,000,000 tokens (worth between $300,000 and $3,000,000): 174
Addresses holding over 1,000,000,000 tokens (worth over $3,000,000): 54
Key Takeaways
In wallets holding PUMP tokens, 91% of the holdings are worth less than $300, indicating high retail participation, even though their holdings account for only a small portion of the total supply.
Only 9% of wallets hold PUMP tokens worth more than $300. The top 20 holders control 82% of the token supply. It is believed that these holders are primarily team members and early investors, whose tokens will be locked until July 2026—this is a key date to watch, as tokens worth $246 million will enter the market at that time.
Final Thoughts
The rise of Pump Fun over the past few years is one of the best examples of product-market fit in the cryptocurrency space, driven by speed, simplicity, and speculation. A small team has created one of the fastest-growing consumer applications in history without advertising, a sales organization, or traditional marketing strategies.
Product Integration
The team has been able to deliver products quickly and strategically integrate the tech stack (creator-focused token issuance interface + Pump Swap DEX infrastructure + Padre trading terminal), indicating a clear goal to control the entire user flow for the "cryptocurrency consumer" use case.
It is believed that as the team seeks to attract creators through live streaming use cases and expand its "social experience," the application will continue to evolve in the coming years—potentially attracting creators from other Web2 platforms (offering better monetization opportunities through tokens and trading fees).
Risks
The main risks facing Pump Fun include: a high concentration of tokens in top wallets (with token unlocks next July amounting to $247 million); a young (and wealthy) leadership team; and the significant challenge of maintaining user attention in an environment of high user churn.
Competition will intensify, but Pump's brand influence, capital reserves, and first-mover advantage are crucial.
Ultimately, the success of Pump Fun depends on whether the meme coin asset class can succeed. It is believed that meme coins will exist long-term, and their application scenarios, practical utility, and deep integration with online social experiences are just beginning.
A fair launch, the ability to attract legitimate creators for active participation, and the construction of innovative value-sharing models with fans are essential. We look forward to seeing substantial progress in these areas, as well as effective user protection measures against malicious buying and market manipulation.
Finally, it is believed that the bear market may reveal many clues about Pump Fun's future prospects, which is why it is important to keep it on the watchlist.
免责声明:本文章仅代表作者个人观点,不代表本平台的立场和观点。本文章仅供信息分享,不构成对任何人的任何投资建议。用户与作者之间的任何争议,与本平台无关。如网页中刊载的文章或图片涉及侵权,请提供相关的权利证明和身份证明发送邮件到support@aicoin.com,本平台相关工作人员将会进行核查。


