Ethereum is about to form a head and shoulders pattern at the hourly level. Can 2,900 hold? If the head and shoulders pattern forms, where should we open short positions for a higher win rate? After breaking below 2,900, where would it be more reliable to open long positions? Let's analyze the market around this theme. Today is December 9, 2025.
We will look at this area from the hourly and 4-hour perspectives.
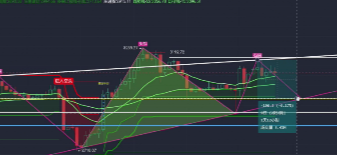
Last night, when this pin closed, it was predicted that the hourly chart might form a head and shoulders pattern. So what should we do now?
Last night, this pin initially formed the right shoulder of the head and shoulders pattern, but we still need some fluctuations and this bar. If it can continue to close bearish, then the right shoulder of the head and shoulders pattern will be confirmed.
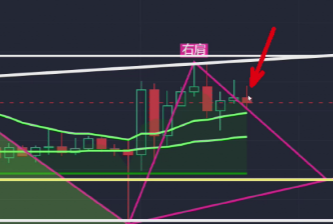
Once the right shoulder of the head and shoulders pattern is confirmed, it still needs to develop, as it is on the 4-hour chart and won't drop quickly. It needs to break this neckline, the purple line. If this neckline is broken, there is a chance to reach the support below 2,900, and the important range of 2,700-2,800 is crucial if it breaks this upward neckline. Additionally, there is another support at this white line.
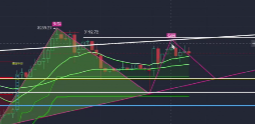
What is the support level below this white line? We can see that the support of this white line is 2915.
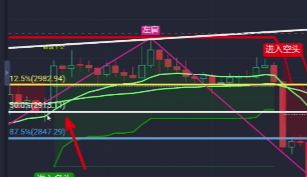
Now, a little lower, where is this green resistance? It is around 2893, which is near 2,900. However, based on historical patterns, when the left shoulder of the head and shoulders pattern forms, this wave retraced by about 10%. Historically, when the left shoulder forms, the drop was 11%, and when the head forms, it also dropped by 10%. For the right shoulder formation, from this point to here, it will drop by 6%.
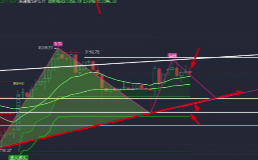
Do you think a drop of 6% is possible? Initially, it may slowly fluctuate here, but once it breaks this neckline and reaches 2,900, that would be an 8% drop. Whether 2,900 can hold is something we need to observe.
From my experience in analyzing Ethereum, I believe that 2,900 will hold for a short time, fluctuating here until the weekend, when it is likely to break 2,900. If it breaks 2,900, where do we look? If it breaks 2,900, we will see the support in this area.
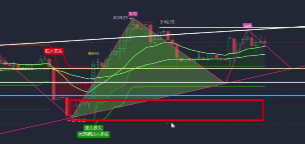
The support in this area is in the range of 2,700-2,850. How should we act? For short positions, we can still wait for the hourly right shoulder to rebound again before opening shorts. We can refer to these two or three prices, and I am using a grid trading logic.

To prevent a spike that could stop out the short position before dropping again, it would be unfortunate. Therefore, the initial positions are set at 3,190, 3,180, and 3,190. These prices are not the final confirmation; if it closes bearish, these prices may be adjusted at 16:00 in the afternoon.
If the market changes again, this strategy will also be adjusted accordingly.
For more real-time trades, you can follow the public account BTC-ETH Crypto.

免责声明:本文章仅代表作者个人观点,不代表本平台的立场和观点。本文章仅供信息分享,不构成对任何人的任何投资建议。用户与作者之间的任何争议,与本平台无关。如网页中刊载的文章或图片涉及侵权,请提供相关的权利证明和身份证明发送邮件到support@aicoin.com,本平台相关工作人员将会进行核查。