At 3 AM Beijing time on December 11, the U.S. Federal Reserve released its latest interest rate decision as expected. In this FOMC meeting, the Fed decided to continue lowering interest rates by 25 basis points, bringing the federal funds rate down from 3.75%-4% to 3.5%-3.75%.
Wall Street journalists, known as the Fed's mouthpiece, pointed out in their articles that the Fed's post-meeting statement indicated that three Fed officials voted against the decision, showing that internal divisions within the Fed remain quite serious.
Additionally, it is worth noting that the Fed's dot plot indicates that a 25 basis point rate cut is expected in both 2026 and 2027. Although the dot plot shows only one rate cut in 2026, the overall policy statement and economic forecast remain dovish, significantly raising the economic growth forecast for 2025, revising down the inflation path, and announcing the initiation of a reserve management bond-buying program.
Affected by the Fed's interest rate decision and dot plot, Bitcoin experienced volatile trading, first surging above $94,000 but then facing selling pressure, dropping to a low of $91,750. Ethereum's performance was similar, briefly rising above $3,400 but quickly retreating.
On Thursday, Bitcoin followed a pattern of fluctuating downward, reaching a low near the strong support level of $89,100 mentioned in yesterday's article. It then began to rebound, with the price at the time of writing being $90,260, down about 2.93% in the last 24 hours.
Bitcoin Four-Hour Chart
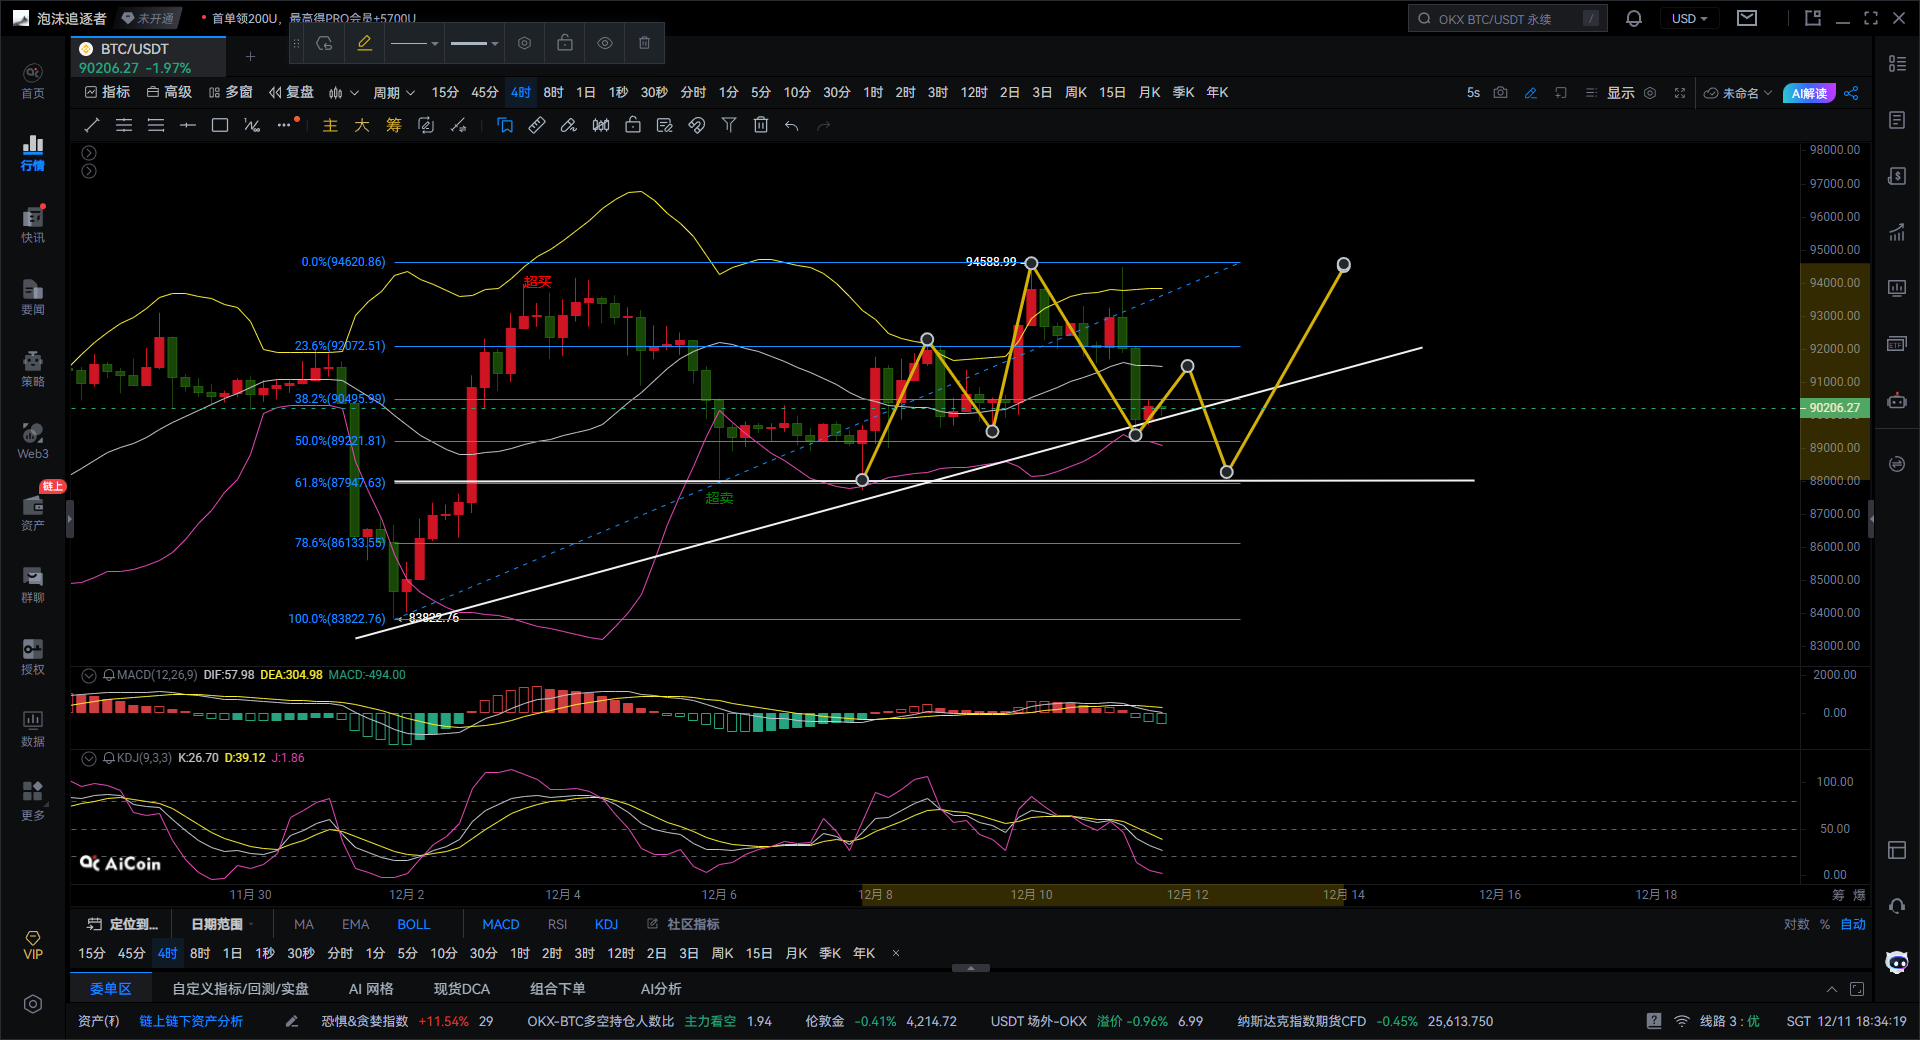
The signals on the four-hour chart are relatively clear: the short-term is a bit weak and needs a pullback, but the larger trend remains upward. There is no need to be too anxious.
First, let's look at the signals given by the Bollinger Bands. The price dropped directly from the upper band, forming a large bearish candle, and has now retreated to near the middle band, slightly breaking below it. The Bollinger Bands are flattening with a slight opening, indicating that the current market is transitioning from the pressure zone of the upper band to the contest phase around the middle band, with a short-term pullback rhythm. As long as the price does not effectively break below the lower band (roughly in the range of $88,000–$88,500), the overall trend remains healthy.
Next, looking at the KDJ, the three lines have formed a death cross and are diverging downward, with the J line value approaching the oversold area. This tells us that the short-term bears are dominant and there is still room for a pullback. However, the J line value is too low, and generally, such situations do not last long before stabilizing and rebounding.
The MACD indicator is weak, with the MACD histogram having turned green and gradually expanding, while the DIF line and DEA line have also formed a death cross moving downward. The conclusion here is simple: bullish momentum has clearly weakened, and a period of adjustment or pullback may be needed to digest this.
Pay close attention to the Fibonacci retracement levels. Currently, Bitcoin's price has retraced from a high of $94,688 and is now in the range of 38.2% ($90,495) to 50% ($89,200). This range is a normal pullback position for the main upward wave. The key support area is between $89,200 (50%) and $88,300 (61.8%), which is a comfortable "entry price" for bulls. As long as the 61.8% line holds, it is a healthy pullback, and the price will continue to rise afterward.
In summary, the short-term is pulling back, while the medium-term remains upward, with a pattern of falling first and then rebounding. The market may follow an A-B-C retracement structure: continuing to pull back in the short term, looking for support between $89,200–$88,300, while both MACD and KDJ need this period for repair. Once it stabilizes in this golden zone, with KDJ forming a golden cross and the MACD energy bars contracting, the bulls will counterattack. As long as $88,300 holds, there is a high possibility of a washout to induce shorts. The first resistance target for the rebound is at $91,800 (Fibonacci 38.2%), and the second resistance is at $94,500 (near the previous high), with a strong possibility of breaking above $95,000.
In terms of operations, the author suggests that conservative friends wait for a pullback to $89,200–$88,300 to buy in batches with light positions, avoiding chasing highs. Aggressive traders can watch for a golden cross in the 4-hour KDJ and the price returning above the middle band of the Bollinger Bands, which would signal a rebound. It is important to be cautious; if $88,300 is broken with volume, the entire trend will weaken, and it is advisable to reduce positions or set stop losses to control risk.
Giving you a 100% accurate suggestion is not as good as providing you with the right mindset and trend. Teaching someone to fish is better than giving them fish; it is suggested to earn for a moment, but learn to earn for a lifetime!
Writing time: (2025-12-11, 18:10)
(Written by - Master Says Coin) Disclaimer: Online publication has delays; the above suggestions are for reference only. Investment carries risks; proceed with caution!
免责声明:本文章仅代表作者个人观点,不代表本平台的立场和观点。本文章仅供信息分享,不构成对任何人的任何投资建议。用户与作者之间的任何争议,与本平台无关。如网页中刊载的文章或图片涉及侵权,请提供相关的权利证明和身份证明发送邮件到support@aicoin.com,本平台相关工作人员将会进行核查。