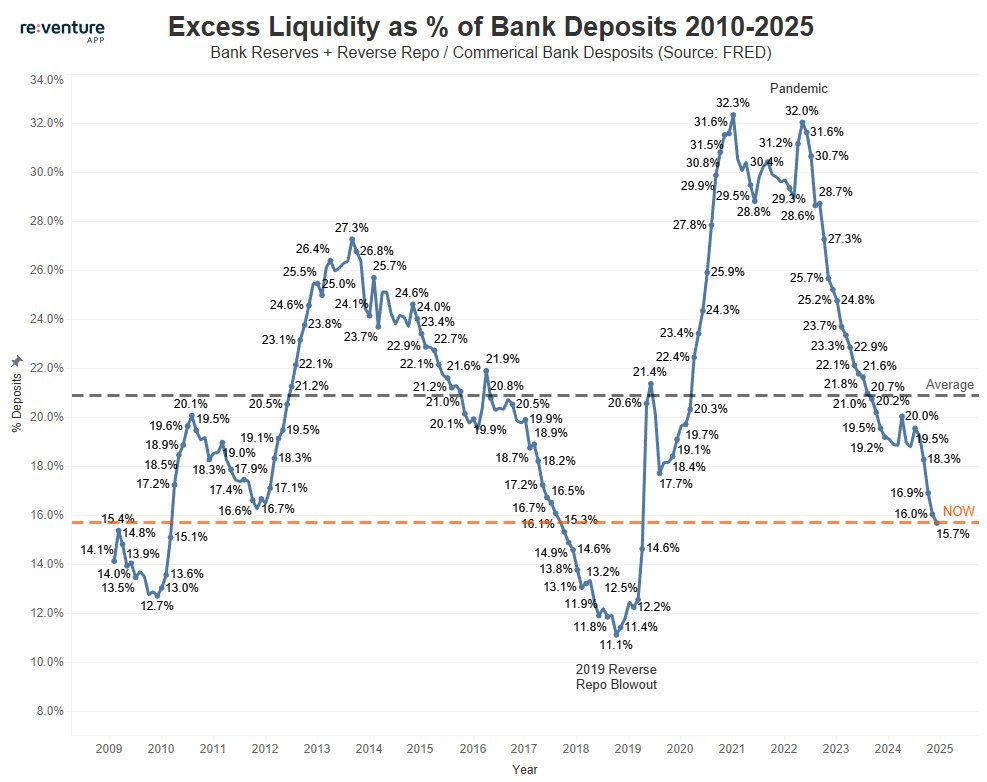
The chart below is called "Percentage of Excess Liquidity to Bank Deposits," which is a very interesting indicator that can be understood as a barometer of market liquidity conditions. The recent injection of $40 billion per month by the Federal Reserve into the market is essentially aimed at addressing liquidity pressure.
From the chart, we can see that it has already fallen below the gray dashed line average (approximately 20.6%) and is now at a historical low of around 15.7%. Historically, every time liquidity rebounds, it tends to bring value recovery to risk assets.
Looking back at the past 15 years 🧐:
2009-2013: Early QE, liquidity gradually accumulates. After the financial crisis, the Federal Reserve initiated QE, and bank reserves began to increase, with the proportion of excess liquidity steadily rising from 12.7% to over 20%.
2014-2018: End of QE and balance sheet reduction, liquidity moderately declines. The Federal Reserve stopped purchasing bonds in 2014 and began "balance sheet reduction" (reducing the size of the balance sheet) in 2017. The growth rate of liquidity slowed, and due to inertia, there was even a slight decline in 2018-2019, ultimately dropping to a low of 11.1% in September 2019, triggering a "repo crisis."
2020-2021: Pandemic QE, liquidity floods the market. In response to the pandemic shock, the Federal Reserve restarted unlimited QE, leading to a sharp expansion of the balance sheet, with bank reserves and reverse repo balances surging. The proportion of excess liquidity peaked at 32.3% in 2021, flooding the market with "excess" funds, causing various assets to skyrocket.
2022-2024: Interest rate hikes and balance sheet reduction, liquidity rapidly contracts to combat high inflation. The Federal Reserve began an aggressive interest rate hike cycle and simultaneously implemented "quantitative tightening" (QT), which involves stopping the reinvestment of maturing bonds and allowing them to naturally exit the balance sheet. This led to a significant decline in bank reserves, with the proportion of excess liquidity dropping from a high of 32% to around 19.5% by the end of 2024, approaching historical average levels.
2025-2026: Liquidity is beginning to bottom out and rebound. Current data shows 15.7%, below the historical average line (20.6%) and lower than the end of 2024 levels. This indicates that after more than two years of tightening, the liquidity in the banking system has returned to a relatively "tight balance" state, even appearing slightly tense.
Since liquidity has bottomed out, combined with the Federal Reserve's monthly $40 billion repo actions starting in December, there is no need to be overly pessimistic. A liquidity rebound is a high-probability event in the long term! Winter has come; how far can spring be? 🧐
免责声明:本文章仅代表作者个人观点,不代表本平台的立场和观点。本文章仅供信息分享,不构成对任何人的任何投资建议。用户与作者之间的任何争议,与本平台无关。如网页中刊载的文章或图片涉及侵权,请提供相关的权利证明和身份证明发送邮件到support@aicoin.com,本平台相关工作人员将会进行核查。


