#
Ethereum #Bitcoin #Ethereum Real-time Analysis #Bitcoin Real-time Analysis #
Hello everyone, I am Lao Lü. The analysis for both cryptocurrencies is generally consistent with our previous assessments, but the short-selling points have been somewhat limited. Last time, we detailed the implications of interest rate hikes or no hikes. If there is a rate hike, the price will initially drop and then rise; if there is a rate cut, the price will spike and then fall. We provided specific short-selling prices, but it seems the market makers did not push the price very high and were eager to take profits. After a slight breakout for both cryptocurrencies, they have been gradually offloading in the past two days, which is quite different from gold. Therefore, from a technical standpoint, the stability of these cryptocurrencies is not as strong as that of gold. We previously stated clearly that gold has a daily support level above 4111, and it has been approaching previous highs recently, driven by silver. A continued breakout to new highs seems inevitable, especially since there has been a significant bullish weekly candle. Many people are asking what is stopping gold; domestically, we are looking at 2000, as the current price itself is a luxury. Since ordinary people cannot participate, why not continue to push it higher? Being bullish is a kind of belief, just like five years ago when people would still ask you: Do you believe Bitcoin will rise to 100,000?
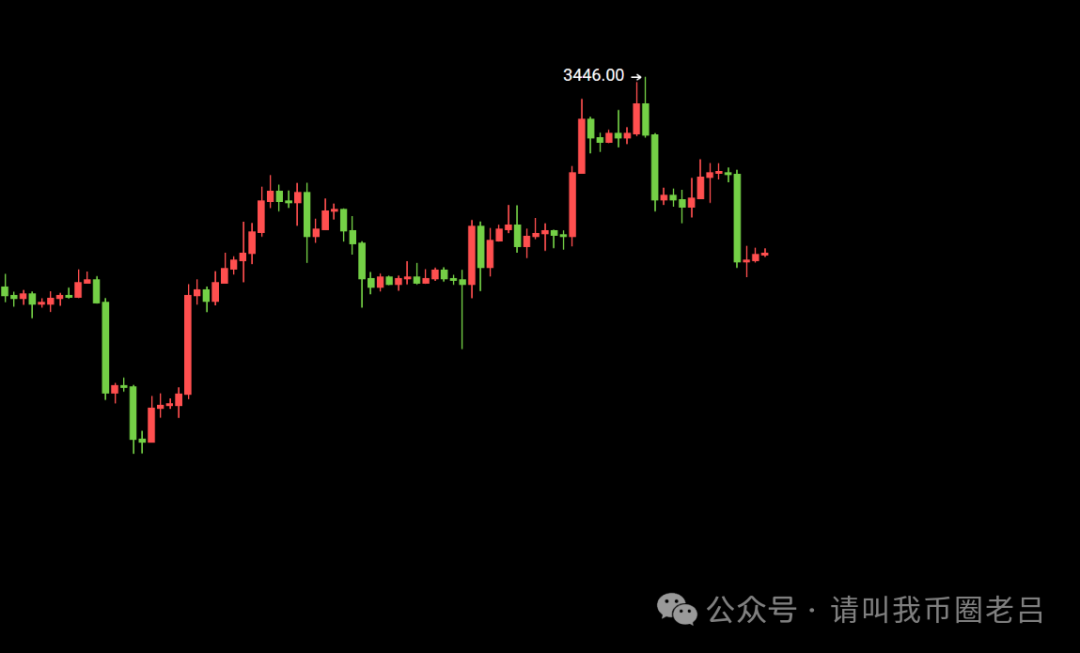
For Ethereum, we mentioned a bit in the previous article. If it breaks higher first, the bullish positions below must be canceled. Therefore, sometimes changes in patterns can also affect the shifts between bullish and bearish positions; we cannot operate in both directions. The article is fixed, but the price movements are constantly fluctuating, which affects the timeliness of the article. We are currently in a tug-of-war between bulls and bears at the weekly and monthly levels, so both sides are not continuous. The weekly line closes once a week, and the monthly line only once a month, so the space for movement is naturally larger. The weekly outlook is bullish, while the monthly still indicates a drop! This leads to more intense fluctuations. If we follow the previous daily bottoming rebound trend, and the current price is testing the bottom, we should continue to be bullish because the price will gravitate towards whichever side it is closer to, rather than being overly bullish or bearish. Both the weekly and monthly charts are in a range. Based on the weekly closing, next week should be the first time the weekly line stands above the moving average system, which will likely push the price up again, initially targeting the 3540-3620 range. Additionally, we need to pay attention to the dividing line for bulls and bears today: if the price breaks above 3100 with a strong bullish candle, we will look bullish. Overall, it is simple: either a small pullback to look bullish or wait for a breakout to look bullish. However, today is still Saturday, so the fluctuations won't be large; we can just trade back and forth in the short term. Recently, our internal short-term strategy has achieved seven consecutive victories without any losses, and I believe our internal students can see this. Although the number of participants is not large, our team continues to grow, and I appreciate everyone's support along the way. We will definitely continue to work hard and maintain stable output. In the future, we need to focus on the support level below: the 3000 line, which the bulls must not break. If a large bearish candle closes below, we will primarily focus on shorting, with 2900 as the bullish starting point. The last low of 3011 serves as the support level, which is why we previously lowered our target. At any time reaching this position, we should go long. Currently, this viewpoint remains unchanged, but yesterday we already tested this position nearby. If we continue to approach this position, the bullish mindset remains.
Ethereum 3020-3030 long
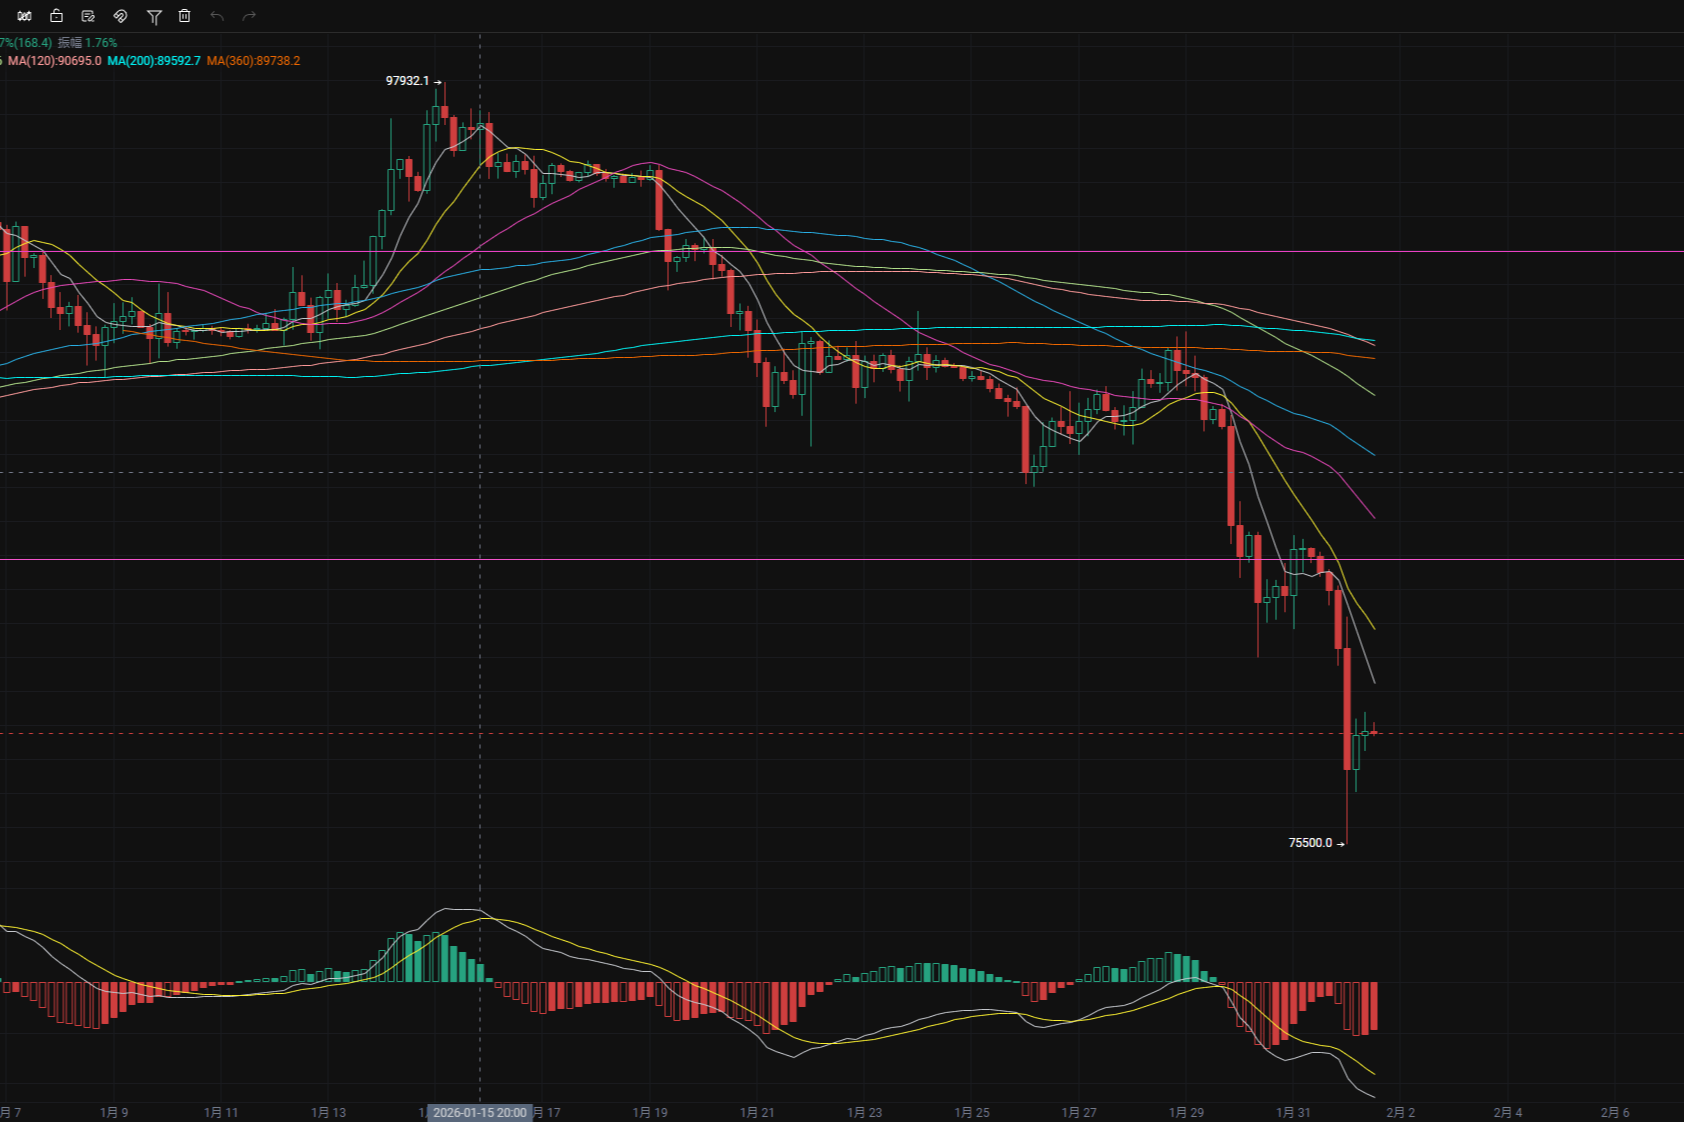
Bitcoin: We previously set a long position at 91500, and the entry was perfect. Driven by data, it surged by 3000 USD. For the recent trend, I think the momentum is decent, but it hasn't reached the expected heights; the market makers are still a bit hesitant and eager to exit! They have mentioned rate cuts, yet they are running so fast. Compared to gold, it really lacks some momentum! We should learn from gold because Bitcoin is currently moving within the range of 94500-89000, so the significance of building positions is not great, and the price fluctuations are not as pronounced as Ethereum. I suggest waiting and observing. Today, we will only discuss the technical point of the precise long entry at 91500 from the previous article for everyone's learning. On the four-hour chart, connecting the highs from December 4 and December 8 gives us a resistance line. After the price breaks above with a strong bullish candle, a pullback towards this line is our point to continue going long, which is around 91500. Additionally, 91500 is the 0.618 of the last upward move, and the technical points for both directions overlap. In the next couple of days, Bitcoin is likely to experience significant breakthroughs in both directions, so be sure to pay attention. The daily chart has already closed, indicating a major market movement. Below, we only provide a defensive long position.
Bitcoin 84700 long
Today: Written by Lao Lü on December 13, 2025, at 10:05 AM. Please note that all strategies are effective once and should not be reused! Check the text version and specific entry prices in the lower right corner of the image or video.
免责声明:本文章仅代表作者个人观点,不代表本平台的立场和观点。本文章仅供信息分享,不构成对任何人的任何投资建议。用户与作者之间的任何争议,与本平台无关。如网页中刊载的文章或图片涉及侵权,请提供相关的权利证明和身份证明发送邮件到support@aicoin.com,本平台相关工作人员将会进行核查。