Odaily specially invited market analyst Conaldo, a master's degree holder in financial statistics from Columbia University in the United States, has focused on quantitative trading in the U.S. stock market since college and has gradually expanded to Bitcoin and other digital assets. He has built a systematic quantitative trading model and risk control system in practice; he possesses keen data insights into market fluctuations and is committed to continuously delving into the professional trading field, pursuing stable returns. He will deeply analyze changes in BTC technology, macroeconomics, and capital flow weekly, review and showcase practical strategies, and forecast significant events worth noting in the near future for reference. 
Core Summary of the Weekly Trading Report:
• The rebound market has entered its final stage after three consecutive weeks, with bullish momentum clearly weakening. Technically, the market is facing a key resistance level, and a short-term retracement to lower support may be imminent, possibly leading to a second bottoming scenario.
• Last week's trading strictly followed the established strategy, successfully completing three short-term operations, achieving a cumulative return of 6.15%. The following will provide a detailed review of market predictions, strategy execution, and specific trading processes.
I. Bitcoin Market Review for Last Week (12.08–12.14)
- Review of Core Views and Operational Strategies from Last Week:
In the previous weekly report, I clearly pointed out that the price is likely to maintain a range-bound fluctuation and proposed a short-term trading strategy of "shorting on highs and betting on rebounds during deep declines." Below is a review and analysis of the strategy for further optimization reference.
① Review of Market Trend Predictions:
Last week, I divided the market into three zones: 94,200–91,000–87,500–83,500 USD. Next, I formulated corresponding plans based on the market direction.
• Core Resistance Levels:
• First Resistance Zone: 91,000 USD
• Second Resistance Zone: 94,000–96,500 USD
• Third Resistance Zone: 98,500–100,000 USD
• Core Support Levels:
• First Support Level: 85,500–88,000 USD
• Second Support Level: 83,500 USD
• Important Support Level: 80,000 USD
② Review of Operational Strategies:
• Medium-term Strategy: Maintain around 65% medium-term short positions.
• Short-term Strategy: As the market chose to fluctuate upward at the beginning of the week, according to the plan, the shorting strategy A should be selected on highs:
• Opening Position: If the price rebounds to the 91,000–94,200 USD zone and encounters resistance, establish a 15% short position.
• Adding Position: If the price continues to rebound near 98,500 USD and encounters resistance again, add another 15% short position.
• Risk Control: All short positions have stop-loss set above 100,000 USD.
• Closing Position: After the price rebound ends and it runs down, consider taking partial or full positions when resistance appears near the support level to realize profits.
- Last week, three short-term operations were successfully completed according to the established plan (Figure 1), achieving a cumulative return of 6.93%. The specific trading details and review are as follows:
Bitcoin 30-Minute K-Line Chart: (Momentum Quantitative Model + Spread Trading Model)
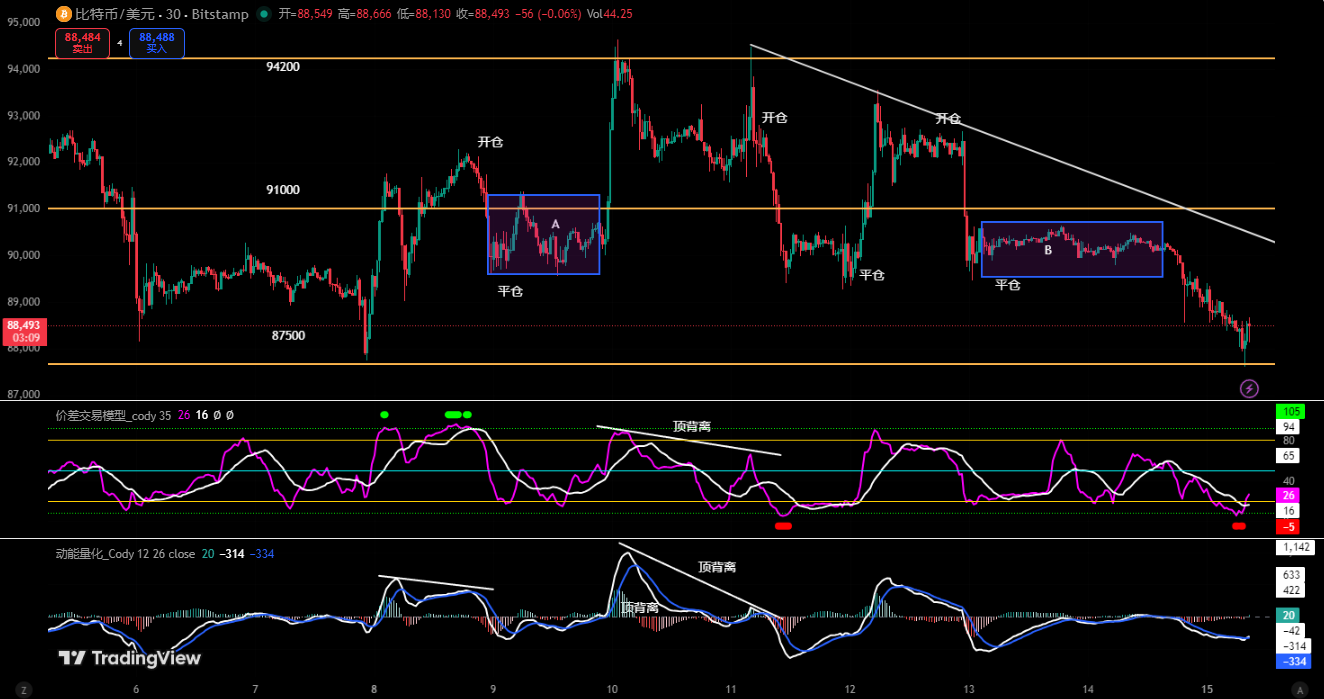 Figure 1
① Summary of Trading Details:
Trade Order Entry Time (UTC+8) Opening Price Position Direction Closing Time (UTC+8) Closing Price Return Rate
First December 8 20:30 91,877 USD 15% Short December 9 04:30 90,477 USD +1.55%
Second December 11 07:30 92,154 USD 15% Short December 12 01:30 90,083 USD +2.30%
Third December 12 20:00 92,425 USD 15% Short December 13 06:30 90,349 USD +2.30%
② Review of Short-term Trading:
• First Trade (Profit 1.55%): Adhering to the "shorting on highs" approach. After the price hit the key level of 94,200 USD and encountered resistance, the spread trading model and momentum quantitative model triggered a top signal, decisively establishing a 15% short position at 91,877 USD, and ultimately realizing profits near the previous low support. Utilizing the principle of multi-indicator resonance improved the success rate of the trade.
• Second Trade (Profit 2.30%): "Rebound Short" mode. After the price hit 94,200 USD and encountered resistance, the K-line formed a "strong top divergence" pattern, and the two models resonated again, so a 15% short position was established at 92,154 USD as planned, successfully capturing the subsequent pullback wave and realizing profits near 90,083 USD.
• Third Trade (Profit 2.30%): "Rebound Short" mode. After the price hit 94,200 USD and encountered resistance, it showed a narrow fluctuation trend, with the price being suppressed by a short-term downward trend line, and bullish momentum gradually weakening. When the two models resonated and issued a signal, a short position was decisively opened at 92,425 USD with a 15% position. When it fell to the support level and a resistance signal appeared, profits were actively realized.
③ Analysis of Key Decision Nodes:
• The forward-looking judgment of the trend provided a key basis for decision-making and risk control in short-term trading, significantly increasing the win rate of trades.
• Capturing technical reversal signals at key resistance levels, using the principle of multi-model resonance to enhance reliability, and locking in profits near support levels.
- Review of Core Bitcoin Data from Last Week:
• Opening Price: 90,406 USD
• Lowest Price: 87,607 USD (Sunday)
• Highest Price: 94,652 USD (Tuesday)
• Closing Price: 88,164 USD
• Price Change: Weekly decline of 2.48%, maximum fluctuation of 8.04%
• Trading Volume: 9.859 billion USD
• Trend: After a high surge, it turned into a downward fluctuation, with the weekly line forming a bearish K-line with an upper shadow.
- Review of Actual Market Trends from Last Week:
Last week, Bitcoin's trend exhibited a typical "low-volume surge followed by a downward fluctuation" pattern. The week ultimately closed with a bearish K-line with an upper shadow, down 2.48%, but with a fluctuation of 8.04%, indicating fierce competition between bulls and bears. Specifically, the market continued to rebound at the beginning of the week, reaching the weekly high of 94,652 USD mid-week before facing pressure and weakening, entering a fluctuating downward rhythm. In the latter half of the week, the market shifted to a downward fluctuation trend, with prices gradually probing down to around 87,607 USD, closing near the lowest price, ultimately forming a bearish K-line with a long upper shadow for the week, down 2.48%. It is worth emphasizing that the price trajectory throughout the week perfectly aligned with the fluctuation framework I outlined last week. Moreover, the mid-week high of 94,652 USD was only 452 USD away from the previously identified upper resistance of 94,200 USD, with an error of less than 0.5%. This once again validates the effectiveness of my technical positioning of key supply and demand areas (resistance and support) and provides a strong basis for continuing the "high sell low buy" strategy within the structure.
II. Systematic Technical Analysis: Comprehensive Assessment Based on Multi-Model and Multi-Dimensional Analysis
Combining last week's market operation, I will comprehensively apply multi-dimensional analysis models to conduct an in-depth analysis of the evolution of Bitcoin's internal structure.
Bitcoin Weekly K-Line Chart: (Momentum Quantitative Model + Sentiment Quantitative Model)
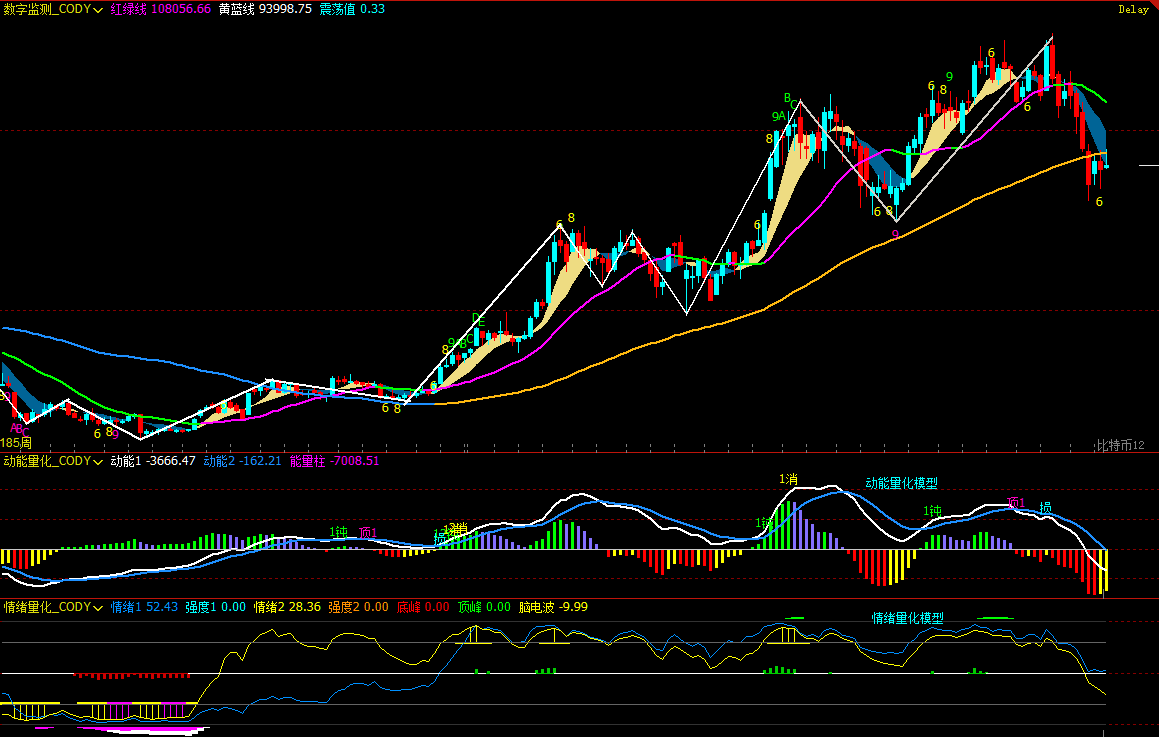
Figure 2
- As shown in (Figure 2), from the weekly chart analysis:
• Momentum Quantitative Model: After last week's market trend, the two momentum lines continued to decline and both crossed below the zero axis. This is typically viewed as a technical signal of strengthening bearish forces and a market turning bearish at the weekly level.
Momentum Quantitative Model Indicates: Price Decline Index: High
• Sentiment Quantitative Model: The blue sentiment line value is 52.43, with an intensity of zero; the yellow sentiment line value is 28.36, with an intensity of zero, and the peak value is 0.
Sentiment Quantitative Model Indicates: Price Pressure and Support Index: Neutral
• Digital Monitoring Model: No digital signals are currently displayed.
The above data indicates: Bitcoin is in a downward trend, and the weekly level has entered a bearish market.
Bitcoin Daily K-Line Chart:
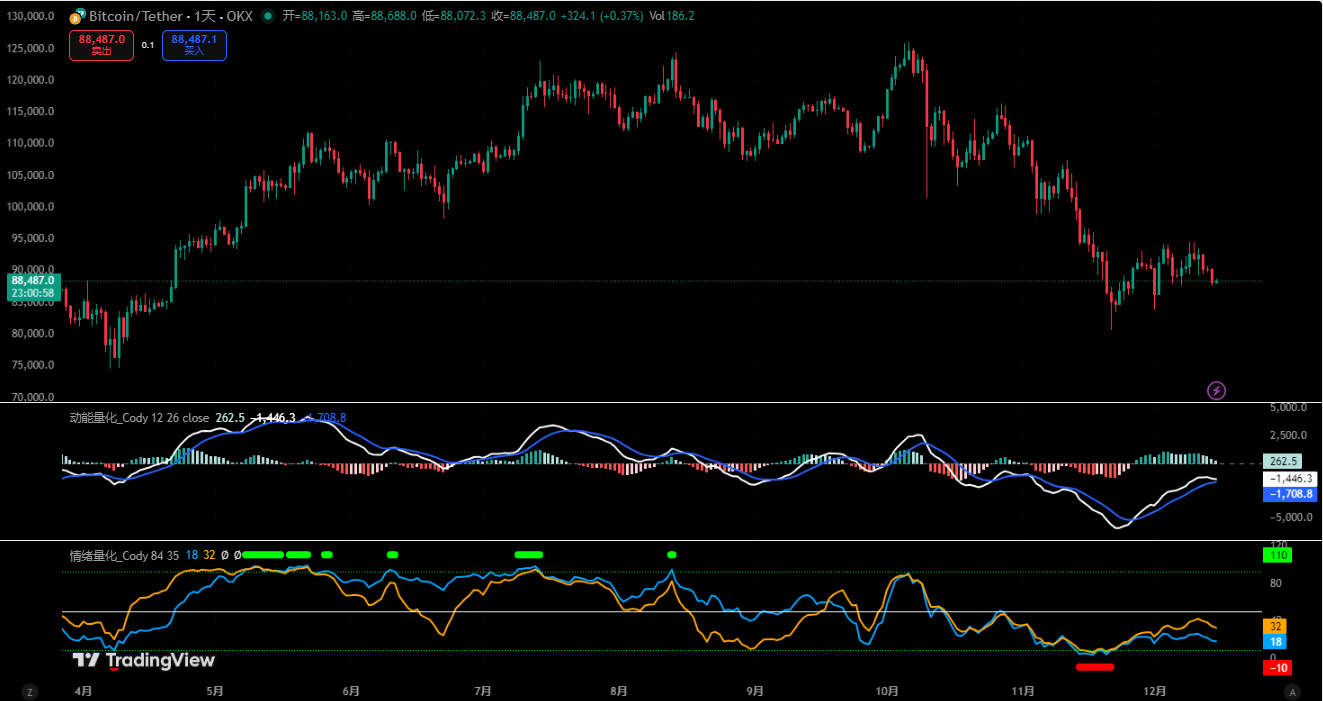
Figure 3
- As shown in (Figure 3), from the daily chart analysis:
• Momentum Quantitative Model: After a week of rebound, the two momentum lines continued to rise below the zero axis, gradually approaching the zero axis. However, the first momentum line has started to flatten and is gradually approaching the second line, with the energy bars gradually shortening compared to previous days.
Momentum Quantitative Model Indicates: Bullish Rebound Momentum is Gradually Weakening, and the Two Momentum Lines are About to "Death Cross."
• Sentiment Quantitative Model: After last week's Sunday close, the blue sentiment line value is 18, with an intensity of zero; the yellow sentiment line value is 32, with an intensity of zero.
Sentiment Quantitative Model Indicates: Pressure and Support Index: Neutral
The above data suggests: The daily level is in a bearish market, and the oversold rebound trend is nearing its end.
III. Market Forecast for This Week (12.15~12.21)
After three consecutive weeks of oversold rebounds (21 days as the time window for trend changes), bullish momentum has clearly weakened, and the market is facing a directional choice. Currently, the price has encountered resistance in the key resistance zone and is expected to primarily fluctuate and adjust this week. It is essential to closely observe the 87,500–89,000 USD area; if it effectively breaks down, the market may initiate a second bottoming.
Core Resistance Levels:
• First Resistance Zone: 92,500–94,500 USD
• Second Resistance Zone: 96,500–98,500 USD
• Important Resistance Zone: 100,000 USD
• Core Support Levels:
• First Support Level: 87,500–89,000 USD
• Second Support Level: 80,000–83,500 USD
• Important Support Level: 74,500–76,000 USD.
IV. Operational Strategy for This Week (Excluding Sudden News Impact) (12.15–12.21)
Medium-term Strategy: Maintain around 65% medium-term positions (short).
Short-term Strategy: Utilize 30% of the position, set stop-loss points, and look for "spread" opportunities based on support and resistance levels (using 60 minutes/240 minutes as the operating cycle).
I judge that this week will primarily focus on fluctuating adjustments, with the 87,500–89,000 USD area becoming an important watershed. Therefore, for the gains and losses in this area, the short-term operations will execute the following two plans:
• Plan A: If the support in this area is effective:
• Opening Position: If the price rebounds to the 92,000–94,200 USD area and encounters resistance, establish a 30% short position.
• Risk Control: Set the stop-loss for the short position above 95,000 USD.
• Closing Position: When the price drops to the 87,500–89,000 USD area and shows resistance, close all short positions to realize profits.
• Plan B: If this area is effectively broken:
• Opening Position: If the price breaks below this area and is confirmed, establish a 30% short position.
• Risk Control: Set the stop-loss above 89,000 USD.
• Closing Position: When the price drops to the 80,000–83,500 USD area and shows resistance, close all short positions to realize profits.
V. Special Reminders
When opening a position: Immediately set the initial stop-loss level.
When profits reach 1%: Move the stop-loss to the opening cost price (break-even point) to ensure capital safety.
When profits reach 2%: Move the stop-loss to the position of 1% profit.
Continuous Tracking: After that, for every additional 1% profit, move the stop-loss up by 1% to dynamically protect and lock in existing profits.
(Note: The above 1% profit trigger threshold can be flexibly adjusted by investors based on their own risk preferences and the volatility of the asset.)
VI. Macroeconomic Outlook and Key Events for This Week (12.15~12.21)
- Federal Reserve Officials Speak Intensively
Several core and potential voting members will speak about the economic outlook, and their wording will influence the market's reassessment of the "pace and sustainability of interest rate cuts," especially regarding long-term interest rate expectations.
- Inflation Data Becomes a Key Turning Point
The U.S. November CPI and core CPI data released on Thursday will be the core variable determining the direction of the dollar and interest rates.
· If CPI is below expectations (currently around 3%, still above the 2% target), it will further validate the rationale for a rate-cutting cycle, potentially putting pressure on the dollar and providing breathing space for risk assets;
· If inflation rises again, it may weaken market confidence in sustained easing, pushing the dollar to rebound and suppressing the performance of overvalued assets.
- Employment and Inflation Expectation Indicators Provide Additional Verification
Initial jobless claims and the University of Michigan consumer inflation expectations data will examine whether the downward trend in inflation has sustainability from both "actual and expected" perspectives.
Financial markets are ever-changing, and all market analyses and trading strategies need to be dynamically adjusted. All views, analytical models, and operational strategies mentioned in this article stem from personal technical analysis and are for personal trading logs only, not constituting any investment advice or operational basis. The market carries risks; investment should be cautious, DYOR.
免责声明:本文章仅代表作者个人观点,不代表本平台的立场和观点。本文章仅供信息分享,不构成对任何人的任何投资建议。用户与作者之间的任何争议,与本平台无关。如网页中刊载的文章或图片涉及侵权,请提供相关的权利证明和身份证明发送邮件到support@aicoin.com,本平台相关工作人员将会进行核查。