Will the MACD underwater death cross at the daily level for Bitcoin and Ethereum break the new low of 2,600? Or will it break the new low of 80,000 USD? Let's analyze the market around this theme.
Where to go long and where to short for a higher win rate?
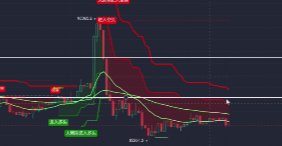
Today, we focus on December 18, 2025. First, let's look at Ethereum. Ethereum has been in a continuous decline for 8 days, dropping 19% in a week, erasing all the gains from the past week.
At the same time, the MACD at the daily level has shown a death cross below the zero axis, indicating that the bears are starting to gain momentum.
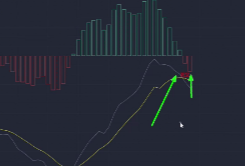
At this point, will it create a new low? We need to peel this back layer by layer. First, last night it dropped to a low of 2,789, and there was no strong rebound formed. Looking at the 15-minute chart, how long did it linger? From the 15-minute perspective, it did not form a quick micro-rebound like it did when it dropped to 2,780; it was soft and limp, like an 80-year-old lady.
From the current structure, if we want to go long, we need at least a pullback to around 2,780 to enter. Would you dare to hold a long position at 2,800? If you do, will you face a significant retracement?
Last night's spike was blatantly a trap for longs.
How many brothers will be lured into going long? It was clearly stated yesterday to short when it rises and go long when it falls; we prefer to wait in a position that is neither up nor down. Therefore, I have already exited my long position around the average price of 2,800 at 2,830 today. If we want to go long, where should we do it? For a simple long, we should wait for a pullback to around 2,700 or 2,680.
If we are looking for intraday trades, we will wait around 2,700, 2,718, and also 2,692, and 2,660 below.
We cannot rule out the possibility of it testing the previous lows of 2,700 and 2,660 in this structure.
Of course, will it hit 2,692? We can stagger our entries at 2,718, 2,690, and 2,660, controlling our positions well. Just break it down and build our positions, right?
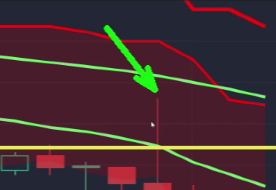
Where to short? Currently, the daily level resistance for shorts is at 2,896, which can be used as a reference, and also at 2,969.
For shorts, consider entering at this level of 2,900-2,969. How to trade Bitcoin? At the daily level, Bitcoin has a double bearish engulfing pattern. From the naked candlestick structure, it looks bearish, but it has also reached a certain bottom.
Below, there are three spikes supporting it, and its MACD shows a death cross below the zero axis.
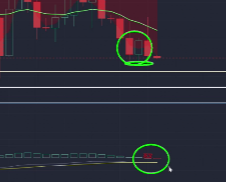
We need to observe whether this spike will rebound here in the next couple of days, forming a bullish candle after a bearish one, or if it will create a new low. It is preparing to test the low points of 84,000-83,000, specifically 82,846. If I want to wait for a long, I would wait around 82,800; if I am more aggressive, I would go for a short-term long at 84,530. If I am more conservative, I would wait around 81,000 or 81,200, which is near the previous low where the MACD's death cross also formed a response.
After all, if the death cross does not pull back, it would not do justice to that death cross. So if we are set on going long, we can be generous around 82,800, 81,000, 81,300, and 81,500. For a more aggressive entry, we can consider 84,530. If we get a chance with a spike down, we will enter at that level; if not, we will wait for a breakout. It’s simple: if it breaks above this high point, breaking 86,070.
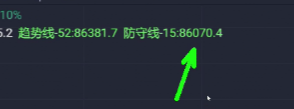
If it breaks and retests without breaking the level, we will go long. Either we wait for a breakout and retest to go long, or we wait for it to drop near the previous low to go long. It’s that simple; we will wait to short again. For example, if it spikes up to over 90,000, a safer short entry would be around 90,363, and a more conservative entry would be around 88,000 or 88,760. The next high point is around 88,700, and for aggressive shorts, it would be at this small peak.
But then again, if it reaches over 87,000, wouldn’t the 15-minute chart turn from bearish to bullish? Can we trade at this level? We need to observe in smaller time frames.
For more strategies, follow the public account BTC-ETH Crypto.

免责声明:本文章仅代表作者个人观点,不代表本平台的立场和观点。本文章仅供信息分享,不构成对任何人的任何投资建议。用户与作者之间的任何争议,与本平台无关。如网页中刊载的文章或图片涉及侵权,请提供相关的权利证明和身份证明发送邮件到support@aicoin.com,本平台相关工作人员将会进行核查。