On December 19, 2025, a key "Golden Cross" signal appeared on the technical chart of the US Dollar Index.
What is particularly special about this Golden Cross is that it occurred against the backdrop of a weakening long-term trend line, marking the 16th occurrence of such a rare signal since 1970. Historical data shows that this type of technical pattern often indicates a strengthening of the dollar in the following months, which can have a chain reaction effect on major assets such as US stocks and crude oil, providing important clues for the market landscape in early 2026.
1. The 39th "Golden Cross" Emerges
After the close on December 19, 2025, the US Dollar Index triggered a closely watched technical signal on its chart: the 50-day moving average crossed above the 200-day moving average, forming a bullish pattern known as a "Golden Cross."
● Nature of the Signal: This signal is considered an indicator of a mid-term trend reversal in the market. The fundamental logic is that the short-term average crossing above the long-term average indicates that the recent market average cost is rising faster than the long-term cost, suggesting that buying power is gathering and the trend may shift from weak to strong.
● Historical Statistical Significance: According to statistics from the Bank of America Merrill Lynch technical strategy team, this is the 39th occurrence of a "Golden Cross" signal for the US Dollar Index since 1970.
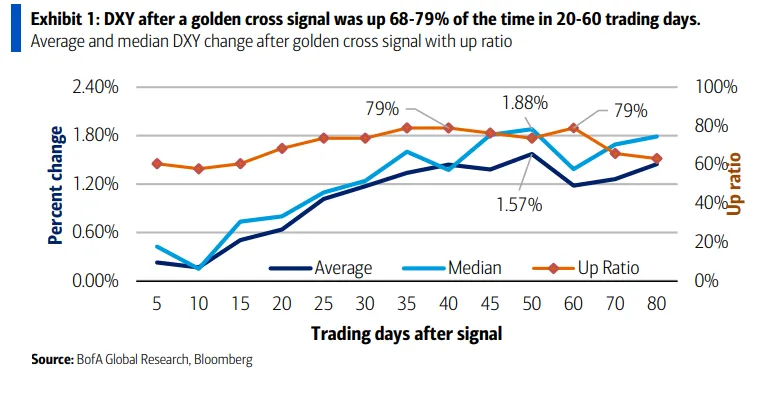
Historical backtesting shows that the appearance of this signal is not random noise. Within 20 to 60 trading days (approximately 1 to 3 months) after the signal appears, the probability of the US Dollar Index rising ranges between 68% and 79%. Among these, the probability of an increase is highest at 35-40 trading days and 60 trading days later, reaching 79%.
During this period, the average increase of the US Dollar Index is about 1.22%, with the median increase even higher, around 1.40%. This statistical pattern provides historical support for a potential technical rebound of the dollar in the first quarter of 2026, despite the seasonal weakness typically present in the year-end market.
2. "Weak Golden Cross" in a Downtrend
The reason this "Golden Cross" has attracted particular market attention is not only due to the signal itself but also because of the special market environment in which it occurred.
● Rare Technical Background: This Golden Cross occurred not only with the short-term average crossing above but, more importantly, the 200-day moving average itself is also in a downtrend. This is defined as a "very rare type" — this is the 16th occurrence of a Golden Cross while the 200-day average is declining since 1970.
● Stronger Historical Implications: The historical performance in this special context is stronger than that of ordinary Golden Cross signals. Data shows that when a Golden Cross appears simultaneously with a declining 200-day moving average, the probability of the US Dollar Index rising in the subsequent 15, 25, 35, and 60 trading days is as high as 80% (i.e., out of 15 historical occurrences, 12 saw an increase).
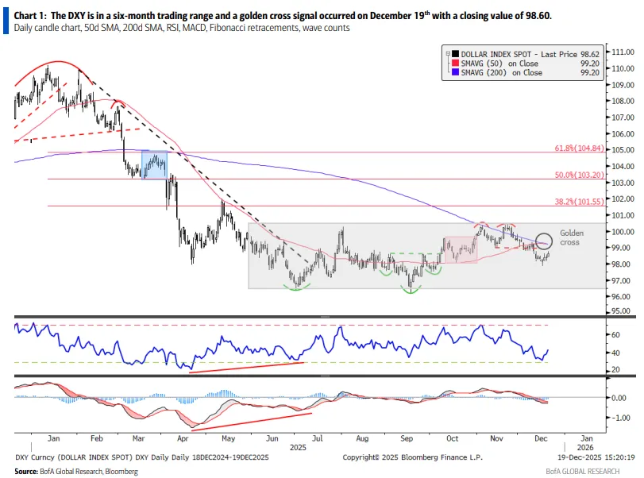
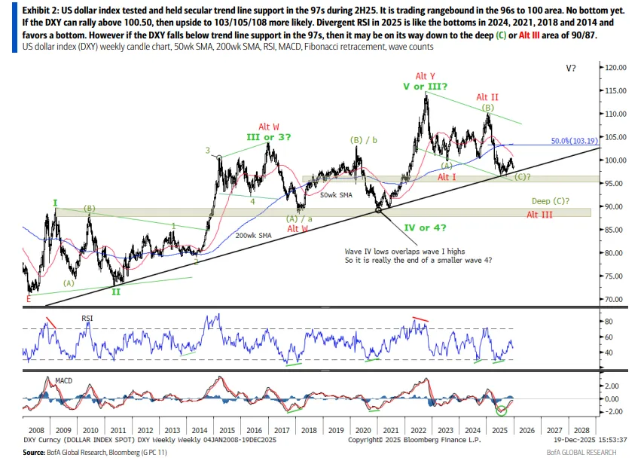
● Historical Reference and Risks: The last time a similar dual moving average downtrend Golden Cross occurred was in 2004. At that time, the US Dollar Index experienced about six months of sideways fluctuations, and market volatility significantly increased, with the Golden Cross and the opposite "Death Cross" appearing in quick succession. This warns investors that while the current signal suggests a high probability of an increase, it does not necessarily indicate a smooth upward trend; market fluctuations are also possible. Analysis also points out that the current US Dollar Index is testing the key long-term trend line support in the 97 area, and if it breaks below, it may open up further downside to the 90/87 area.
3. Chain Reactions on US Stocks, Crude Oil, and Other Assets
As the global pricing anchor for assets, the potential changes in the technical trend of the dollar often produce spillover effects, impacting the performance of other major asset classes. Historical data reveals the following correlations:
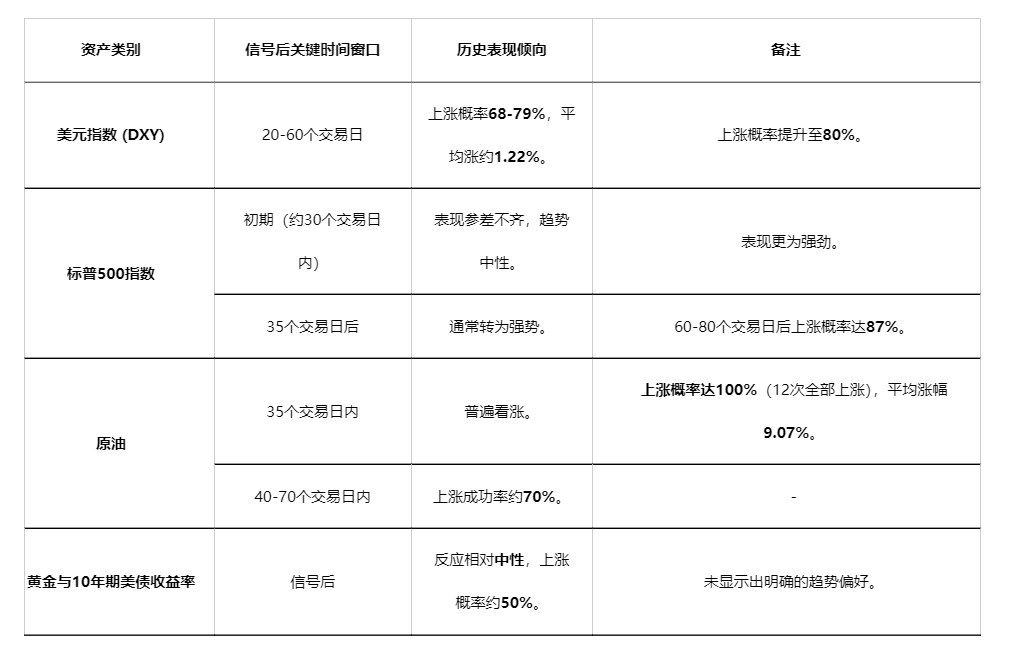
From the table above, we can see:
● Crude oil is the most responsive asset, especially after the occurrence of this special type of Golden Cross, with a historical increase probability of 100%, demonstrating a strong positive correlation.
● US stocks show a lagged response: The S&P 500 index does not immediately follow but tends to strengthen more than a month later, which may reflect the market's digestion of the initial impact of a stronger dollar.
● Divergence in Safe-Haven Assets: Gold and US Treasury yields have not shown a clear direction, suggesting that under the expectation of a strengthening dollar, traditional safe-haven assets may face complex long and short battles.
4. Interplay of Technical Signals and Macro Realities
Although historical technical charts have issued bullish signals, the current fundamental environment facing the dollar is complex, and there are differing views among market institutions that investors need to consider comprehensively.
● Supportive Views from Technical Analysis: Besides Bank of America Merrill Lynch, other institutions have also noted the positive changes in the dollar's technical outlook. DBS Bank's report in December 2025 pointed out that the US Dollar Index has formed a sideways consolidation in the range of 96.50 to 100.30 since June 2025, which may be an "extended bottom," and believes that the dollar's technical outlook has turned bullish. They noted that if the US Dollar Index can break through the key resistance at 100.26, it may further test the 101.55-101.98 area.
● Restraining Factors from the Macro Perspective: At the same time, many macro analyses point out that the dollar faces structural pressures. Goldman Sachs' mid-2025 report suggested that due to three major obstacles — uncertainty in US policy, the trend of global capital diversification, and fiscal concerns — the dollar's "safe-haven attribute" has significantly weakened, and it is more characterized as a "risk currency," with a potential continuation of its weakening cycle. UBS also predicts that in the fourth quarter of 2025, influenced by expectations of US interest rate cuts and a weak labor market, the dollar will continue to exhibit a weak pattern.
● Rational Perspective on Technical Signals: Market experience reminds us that no technical indicator is a "foolproof holy grail." Moving averages are essentially lagging indicators, and Golden Cross signals often confirm changes in trends that have already occurred rather than providing precise forward predictions. Investors should avoid blindly following a single signal and instead make judgments based on a broader fundamental context.
5. The Game in a Key Window Period
In summary, the rare "Golden Cross" that appeared in the US Dollar Index at the end of 2025 undoubtedly injects new variables into the market.
● Core Insights of the Signal: The core value of this signal lies in its probability advantage, suggesting that the likelihood of a technical rebound for the dollar is increasing in the first quarter of 2026 (in the next 20-60 trading days), especially considering that this Golden Cross belongs to a historically higher win-rate "weak background" type.
● Interwoven Long and Short Factors: However, the ultimate direction of the dollar will be the result of a tug-of-war between technical and fundamental forces. The technical momentum for a rebound will directly contend with fundamental factors such as the Federal Reserve's policy path (timing and magnitude of interest rate cuts), the growth differential between the US and non-US economies, and global geopolitical risks.
● Significance for Investors: For market participants, the more important significance of this signal lies in indicating the potential rotation direction of asset allocation. Historical patterns show that if the dollar strengthens as per probability, crude oil and lagging US stocks may become associated assets worth watching. At the same time, investors should closely monitor the US Dollar Index's breakthroughs of the key support around 97 and key resistance around 100.26, as these will be important observation points for determining whether the technical rebound can proceed smoothly.
Join our community to discuss and become stronger together!
Official Telegram community: https://t.me/aicoincn
AiCoin Chinese Twitter: https://x.com/AiCoinzh
OKX benefits group: https://aicoin.com/link/chat?cid=l61eM4owQ
Binance benefits group: https://aicoin.com/link/chat?cid=ynr7d1P6Z
免责声明:本文章仅代表作者个人观点,不代表本平台的立场和观点。本文章仅供信息分享,不构成对任何人的任何投资建议。用户与作者之间的任何争议,与本平台无关。如网页中刊载的文章或图片涉及侵权,请提供相关的权利证明和身份证明发送邮件到support@aicoin.com,本平台相关工作人员将会进行核查。