Welcome to the Qinglan Crypto Classroom. Today, we will analyze BTC's three cycles, including the news aspect:
Technical Comprehensive Analysis
Short Cycle (15 minutes, 1 hour): Weak oscillation with a rebound demand. From the 15-minute and 1-hour candlestick charts, Bitcoin experienced a sharp decline last night (around 22:00 on December 26), dropping from about $89,000 directly to around $86,700, which is quite a significant drop! A large bearish candlestick appeared on the chart, and the trading volume also significantly increased, indicating that there was considerable panic selling at that time. After that, the price has been oscillating in the range of $87,200 to $87,400, trying to stabilize. MA Moving Averages: The short-term moving averages are in a bearish arrangement and pointing downwards after the sharp drop, but in the recent few candlesticks, there are signs of attempting to converge and flatten, indicating that the selling pressure has eased, and both bulls and bears are in a brief stalemate. On the 1-hour chart, the moving average system has also shifted from a bullish arrangement to a bearish arrangement, with MA5 and MA10 both below MA20, confirming the short-term downtrend. MACD: On the 15-minute chart, although the MACD's DIF and DEA are still negative, the DIF line has started to curve upwards, and the histogram has changed from green (bearish strength) to red and is gradually lengthening, suggesting that the momentum for a short-term oversold rebound is accumulating, but it hasn't crossed above the zero axis yet, so we can't say it has completely reversed. The MACD on the 1-hour chart is more pessimistic, with both DIF and DEA still below the zero axis and maintaining a death cross; although the histogram has shortened, the overall bearish sentiment still prevails. RSI: On the 15-minute chart, the RSI has rebounded from the extremely oversold area (around 18) to about 48, providing space for upward correction in the short term. The 1-hour chart RSI is also around 44, not reaching overbought or oversold, but has rebounded from the previous low, which is also a signal of corrective rebound.
Medium Cycle (4 hours): Weak oscillation, bearish strength diminishing. The 4-hour chart shows a more macro short-term trend. On December 22, Bitcoin attempted to break the $90,000 mark but failed to hold it, and on December 26 at 20:00, it experienced a significant pullback, dropping from $88,500 to around $87,100. Currently, the price is hovering near this low, presenting an overall weak oscillation pattern. MA Moving Averages: MA5, MA10, and MA20 are in a bearish arrangement, with MA5 and MA10 both below MA20, which is a typical bearish signal. However, recently MA5 has shown a trend of touching MA20 upwards, but a golden cross has not yet formed, so we need to pay close attention. MACD: DIF and DEA are still operating below the zero axis and maintaining a death cross, indicating that the medium-term is still in a bearish trend. However, although the MACD histogram is negative, its absolute value is decreasing, meaning "green bars are shortening," which suggests that bearish strength is weakening, and a rebound may occur. RSI: The RSI is around 46, in a neutral area, indicating that market sentiment is not extremely pessimistic, but there is no clear bullish advantage.
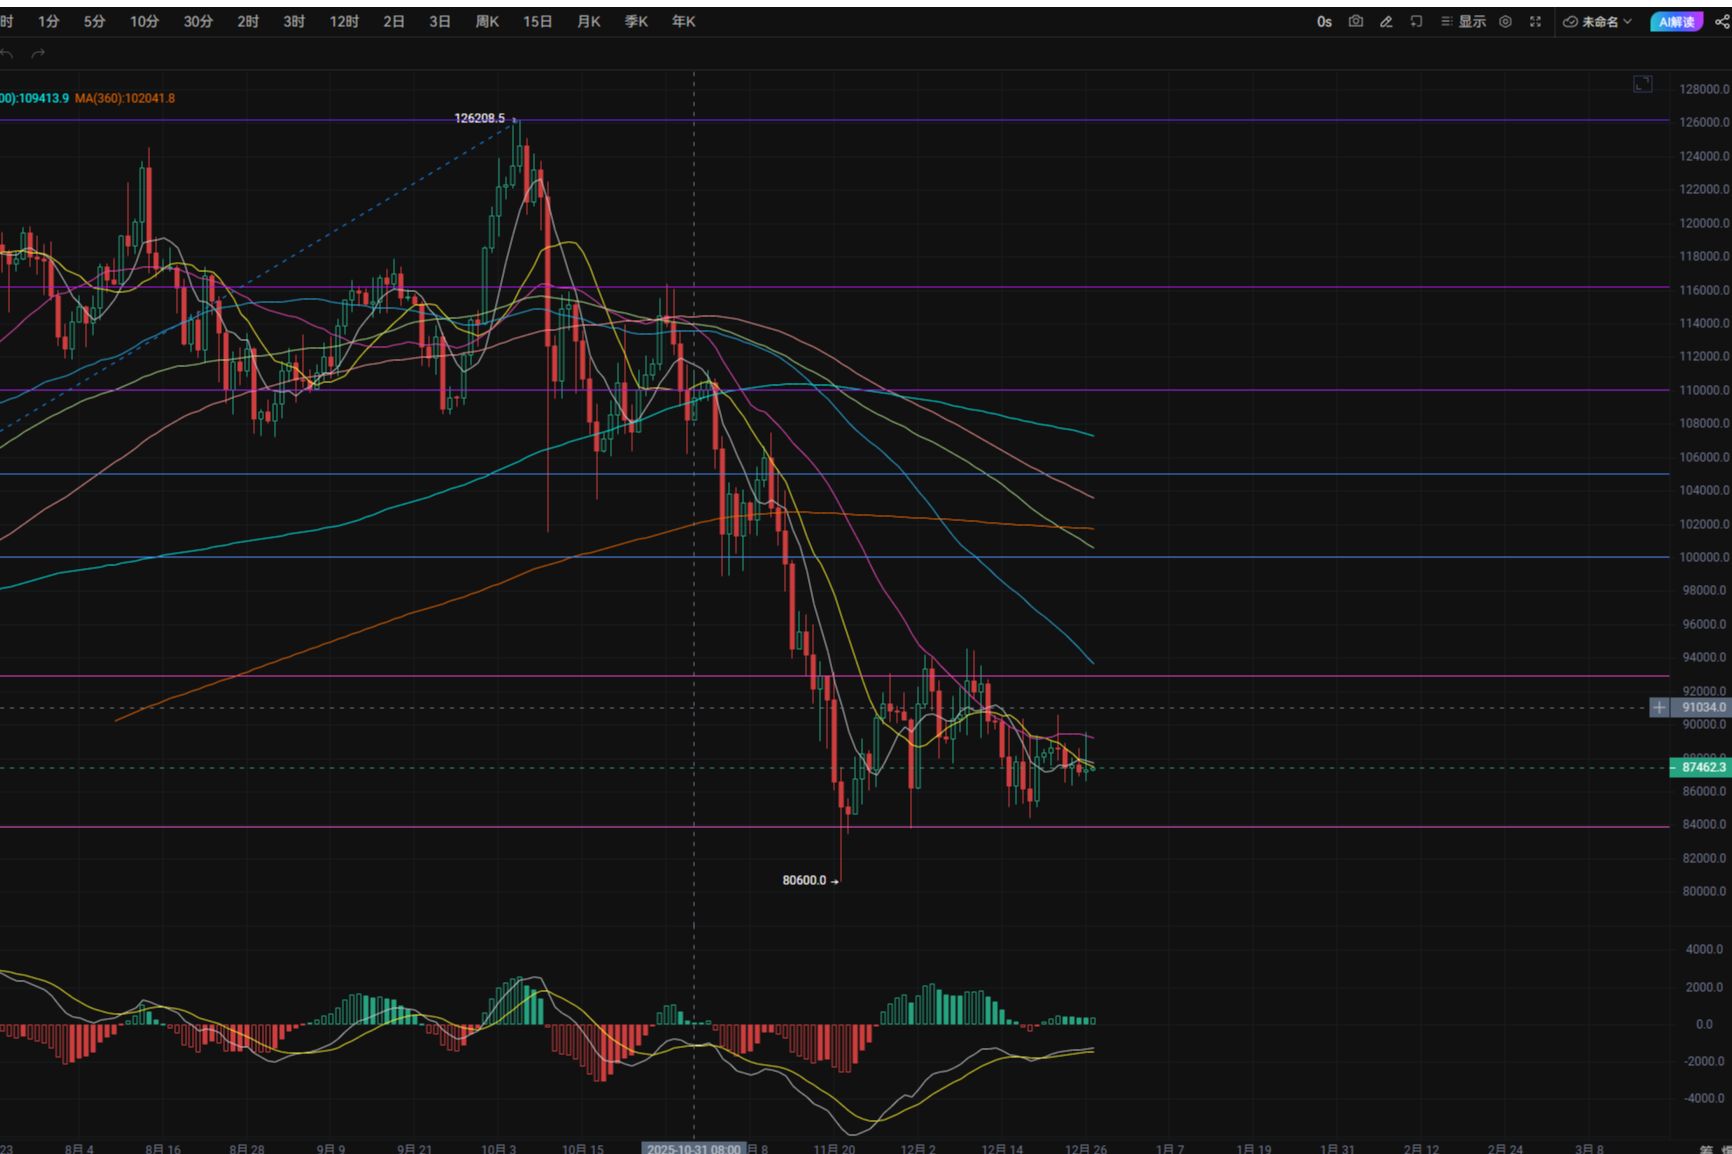
Long Cycle (1 day): Bottoming oscillation, focus on bottom divergence signals. From the daily chart, Bitcoin has been oscillating downwards from over $110,000 at the end of October, entering a bottoming phase in the range of $86,000 to $90,000 after hitting a low of $84,000 in mid-November. Although there have been recent highs, it has not effectively broken through and has returned to the lower edge of the oscillation range. MA Moving Averages: MA5, MA10, and MA20 are in a bearish arrangement, with short-term moving averages below long-term moving averages, clearly indicating that the long-term trend is still downward. However, the distance between the moving averages is starting to narrow, showing a horizontal entanglement, which may indicate that the market is brewing a change, or a consolidation after a long-term decline. MACD: Both DIF and DEA are below the zero axis, but the daily MACD histogram is surprisingly positive and continuously growing, forming a very important "bottom divergence" signal! This means that although the price has not risen yet, the upward momentum technically accumulated is strengthening, and the bearish strength may be at its end. RSI: The daily RSI is around 43, remaining neutral, providing enough room for imagination regarding future trends.
News Combined Analysis Let's take a look at the news aspect, which is like ice and fire! On the short-term bearish side, there are reports saying "Bitcoin is absent from the Christmas market," "The U.S. spot Bitcoin ETF has recently seen continuous net outflows," and "Bitcoin suddenly shows a bear flag pattern and bearish signals, with prices plummeting to $86,000," all of which confirm the short to medium-term downward pressure, especially the withdrawal of institutional funds, which is a blow to market confidence. Additionally, "Fidelity experts predict: Bitcoin and gold may experience an adjustment year in 2026" also dampens the long-term bulls. On the short-term bullish side, however, some analysts say "Bitcoin may challenge the $90,000 mark," believing that bearish strength is weakening and market sentiment is shifting towards buying on dips. At the same time, macro-wise, "the weakening dollar drives gold and silver prices to historical highs," which theoretically is bullish for BTC, but has not yet transmitted to the crypto market. The hot development of the Ethereum ecosystem (such as a surge in trading volume and the RWA wave) will also drive BTC in the long term. Key Resistance: The news also points out "Bitcoin's $100,000 resistance level: new whale costs and key points in market games," indicating that $100,000 will be an important psychological and actual resistance level in the future.
Comprehensive Prediction and Trading Ideas
Based on all our analyses, including the candlestick trends of the 15-minute, 1-hour, 4-hour, and daily charts, the performance of technical indicators, and the latest news, we can draw the following predictions and trading ideas:
Short-term Trend (15 minutes, 1 hour): Weak oscillation. Bitcoin has just experienced a rapid decline, and there is a technical rebound demand in the short term, with bearish strength weakening, but selling pressure still exists above. Medium-term Trend (4 hours): Weak oscillation. The price has not effectively broken through in the medium term and has seen a pullback, but MACD shows that bearish momentum is diminishing, and it is expected to continue oscillating and bottoming. Long-term Trend (1 day): Bottoming oscillation. The daily MACD's "bottom divergence" signal is very noteworthy, indicating that although the price is still oscillating in the bottom area, the buying power below may be accumulating, with potential for upward reversal in the future, but this process requires time and patience.
Key Support and Resistance Levels:
- Short-term Support: The range of $86,600 to $86,800, which is an important defense line after the sharp drop. Below that is $86,100.
- Short-term Resistance: Around $87,500, as well as the MA20 on the 1-hour and 4-hour charts (approximately $87,900 to $87,950), where there will be considerable selling pressure.
- Medium-term Resistance: $89,000 to $90,000.
- Long-term Resistance: $90,500 to $91,000, as well as the $100,000 integer level mentioned in the news.
Possible Reversal Patterns: In the short term, a small double bottom or head and shoulders bottom may form in the $87,000 to $87,500 area to complete a technical repair. The daily MACD bottom divergence is the biggest highlight! If it can be accompanied by a volume increase and effectively stabilize above $88,000, it may gradually form a V-shaped reversal or W-shaped bottom, thus ending the current long-term downtrend. However, this is currently just an early signal, and we need more confirmation, so don't be blindly optimistic.
Trading Ideas: For those trading short-term, if the price can effectively stabilize above $87,400, and the golden cross signal of the 15-minute MACD continues to strengthen, consider taking a light long position with a target of $87,800 to $88,000. Take profits at the resistance level, as the medium-term trend is still weak. If it breaks below $86,600, consider stopping losses to prevent further declines. For those planning medium to long-term positions, the daily bottom divergence is a good signal, but combined with the news, the market still has uncertainties, and there is institutional fund outflow. We can consider gradually building positions near key support levels (such as the $86,000 to $86,500 range) and patiently wait for further confirmation of the daily trend reversal, remembering not to over-leverage. Risk control is crucial: in the case of unclear large-scale trends and short-term volatility, controlling position size and stop-loss is always our top priority to protect our capital!
Finally, Qinglan leaves you with a trading quote: "The market is always right, but your judgment can be wiser. Go with the trend, but also follow your 'heart.' Do not be swayed by emotions, and you can move forward steadily."
免责声明:本文章仅代表作者个人观点,不代表本平台的立场和观点。本文章仅供信息分享,不构成对任何人的任何投资建议。用户与作者之间的任何争议,与本平台无关。如网页中刊载的文章或图片涉及侵权,请提供相关的权利证明和身份证明发送邮件到support@aicoin.com,本平台相关工作人员将会进行核查。