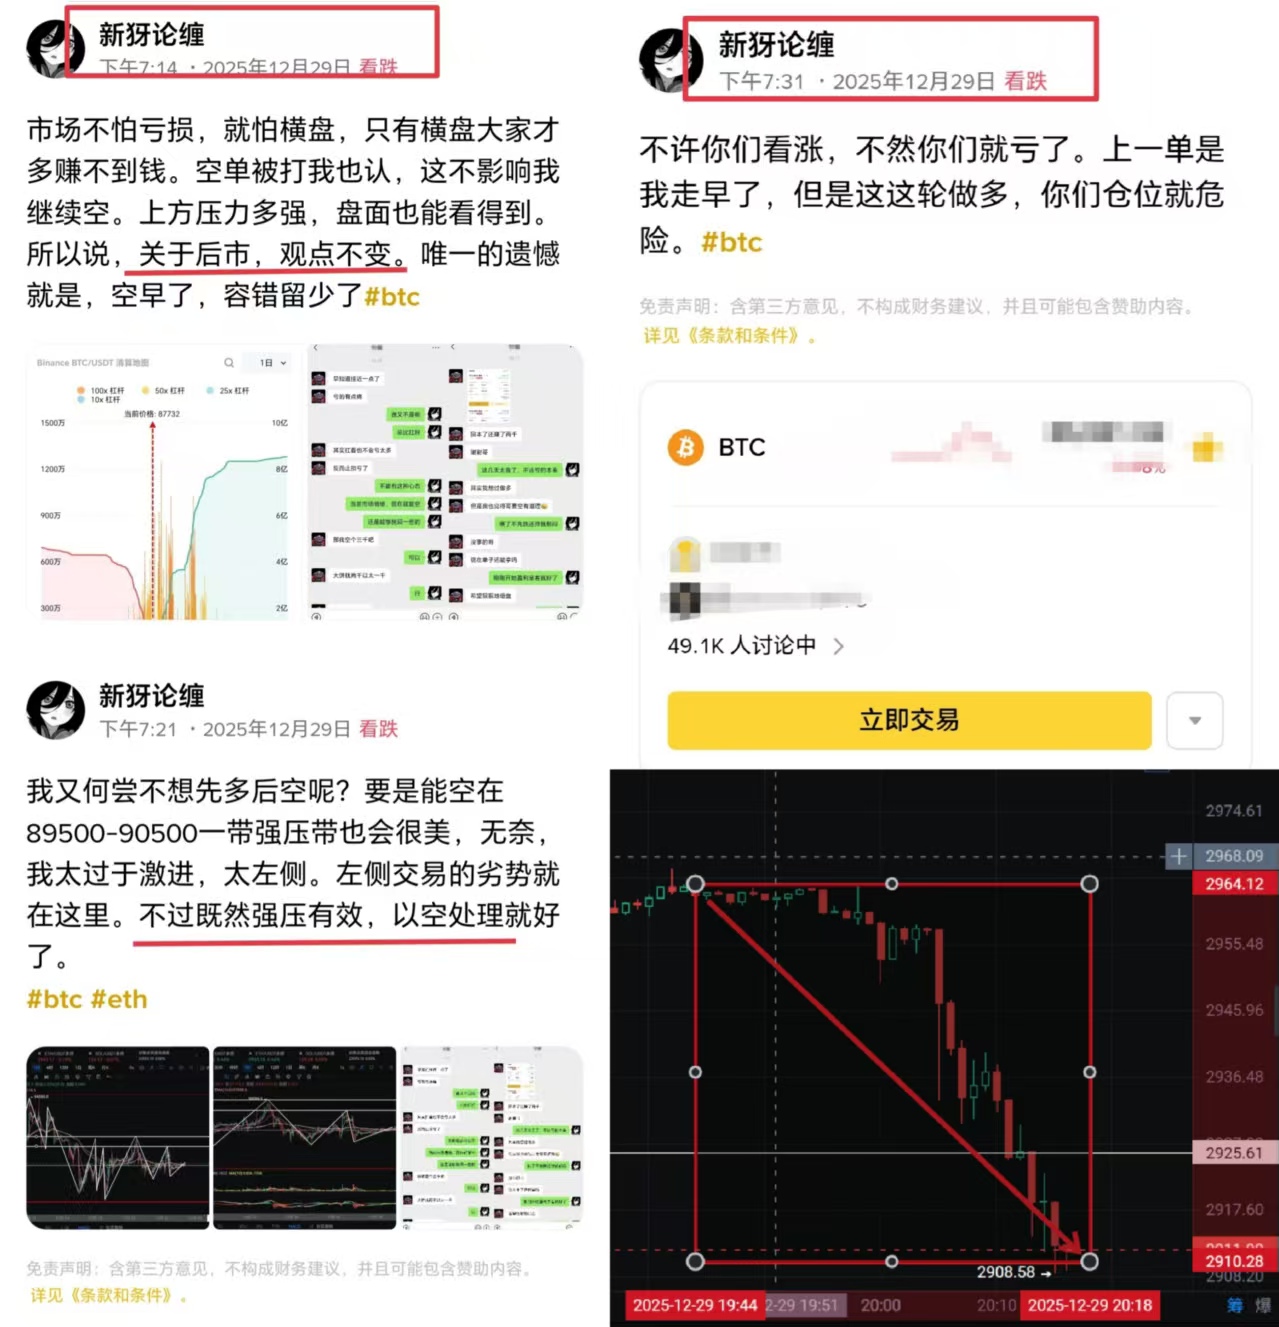
Good evening everyone, I am Xin Ya. First of all, I regret that yesterday's short position was stopped out, but due to effective pressure, we have already made a comeback today.
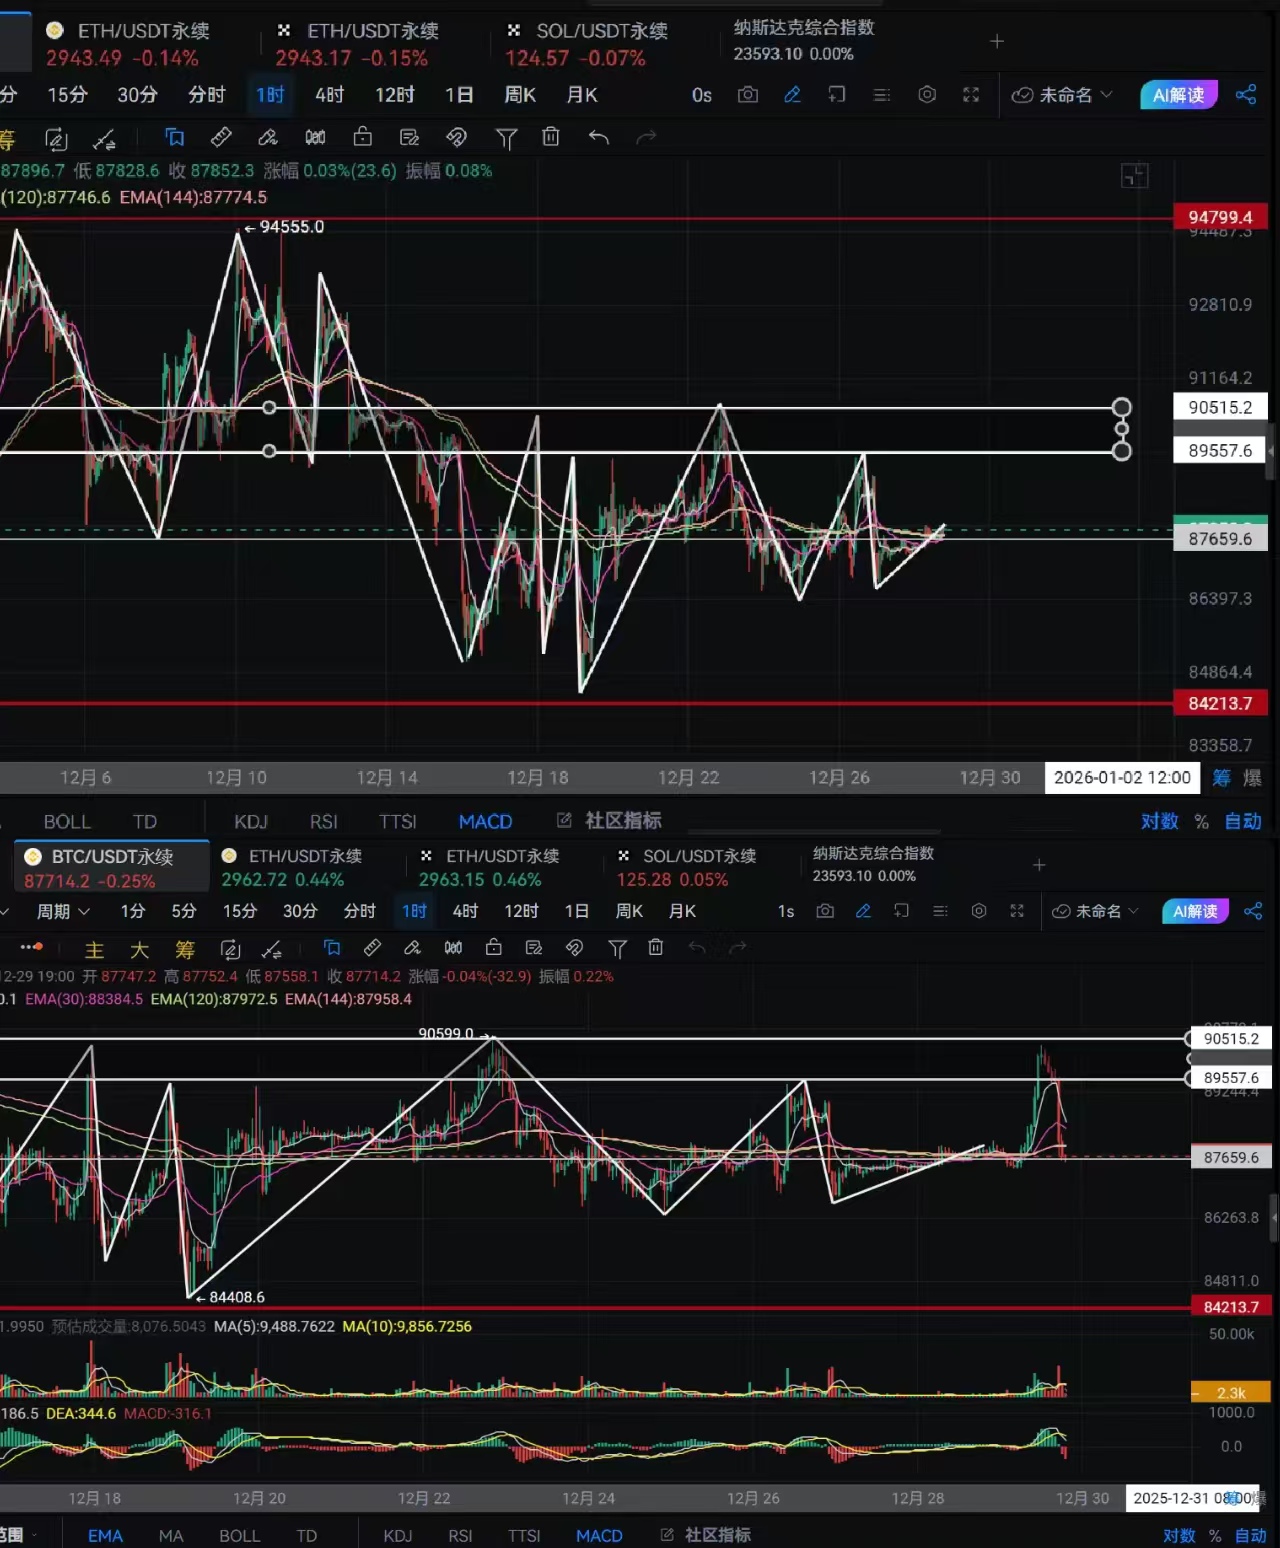
Let's first take a look at today's market trend. At two o'clock in the morning, during the one-hour consolidation process, the selling pressure was weak. The three consecutive bearish candles did not continue to probe downward, and the one-hour EMA lines twisted into a single rope. This kind of trend requires a wave of market movement to determine the future direction. The market's movement is to first go up, with eight consecutive bullish candles in one hour. The trading volume in the first half was very low, but after breaking through 88500, buying volume increased, followed by three consecutive bullish candles, pushing the price up to 90500, stopping at the strong resistance area.
From ten to twelve o'clock, there was a divergence between volume and price, and the buying momentum at the resistance zone was clearly weak, insufficient to push the price upward to break through the resistance level again. The MACD indicator corresponding to the next candle still favored the bulls, but selling pressure had already begun. The attitude released by four consecutive one-hour bearish candles was also very clear; the market refused to break through. When Bitcoin fell back to 89500, it did not find support but directly broke down. In the subsequent four hours, it fell nearly three thousand points, reaching around 86800. The so-called calm surface hides a great wave behind it; this trend is nothing more than that.
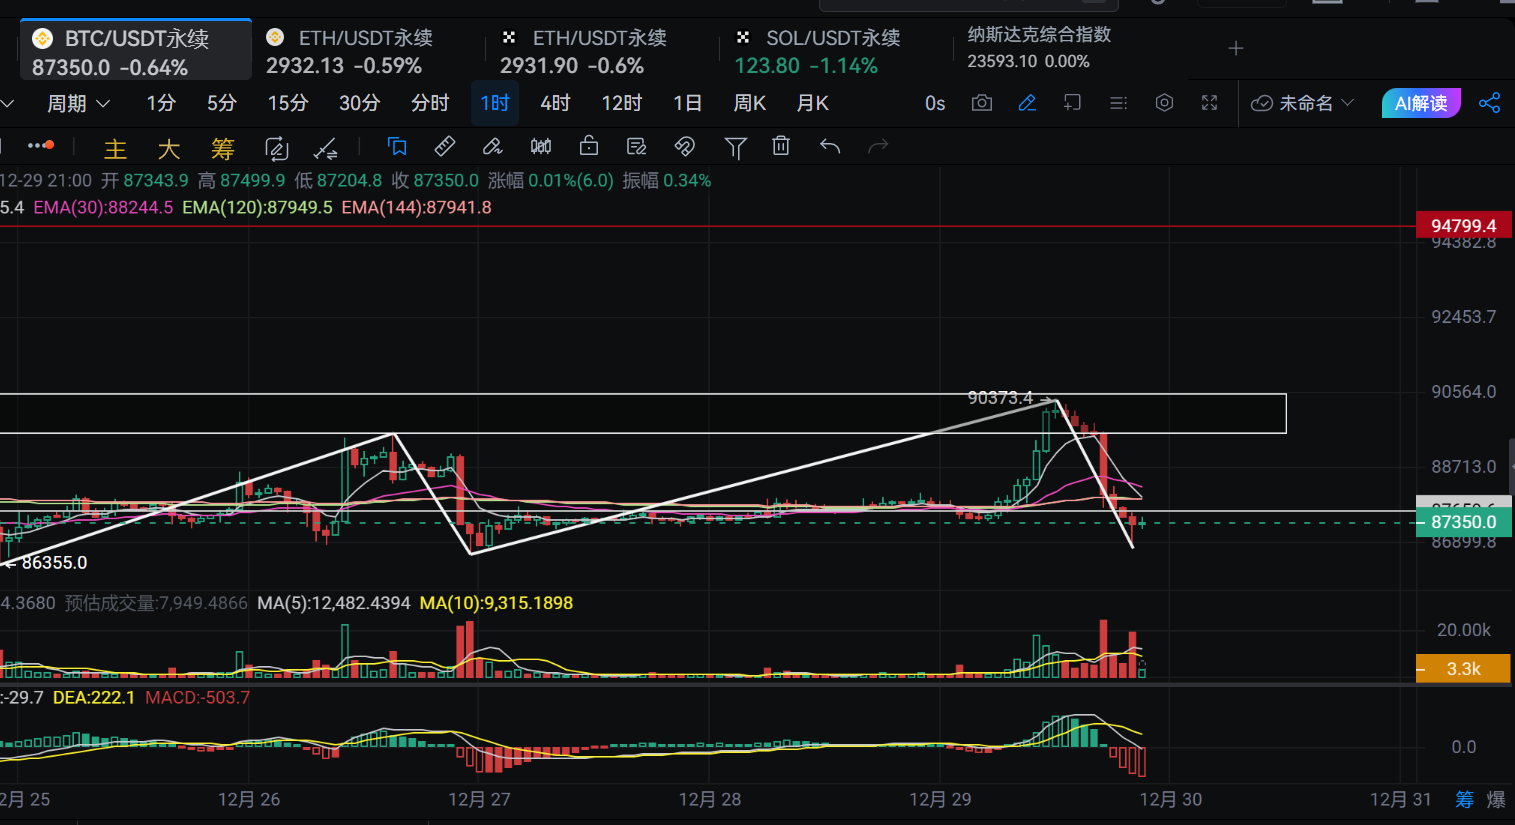
Compared to the previous period, the selling pressure rhythm is much stronger. So what is the significance of this round of rally? It is merely a test of market sentiment. Buying at high levels often involves leveraging. Continuous buying at low levels is a positive signal for the market. Since the strong resistance zone has been tested multiple times, our view for the future remains unchanged, focusing on short positions.
Currently, the four-hour EMA 120 and 144 are around 88500 and 88800, respectively, while the one-hour EMA 7 has been pushed back to converge with EMA 144 around 87950. The smaller time frames are still hesitating, needing to observe the flow of funds, while the larger time frames remain steadfast, unyielding.
In this period, we should be more cautious, still focusing on short positions, conservatively shorting at 88500-88800, adding at 89450-89750, with a stop loss at 90250. The target is initially set at around 85500-85800. There may be a rebound after hitting the target, but the space will not be large.
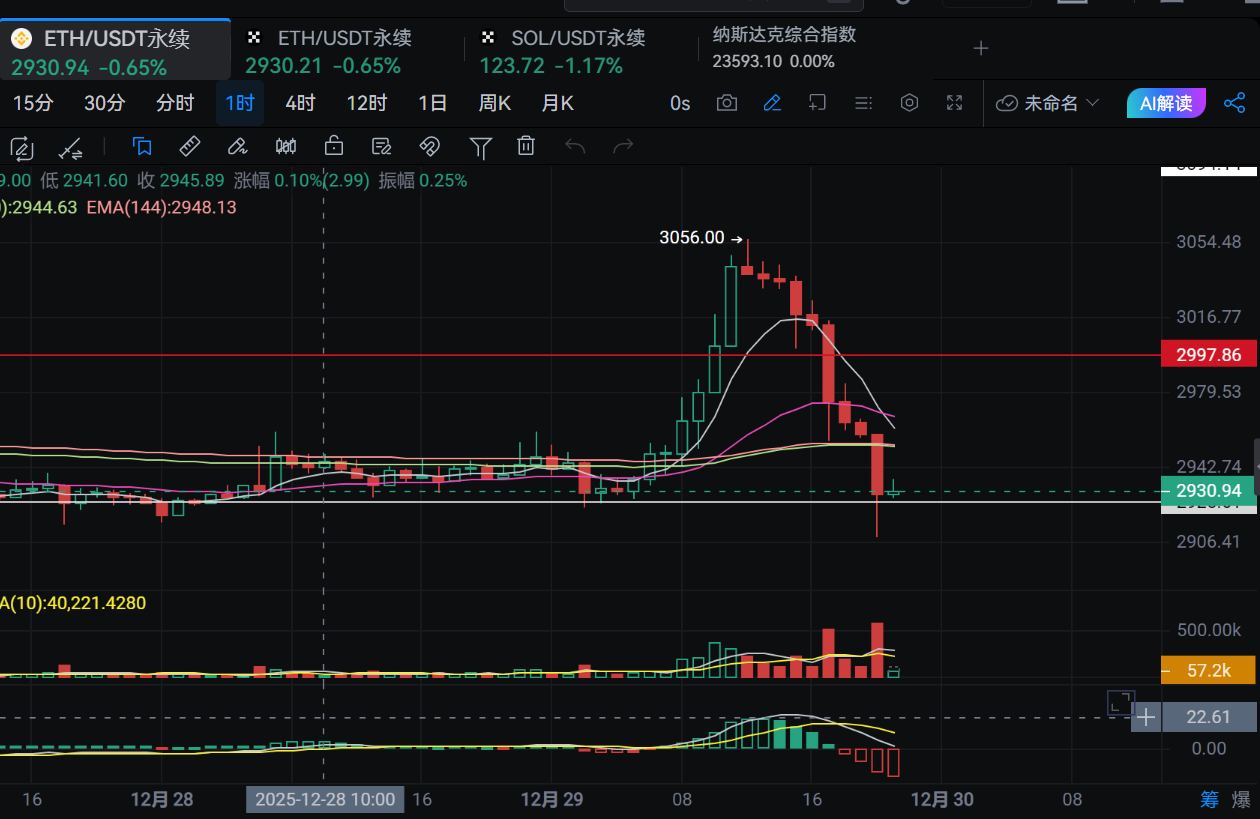
Ethereum can completely synchronize with Bitcoin's rhythm. In this period, Ethereum's movement was entirely driven by Bitcoin. On December 28, it oscillated narrowly around the one-hour EMA 7, EMA 30, EMA 120, and EMA 144, completely following Bitcoin's rhythm. It surged to 3056, below the late December high of 3077, and has not looked back since the drop. Currently, the one-hour has formed nine consecutive bearish arrangements. We can conservatively enter short positions at the second pressure point of 2950, with a direct large addition at 3000. Looking below, we expect to see a low range first at around 2830-2850.
May the snow bring a good harvest, and I hope everyone continues to prosper. If we walk together: WeChat public account, Jiang Xin Lun Chan.
免责声明:本文章仅代表作者个人观点,不代表本平台的立场和观点。本文章仅供信息分享,不构成对任何人的任何投资建议。用户与作者之间的任何争议,与本平台无关。如网页中刊载的文章或图片涉及侵权,请提供相关的权利证明和身份证明发送邮件到support@aicoin.com,本平台相关工作人员将会进行核查。