On the first day of 2026, Bitcoin continues to fluctuate. After briefly breaking through $89,000 at 10 PM on Wednesday night, it quickly fell back to the $87,000 level. As of the time of writing, the price is quoted at $88,820. Although there has been a slight rebound, the battle between bulls and bears remains intense.
According to the latest meeting minutes released by the Federal Reserve, even though officials have made a decision to cut interest rates, there are still significant differences within the Fed regarding whether to continue adjusting rates in the future. Some believe that after this adjustment, rates may need to remain unchanged for a period to observe changes in economic data.
However, market investors believe that once the Fed officially enters a rate-cutting cycle, the decrease in the cost of funds will benefit the performance of risk assets, with Bitcoin often seen as the primary beneficiary.
Bitcoin Four-Hour Chart
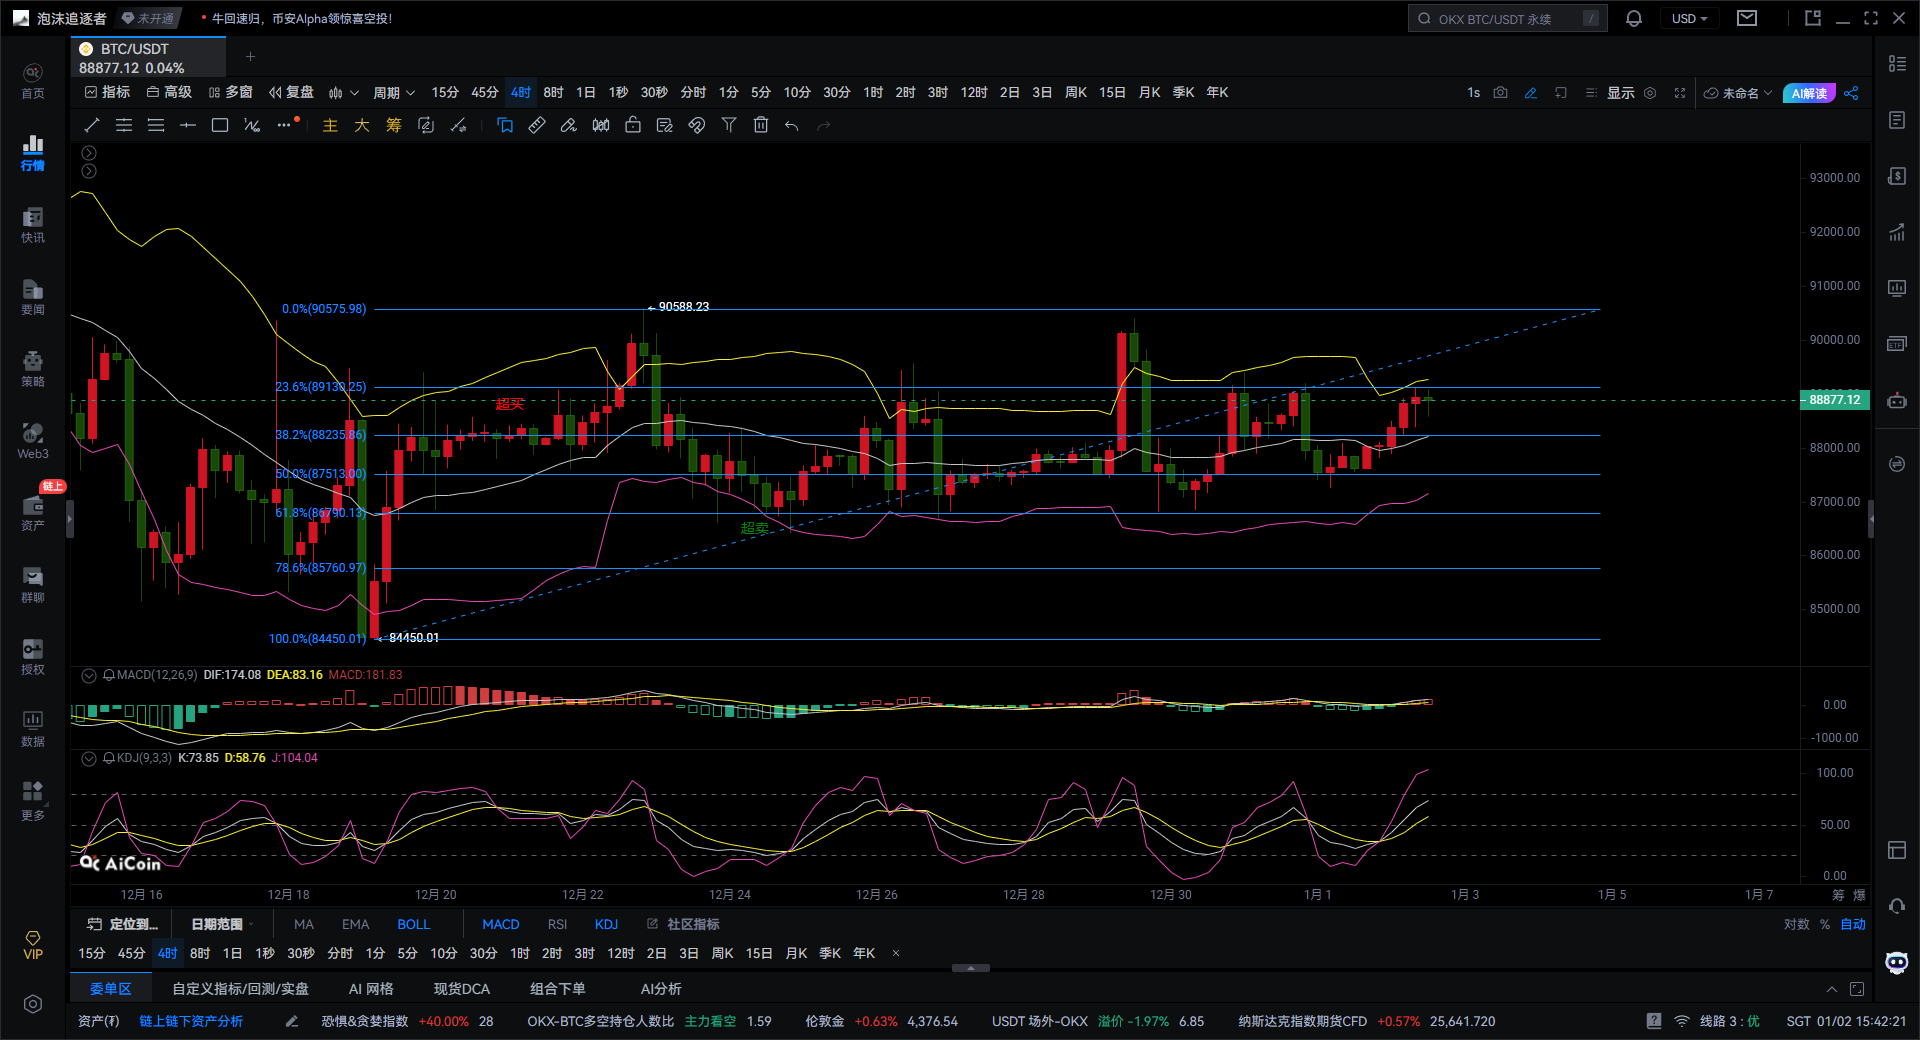
1. First, look at the big picture (Structure + Fibonacci)
It is clear from the chart that this is a rebound structure that started from around 84,550 and rose to a high of 90,558. The current price is oscillating within the Fibonacci retracement range of 0.382-0.236. Key Fibonacci retracement levels: 0.236 is around 89,130; 0.382 is around 88,235; 0.5 is at 87,513; 0.618 is at 86,720. The current price is around 88,800, essentially stuck between 0.236 and 0.382, consolidating sideways. In short: this is a strong pullback, not a downtrend.
2. Bollinger Bands: Oscillating with a bullish bias, testing upwards
The middle band of the Bollinger Bands is flattening and slightly moving upwards. The lower band is far from the current price, indicating that the lower space is protected. The price is currently running close to the upper middle band. What does this indicate? The bullish force has not left; the main force is waiting for a reason to increase volume. As long as the four-hour chart does not effectively break below the middle band (around 88,000), it remains a bullish structure.
3. MACD: Decreasing volume pullback, possible second golden cross at any time
Both DIF and DEA are above the zero axis. Although the MACD histogram has shortened, it has not formed a clear volume death cross. This is part of the energy accumulation phase during a strong pullback. To put it directly: this is a washout-type MACD pattern, not a bearish MACD pattern. As long as a strong four-hour bullish candle appears next, the MACD can easily strengthen again.
4. KDJ: Low-level turning point, short-term action may be imminent
The K-line value and D-line value have formed a golden cross below 50 and are moving upwards. The J-line value is rising quickly. This KDJ state usually indicates that a short-term rebound may occur, or it will test resistance levels. However, it is important to note: the KDJ indicator is mainly used to observe rhythm and cannot be used alone to judge the big direction.
5. Clear division of key levels (practical focus)
Support levels (key observation): 88,200-88,000 range (combining the 0.382 retracement level and the middle band of the Bollinger Bands). 87,500 (0.5 retracement level) — if it breaks below here, the overall structure may change.
Resistance levels (breakthrough requires volume): 89,200-89,500 range. 90,500-90,800 range (near previous highs, belonging to the 0 retracement area).
6. Comprehensive analysis + reference suggestions
Now is not the time to chase shorts, but rather to wait for a pullback to go long. There may be two possible paths ahead:
The first is a strong bullish path (bullish bias): the price stabilizes above 89,000 and breaks through 89,500 with volume, targeting 90,500 first.
The second is a consolidating washout path (more likely): the price oscillates between 88,000-89,500, washing out traders who chase highs, and then chooses a direction.
Giving you a 100% accurate suggestion is not as good as providing you with the right mindset and trend. Teaching a man to fish is better than giving him a fish; learning to earn for a lifetime is more valuable than earning for a moment!
Time of writing: (2026-01-02, 15:40)

(Written by - Master Says Coin) Disclaimer: Online publication has delays; the above suggestions are for reference only. Investment carries risks; enter the market with caution!
免责声明:本文章仅代表作者个人观点,不代表本平台的立场和观点。本文章仅供信息分享,不构成对任何人的任何投资建议。用户与作者之间的任何争议,与本平台无关。如网页中刊载的文章或图片涉及侵权,请提供相关的权利证明和身份证明发送邮件到support@aicoin.com,本平台相关工作人员将会进行核查。