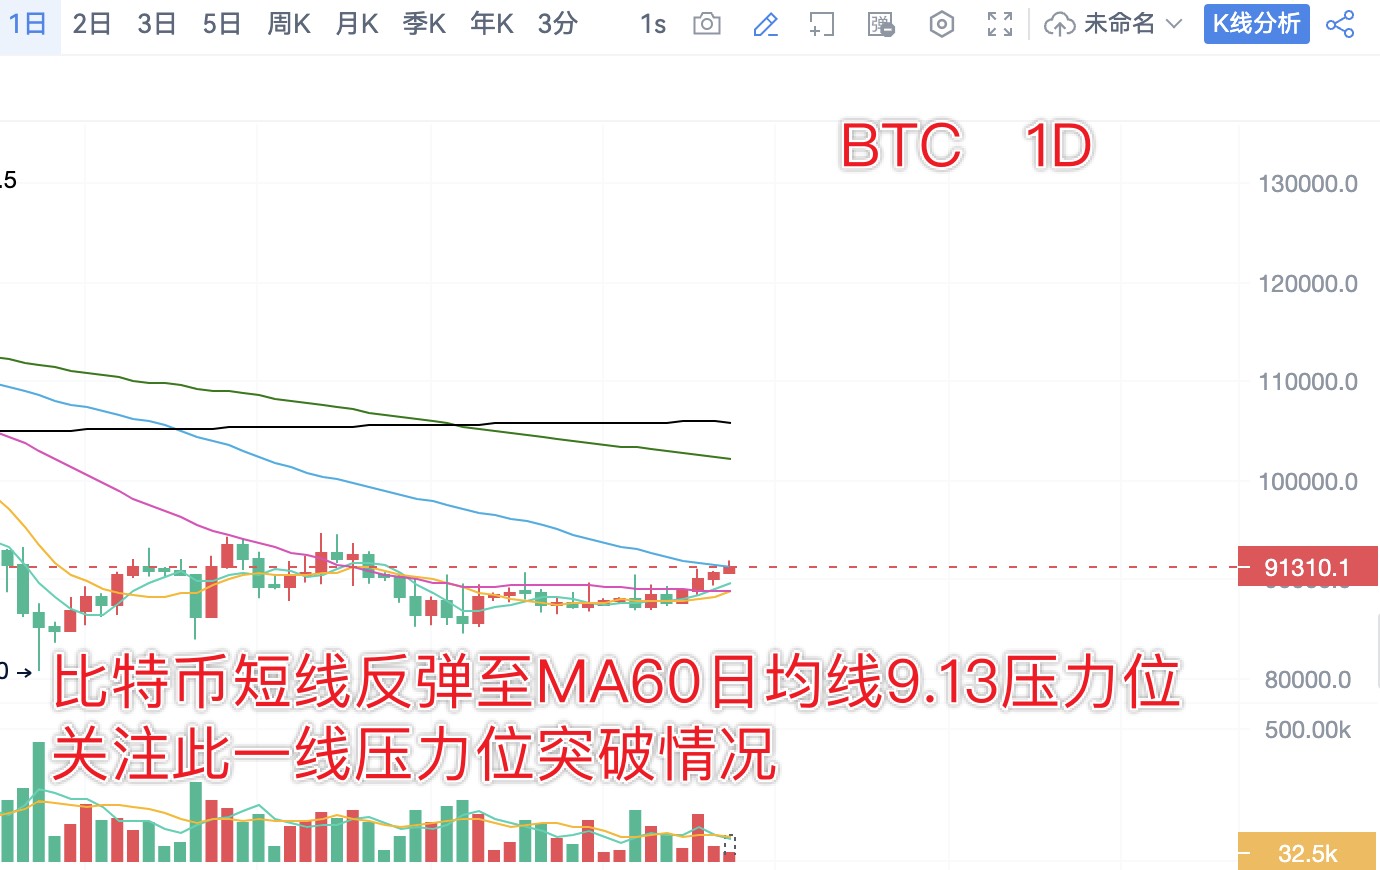
From the daily chart, Bitcoin has closed in the green for three consecutive days, currently reaching the daily MA60 moving average resistance level at 9.13. Today, we will focus on the sustainability of the bulls. If it can break through and stabilize above this level, it is expected to continue rebounding and test the previous resistance levels at 9.35/9.45. In the short term, looking at the 1-hour level, there is a stagnation near 9.18, and there may be a need for a pullback. The pullback support level to watch is the 4-hour MA5 moving average at 9.06.
From the daily chart, Ethereum had a small bullish candle yesterday, with the price retracing to the daily MA60 moving average at 3060. If it holds at this level, it is expected to continue testing the MA256 moving average at 3330. At the 1-hour level, the short-term support to watch is the MA30 moving average at 3110. A retracement to this level could be an opportunity to continue going long.
Midday trading strategy (written at 15:10):
BTC: Long at 9.08, add to long on a pullback to 9.00, target 9.15/9.25; short at 9.25/9.35 looking for a pullback of 1-2000 points.
ETH: Long at 3115, add to long on a pullback to 3070, target 3160/3200; short at 3230/3300 looking for a pullback of 6-100 points.
The daily analysis strategy has a very high win rate! Analysis is not easy, so I hope everyone can give a free follow, save, like, and comment. Thank you all, and feel free to leave comments below; I will reply to each one.

免责声明:本文章仅代表作者个人观点,不代表本平台的立场和观点。本文章仅供信息分享,不构成对任何人的任何投资建议。用户与作者之间的任何争议,与本平台无关。如网页中刊载的文章或图片涉及侵权,请提供相关的权利证明和身份证明发送邮件到support@aicoin.com,本平台相关工作人员将会进行核查。