Qinglan Crypto Class is starting! BTC's four cycles + dual perspectives on news, guiding you to step in sync with the crypto market rhythm.
I. Multi-Cycle Technical Status: Key Window for Energy Transition
The technical resonance points from large cycles to small cycles are forming, and the market is in a critical energy game phase.
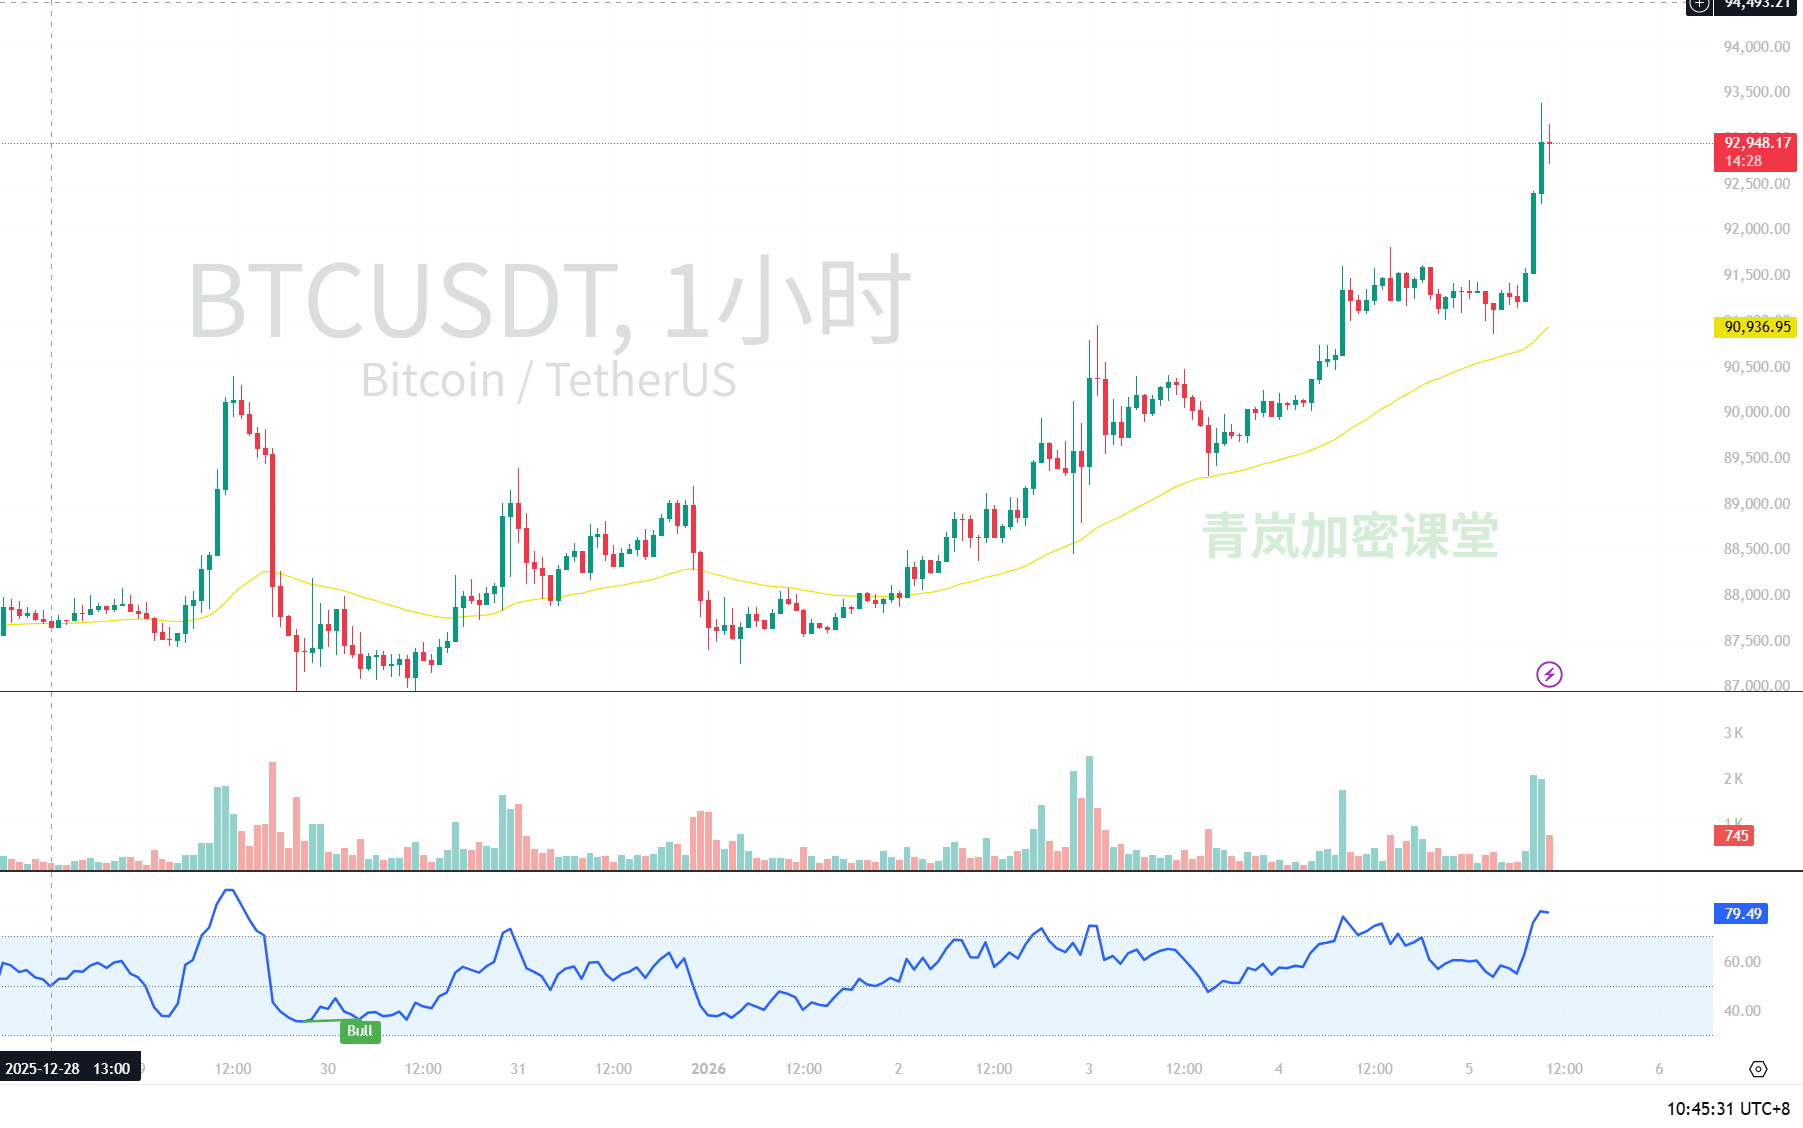
Daily Level (Core Trend - In Acceleration Channel):
Pattern Judgment: A textbook strong bullish structure. The price has completely broken away from the previous dense trading area, entering a "free acceleration zone" without trapped positions. The moving average system shows perfect parallel upward divergence, with MA20 becoming the dynamic bull-bear boundary. The MACD double lines are continuously expanding above the zero axis, indicating strong trend momentum. Notably, the RSI has maintained above 60 for 12 consecutive trading days, reflecting the strength of trend continuation.
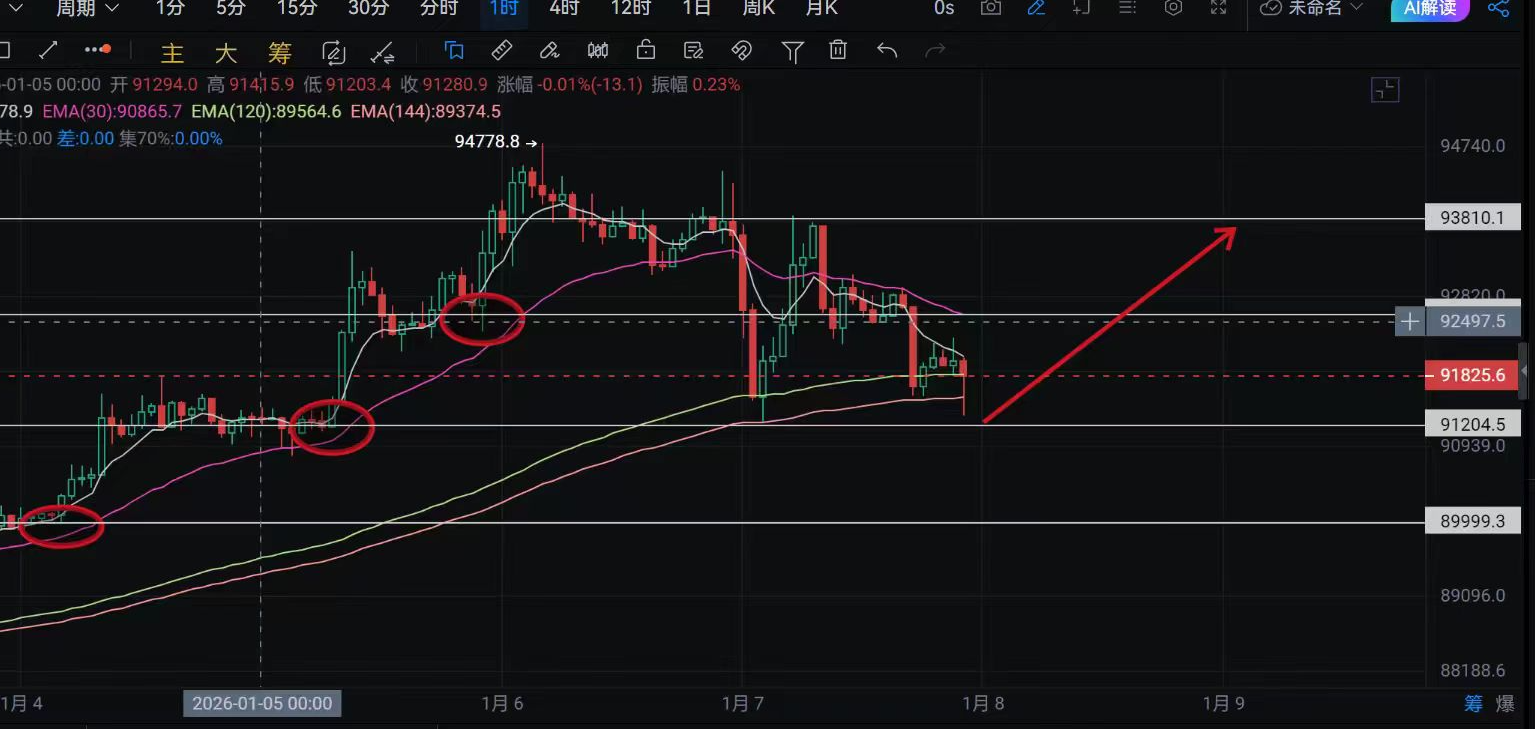
Key Area: Breakthrough support has moved up to the 91,800-92,200 area (previous high conversion + daily MA5). As long as this area holds, any pullback is a healthy turnover. There is no substantial resistance above, with psychological integer levels (95,000/100,000) serving more as emotional anchor points. True technical resistance may require waiting for larger divergences to appear.
4-Hour Level (Momentum Cycle - Signs of Fatigue in Uptrend):
Detail Observation: The trend remains within a bullish channel, but there are concerning signs of "momentum decay." During the price's new high (93,388), the volume bars show a divergence of "price up, volume flat." The peaks of the MACD histogram are decreasing, and although the fast and slow lines are at high levels, the rate of increase is slowing. The RSI has retreated after three attempts to break 78, forming a small "high-pressure platform."
Bull-Bear Boundary: 93,400-93,600 is the short-term dividing line of strength; an effective breakthrough could resolve the divergence. Below, 92,000-92,500 is the momentum defense zone; if lost, the 4-hour level will enter an adjustment cycle.
15-Minute Level (Micro Game - Energy Convergence Awaiting Explosion):
Market Language: A typical "flag consolidation" pattern. After a sharp rise in the morning, the price entered a narrow downward sloping channel (92,850-93,250). This structure is both a continuation pattern and a reflection of energy consumption. The Bollinger Bands are extremely narrow, indicating an imminent directional choice.
Trigger Points: To the upside, a volume breakout above 93,300 and a stable position on the 15-minute chart is needed; to the downside, focus on the support effectiveness at 92,700, where the flag's lower boundary coincides with the previous gap.
II. Market Sentiment and Capital Game: A Song of Ice and Fire
The current market exhibits a typical phenomenon of "overheated sentiment" and "cautious smart money" divergence:
Superficial Frenzy Layer: MEME coins are continuously hitting, the FOMO sentiment index on social platforms has reached a yearly high, and the chasing sentiment triggered by breaking integer levels constitutes the market's "hot appearance."
Deep Game Layer: On-chain data shows that multiple whale addresses are continuously building hedging positions above 93,000; the demand for put options in the options market has quietly increased as implied volatility rises; although the futures funding rate is positive, it shows signs of "high-level dullness," indicating a marginal weakening of bullish chasing willingness.
Liquidity Underflow: This week will see the unlocking of tokens for multiple projects (especially HYPE, ENA, etc.), with an expected total release value exceeding $200 million, which may withdraw some liquidity from the market and become a potential catalyst for adjustment.
III. Simulation and Strategy: Finding Value in Uncertainty Amid Certainty
My core judgment: The certainty of the large trend (upward) and the probability of medium-short term (adjustment) are forming tension. The next 24-48 hours are a key period to observe whether the market can "exchange time for space" to digest the overbought conditions.
Scenario Simulation and Response:
Scenario A (Probability 45%): Strong horizontal consolidation followed by a breakout
Characteristics: Price oscillates in the 92,500-93,500 range for 1-2 days, with the 4-hour MACD completing "air refueling" above the zero axis.
Signals: A "volume contraction pullback without breaking the previous low" + "volume bullish engulfing" appears on the 15-minute level.
Strategy: Continue holding spot; consider adding small positions near the pullback at 92,800 (strict stop loss at 92,200). For contracts, only consider low long opportunities after a pullback stabilizes.
Scenario B (Probability 40%): Deep technical correction
Characteristics: Price breaks below the 92,000 support, seeking support in the 90,500-91,200 area (daily MA20 + previous platform).
Signals: The 4-hour chart shows "bearish candle volume breaking below the flag's lower boundary" + "MACD death cross confirmation."
Strategy: Partially take profits on spot (especially for those with excessive gains), waiting to re-establish positions in the 90,500-91,200 area. For contracts, consider light short positions (limited to quick in-and-out), but strictly set stop losses above 93,600.
Scenario C (Probability 15%): Direct short squeeze upward
Characteristics: Whale shorts are liquidated, and the price breaks out with volume above 93,600, rushing towards 95,000.
Signals: The 1-hour chart shows three consecutive bullish candles closing above 93,500 + a sudden increase in network short liquidation data.
Strategy: At this point, chasing high is most discouraged; it’s better to miss out than to make a mistake. Those holding spot can enjoy profits running, but the cost-effectiveness of new positions is extremely low.
Words of wisdom for different trading styles:
For trend traders: The daily level bullish trend is intact; "do not guess the top" is the primary principle. Move the stop loss up to below 91,800, allowing profits to run fully.
For swing traders: Currently in a "tail end market," the risk-reward ratio is deteriorating. It is recommended to reduce positions, increase stop losses, or patiently wait for clear signals from scenarios A/B.
For arbitrageurs: Pay attention to changes in the spot-futures basis and funding rates; when rates are abnormally high, layout "rate arbitrage," which may be more stable than directional trading.
For more quantitative breakdowns of the impact of real-time news on market sentiment, updates are available in my Qinglan Crypto Class, qinglan.org. Finally, Sister Qinglan shares a trading quote: "Markets are born in despair, grow in hesitation, mature in celebration, and die in euphoria. We are currently at the critical point between 'celebration' and 'euphoria.'
A true hunter enjoys the gifts of the trend while knowing to adjust their steps before the music changes." The market will always present new puzzles, and our task is not to foresee all the answers but to establish a system that can handle various answers. Stay vigilant, stay flexible.
免责声明:本文章仅代表作者个人观点,不代表本平台的立场和观点。本文章仅供信息分享,不构成对任何人的任何投资建议。用户与作者之间的任何争议,与本平台无关。如网页中刊载的文章或图片涉及侵权,请提供相关的权利证明和身份证明发送邮件到support@aicoin.com,本平台相关工作人员将会进行核查。