Qinglan's Crypto Class is starting! BTC's four cycles + news perspective, guiding you to step in sync with the crypto market rhythm.
I. Multi-Cycle Technical Analysis
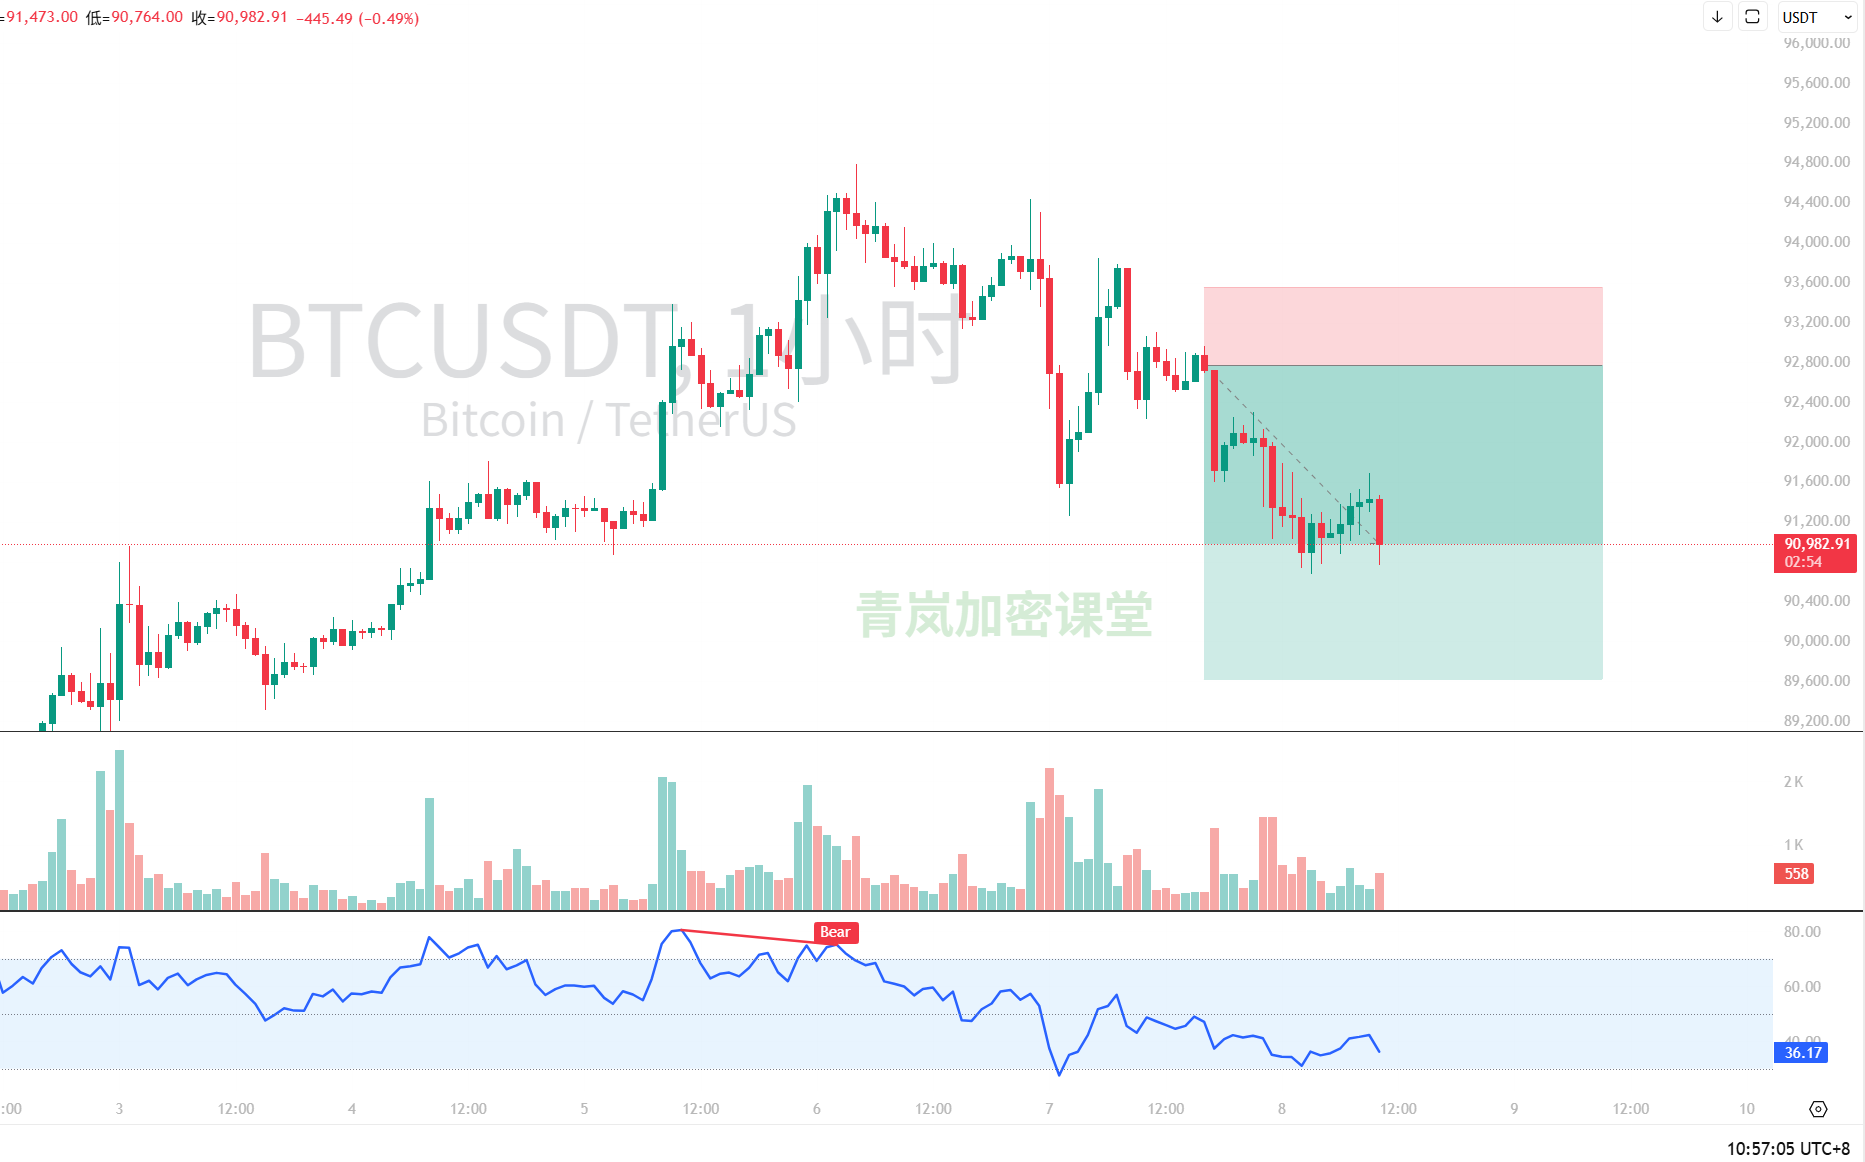
Short-term (15-minute & 1-hour charts): Weak oscillation, searching for direction. Trend: The 15-minute chart shows that the price has been oscillating downwards from last night's high of around 92.3k, with a quick drop around 10:30 AM today, reaching a low of 90.8k, and currently struggling around 91k. The 1-hour chart is clearer, with the price firmly pressed below all short-term moving averages (MA5, MA10, MA20), indicating a typical bearish arrangement. Key Indicators: RSI: Both the 15-minute and 1-hour RSI are hovering in the weak range of 35-45, showing a lack of strength in rebounds, indicating very weak short-term buying. MACD: The MACD for both periods is running below the zero line; although there have been a few weak golden cross attempts on the 15-minute chart, they have all been reversed, with overall momentum leaning bearish. Key Levels: Resistance: 91.5k - 91.8k (recent small platform and 1-hour MA5 pressure). Support: 90.8k (this morning's low) -> 90,000 USD (psychological level + daily key support).
Mid-term (4-hour chart): Deep correction in an upward trend. Trend: The 4-hour chart shows more clearly that the price has retraced from the January 5 high of around 94k, having broken below the MA20 (about 92.7k) and is currently testing the support of the MA60 (about 91.5k). This correction has consumed most of the gains from the previous upward wave. Key Indicators: MACD: After a high-level death cross, the fast and slow lines have crossed below the zero line, and the green bars (bearish momentum) are still expanding, indicating a mid-term adjustment signal. RSI: Has fallen from the overbought zone to around 45, leaving room for further decline. Key Levels: Resistance: 92.7k (MA20) -> 93.5k. Support: 90,000 USD (daily cloud bottom/baseline overlap area, a lifeline!) -> 88.5k.
Long-term (daily chart): Bullish structure remains intact, but short-term alarms are ringing. Trend: The daily chart shows that the overall trend is still upward, with the price above all major long-term moving averages (MA30, MA60). However! The price has closed with two consecutive bearish candles and has broken below the short-term moving average MA5, which is a clear signal of short-term weakness. Key Indicators: MACD: The red bars (upward momentum) continue to shorten, with the fast line showing signs of turning down, which needs to be monitored. RSI: Has fallen from above 70 in the overbought zone to around 53, indicating a healthy correction, but if it breaks below the 50 midline, the adjustment time will extend. Key Levels: Strong Support: 89,580 - 90,000 USD area (daily cloud bottom + psychological level). This is the dividing line between bulls and bears, and it cannot be effectively broken. Resistance: 93k -> 94k (previous high).
II. Resonance of News and Technicals
In terms of news, there is a mix of bullish and bearish factors: Bullish: Morgan Stanley applies for a multi-currency ETF, and the U.S. will include confiscated Bitcoin in its strategic reserves, both of which are long-term institutional positives that support the market. Bearish/Disturbances: The total market capitalization of cryptocurrencies fell over 3% in a single day, Ledger data leak (affecting sentiment), and uncertainties surrounding the stablecoin bill soon to be reviewed by the U.S. Senate, all of which are suppressing market risk appetite in the short term. Overall: There are no super bullish news that can immediately turn the tide; rather, it is more about digesting previous gains and regulatory uncertainties. This aligns with the technical demand for correction.
III. Our Predictions and Trading Ideas
Clear Predictions: Short-term (1-3 days): It is highly likely to continue oscillating between 90,000 - 92,500 USD, and it may even test the 90k support again. The possibility of a direct V-shaped reversal is small. Mid-term (1-2 weeks): As long as the key support at 90k is not effectively broken, this correction still belongs to a healthy adjustment within the bull market. After the adjustment ends, it is expected to challenge the previous high again based on the 90k support. Core Observation Point: The gain or loss of 90,000 USD. If it holds, the bull remains; if it breaks, the depth and duration of the adjustment will significantly increase.
Trading Ideas (for reference):
Long Position: Avoid rushing to catch the bottom! Conservative traders are advised to patiently wait for a clear signal of stabilization in the 90,000-90,500 USD area (such as a long lower shadow on the 4-hour chart, RSI divergence), before considering gradual entry. Set a stop loss below 89,000 USD.
Short Position: Aggressive traders can attempt a light short when the price rebounds to the 91,800 - 92,200 USD area (1-hour chart moving average pressure zone) and meets resistance, aiming for a quick in-and-out with a target around 90,800 USD. Remember, this is just a rebound short, not a trend short.
Observers: Currently, we are in a chaotic period with unclear direction, and the best strategy is to hold back. Wait for the market to make a clear choice at key positions (90k or breaking 92.5k) before following the trend.
For more quantitative breakdowns of how real-time news affects market sentiment, it has been updated in my Qinglan Crypto Class, qinglan.org. Finally, Sister Qinglan leaves you with a trading quote: "Markets are born in despair, grow in doubt, mature in hope, and die in expectation. At this moment, what we need is patience in oscillation, not decisions made in panic."
That's all for today's analysis. The market changes rapidly; we need to understand the charts and sense the sentiment. I am Qinglan, see you next time!
免责声明:本文章仅代表作者个人观点,不代表本平台的立场和观点。本文章仅供信息分享,不构成对任何人的任何投资建议。用户与作者之间的任何争议,与本平台无关。如网页中刊载的文章或图片涉及侵权,请提供相关的权利证明和身份证明发送邮件到support@aicoin.com,本平台相关工作人员将会进行核查。