Author: Glassnode Compiled by: AididiaoJP, Foresight News
After a large-scale year-end adjustment, Bitcoin enters 2026 with a clearer market structure. Current profit-taking pressure has eased, and market risk appetite is gently recovering. However, to establish a sustained upward trend, it is crucial to stabilize and reclaim important cost benchmark levels.
Summary
After experiencing a deep correction and several months of consolidation, Bitcoin has officially entered 2026. On-chain data shows that profit-taking pressure has significantly alleviated, and the market structure is showing initial signs of stabilization at the lower end of the range.
Although selling pressure has eased, there remains a substantial amount of trapped positions above the price, primarily concentrated in the upper half of the current range, which will continue to suppress upward price movement, highlighting the importance of breaking through key resistance levels to restore the upward trend.
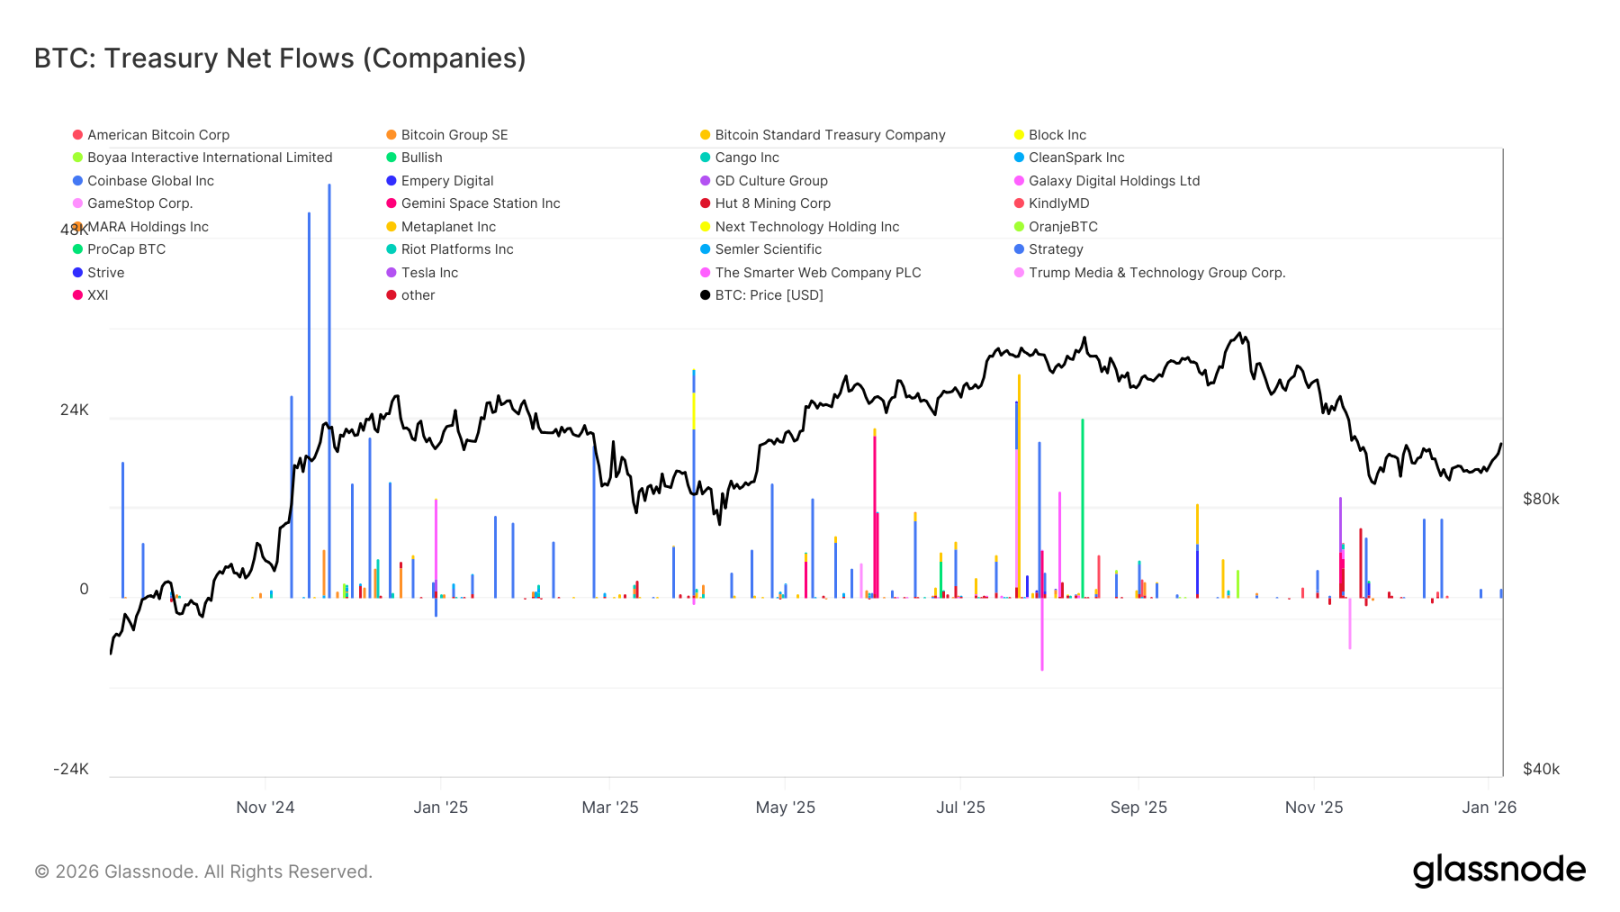
The demand for Bitcoin from digital asset treasury companies continues to provide underlying support for the price, but this demand exhibits a pulsing characteristic, lacking continuity and structure.
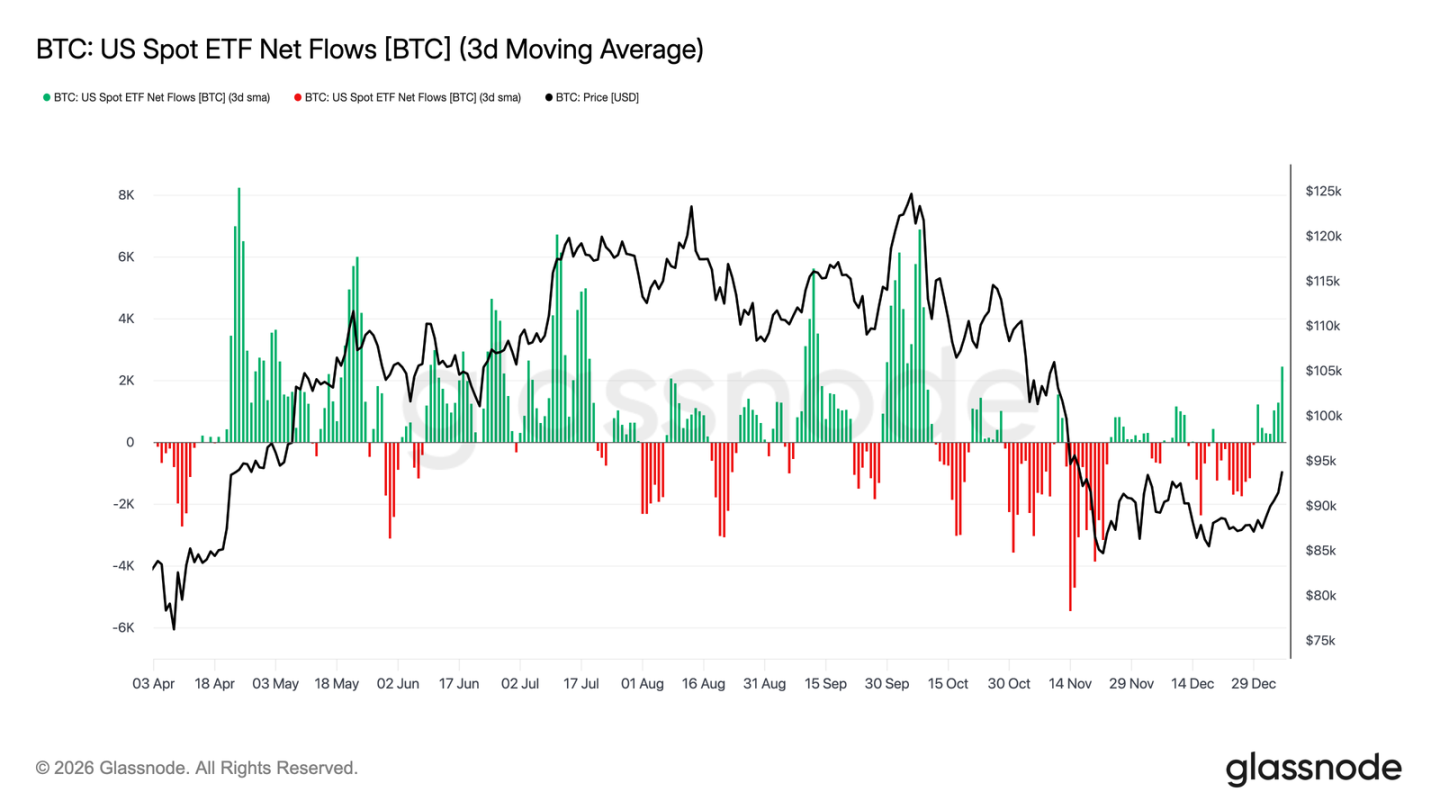
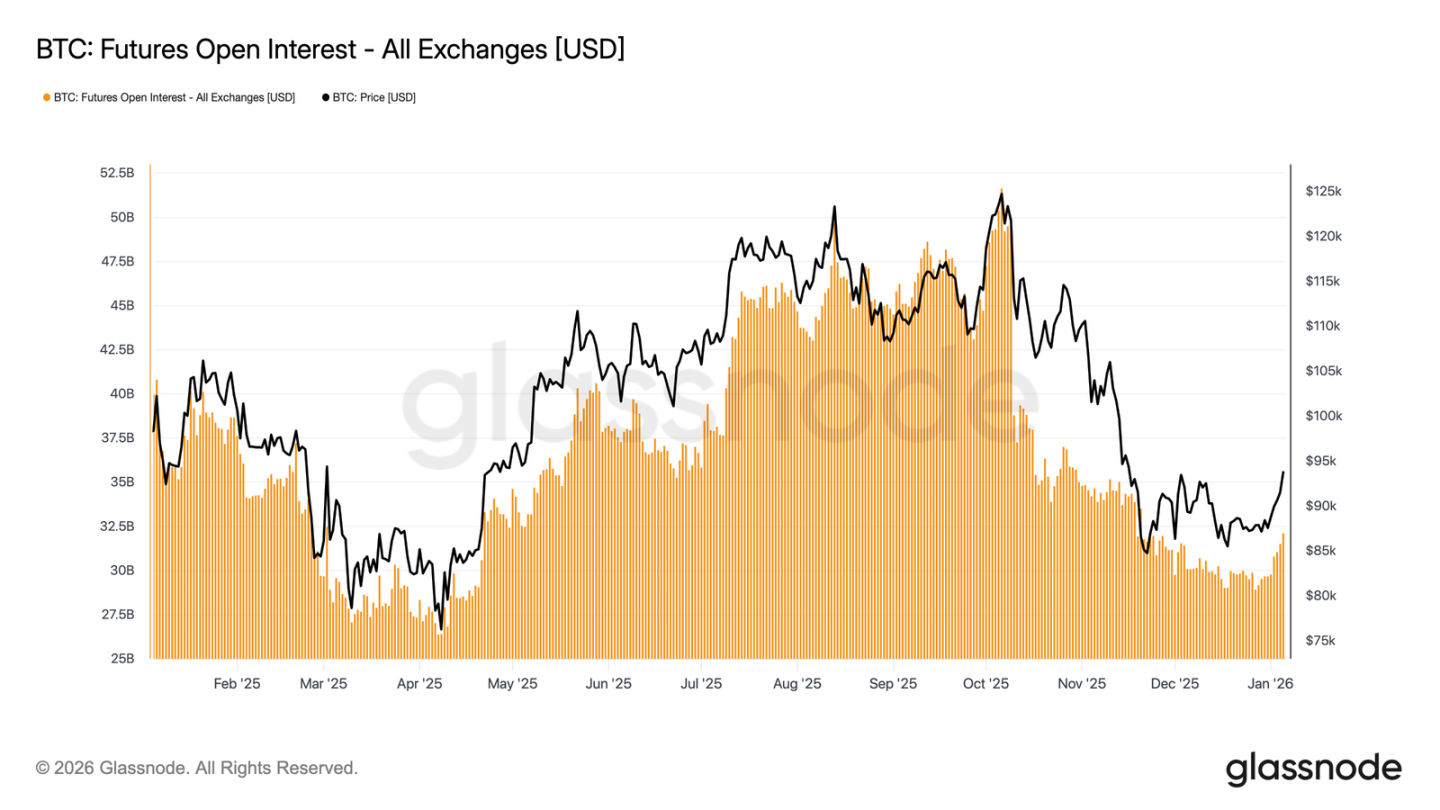
After a net outflow of funds from the U.S. spot Bitcoin ETF at the end of 2025, recent weeks have shown signs of net inflow again. Meanwhile, open interest in the futures market has stopped declining and started to rise, indicating that institutional investors are re-engaging with the market, and the activity in derivatives is being rebuilt.
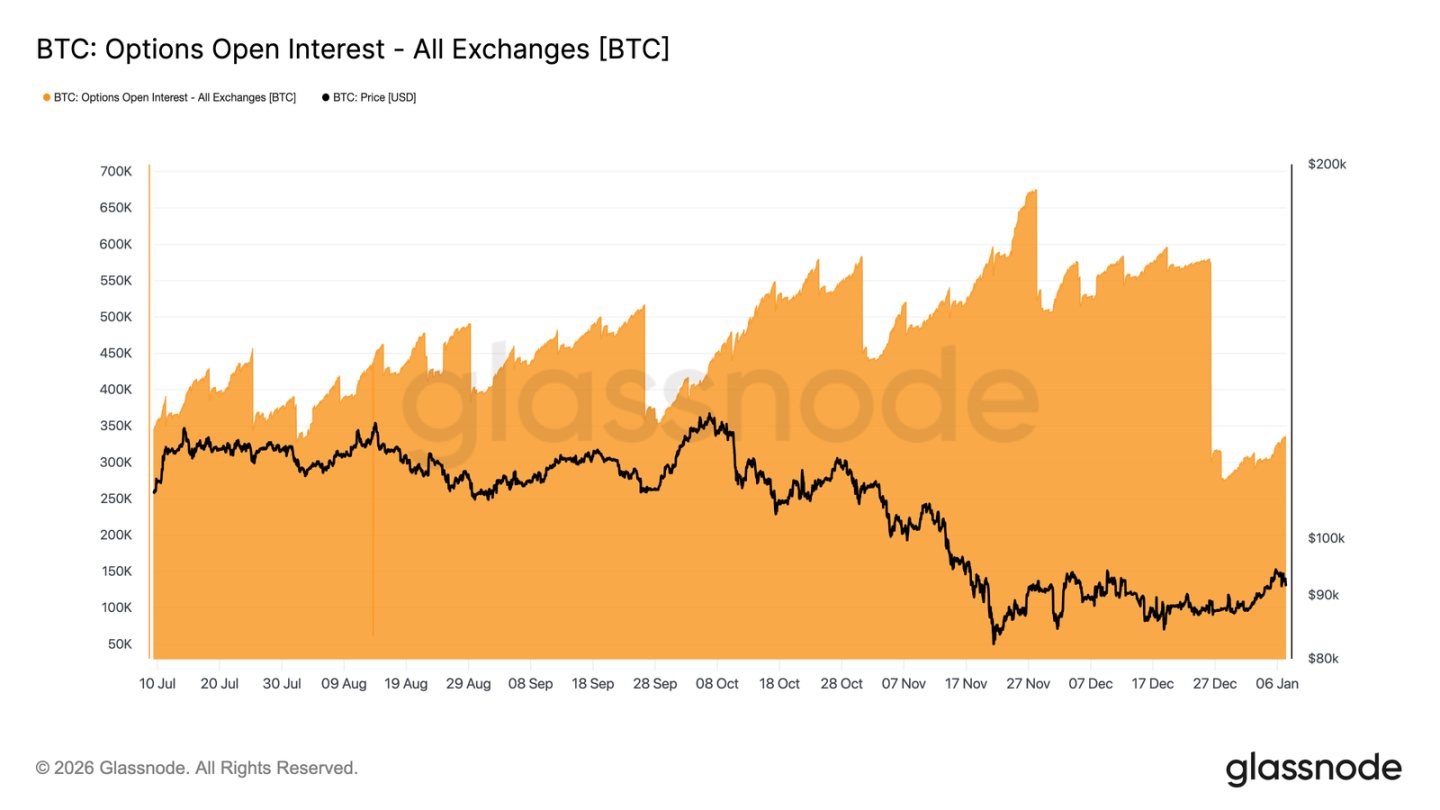
Record-sized options positions are set to expire at the end of the year, with over 45% of open contracts being liquidated, which eliminates structural hedging constraints in the market, allowing true risk appetite to be more clearly reflected in prices.
Implied volatility has likely reached a stage bottom, with buyer demand at the beginning of the year gently pushing up the volatility curve, but it remains at a relatively low position within the past three months.
As the premium on put options narrows and the proportion of call options trading increases, the market skew continues to revert to normal. Since the beginning of the year, options trading has clearly tilted towards bullish positions, indicating that investors are shifting from defensive hedging to actively positioning for upward opportunities.
In the $95,000 to $104,000 range, market maker positions have turned net short, meaning that when the price rises into this range, their hedging behavior will passively boost the upward momentum. Additionally, the performance of call options premiums around the $95,000 strike price also shows that holders of long positions tend to hold rather than rush to take profits.
Overall, the market is gradually shifting from a defensive deleveraging phase to selectively increasing risk, entering 2026 with a clearer structure and higher resilience.
On-chain Insights
Profit-taking Pressure Significantly Eased
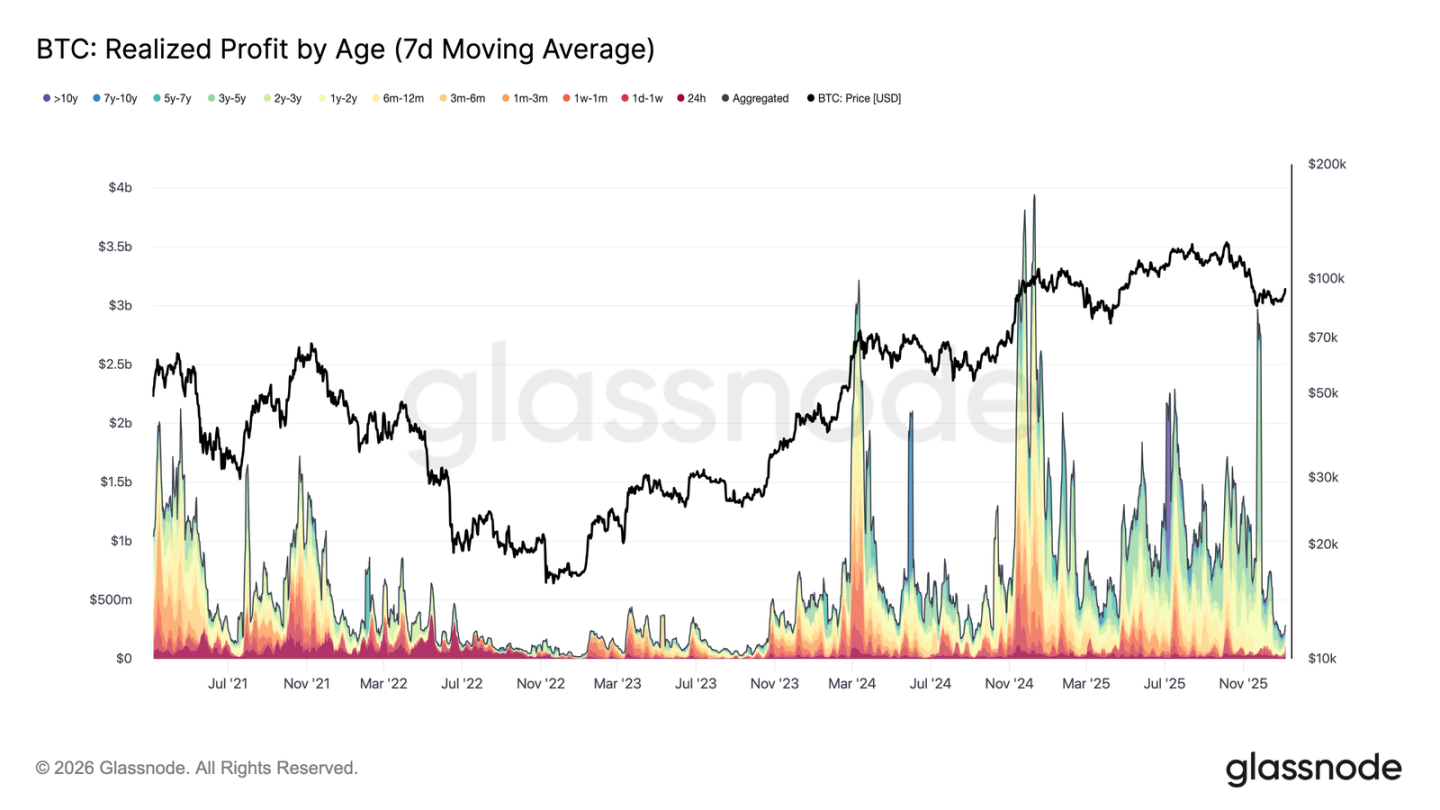
In the first week of 2026, Bitcoin broke through a consolidation range around $87,000 that lasted for several weeks, rising approximately 8.5% to a peak of $94,400. This increase is based on a significant cooling of overall profit-taking pressure in the market. In late December 2025, the 7-day average realized profit fell sharply from a high of over $1 billion per day for most of the fourth quarter to $183.8 million.
The decline in realized profits, particularly the weakening selling pressure from long-term holders, indicates that the main selling pressure that previously suppressed price increases has been released in stages. As selling power diminishes, the market stabilizes and confidence is restored, driving a new round of increases. Therefore, the breakout at the beginning of the year marks that the market has effectively digested profit-taking pressure, opening up space for price increases.
Facing Resistance from Trapped Positions Above
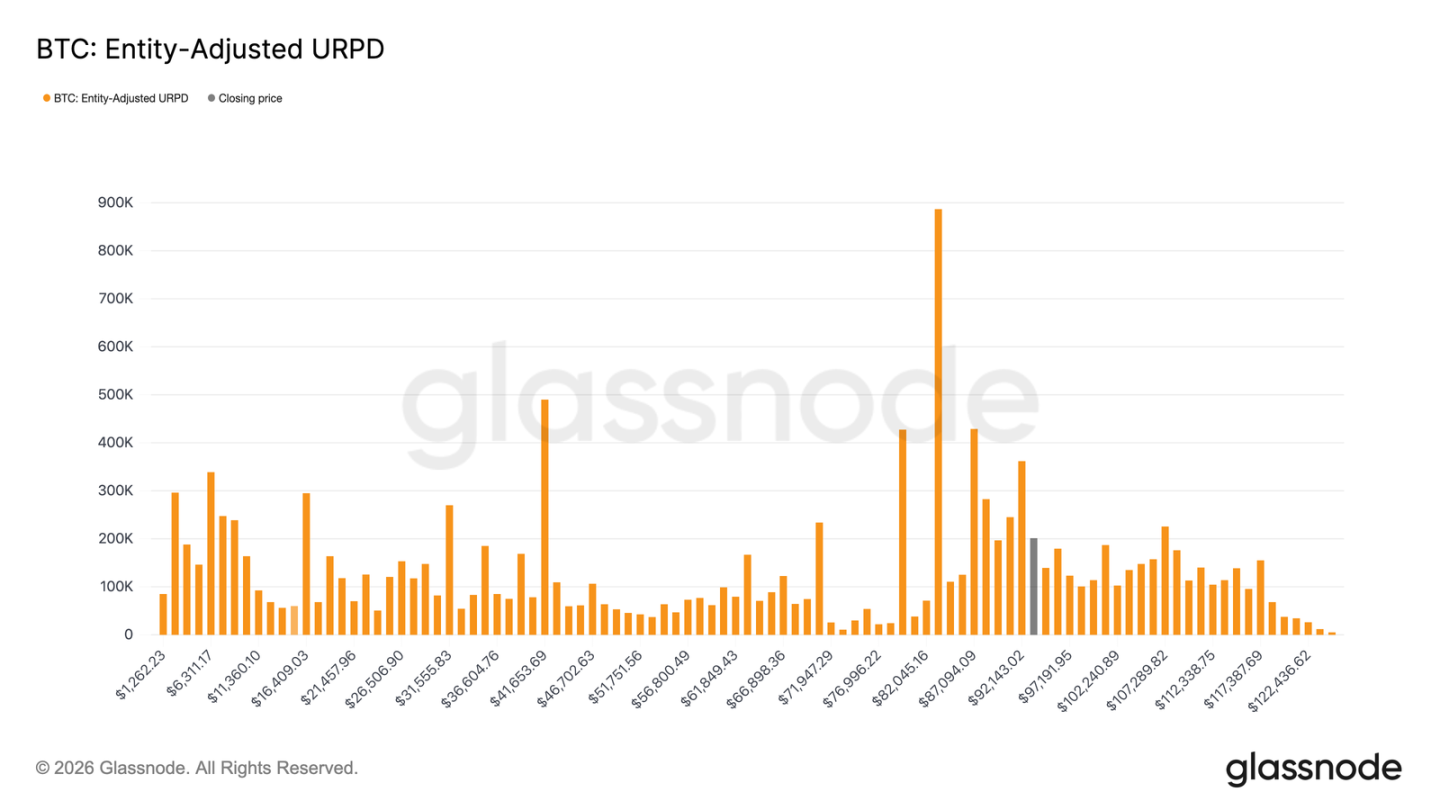
As profit-taking pressure eases, prices can rise further, but the current rebound is entering a supply area composed of different holding costs. The market has now entered a range primarily controlled by "recent top buyers," whose holding costs are densely distributed between $92,100 and $117,400. This group of investors bought heavily near previous highs and continued to hold during the price drop from historical highs to around $80,000, until the current rebound phase.
Therefore, as prices rise back to their cost area, these investors will have the opportunity to break even or exit with small profits, creating a natural upward resistance. To truly restart a bull market, the market needs time and resilience to digest this upper supply, pushing prices to effectively break through this area.
Key Recovery Level
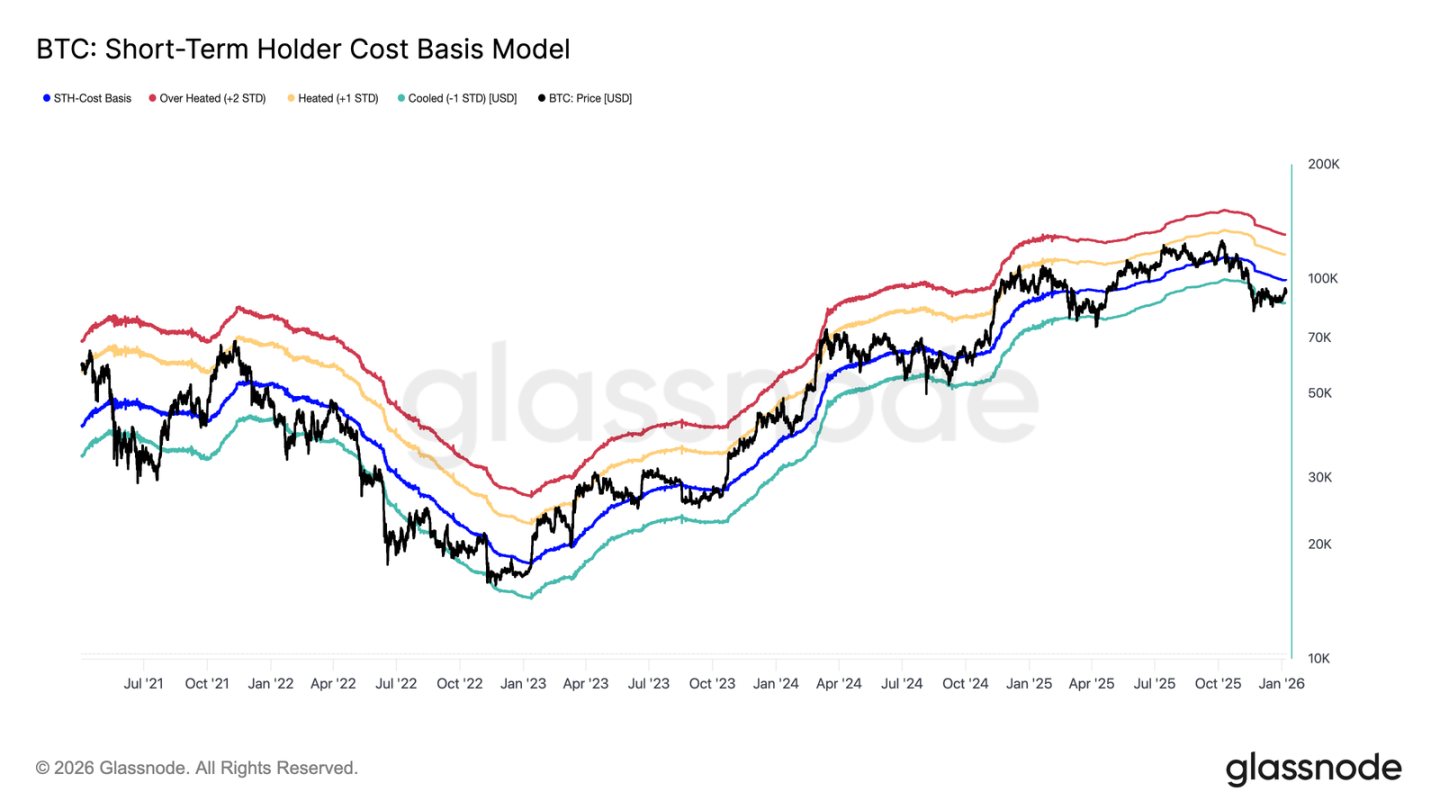
While facing pressure from trapped positions above, determining whether the recent rebound can truly reverse the previous downward trend and enter a phase driven by sustained demand requires a reliable price analysis framework. The cost basis model for short-term holders is particularly important during this transitional period.
Notably, the weak market equilibrium in December last year coincided with the lower bound of this model, reflecting weak market sentiment and insufficient buyer confidence at that time. The subsequent rebound pushed prices back up to the mean of the model, which is at the $99,100 level where the short-term holders' cost basis lies.
Thus, the first key confirmation signal for market recovery will be if prices can consistently hold above the short-term holders' cost basis, representing a rebound in confidence among new investors and a potential shift towards a positive trend.
The Crossroads of Profit and Loss
As the market focuses on whether it can effectively reclaim the short-term holders' cost basis, the current market structure bears similarities to the failed rebound in the first quarter of 2022. If prices continue to fail to rise above this level, it may trigger deeper downside risks. If confidence continues to be undermined, demand will further shrink.
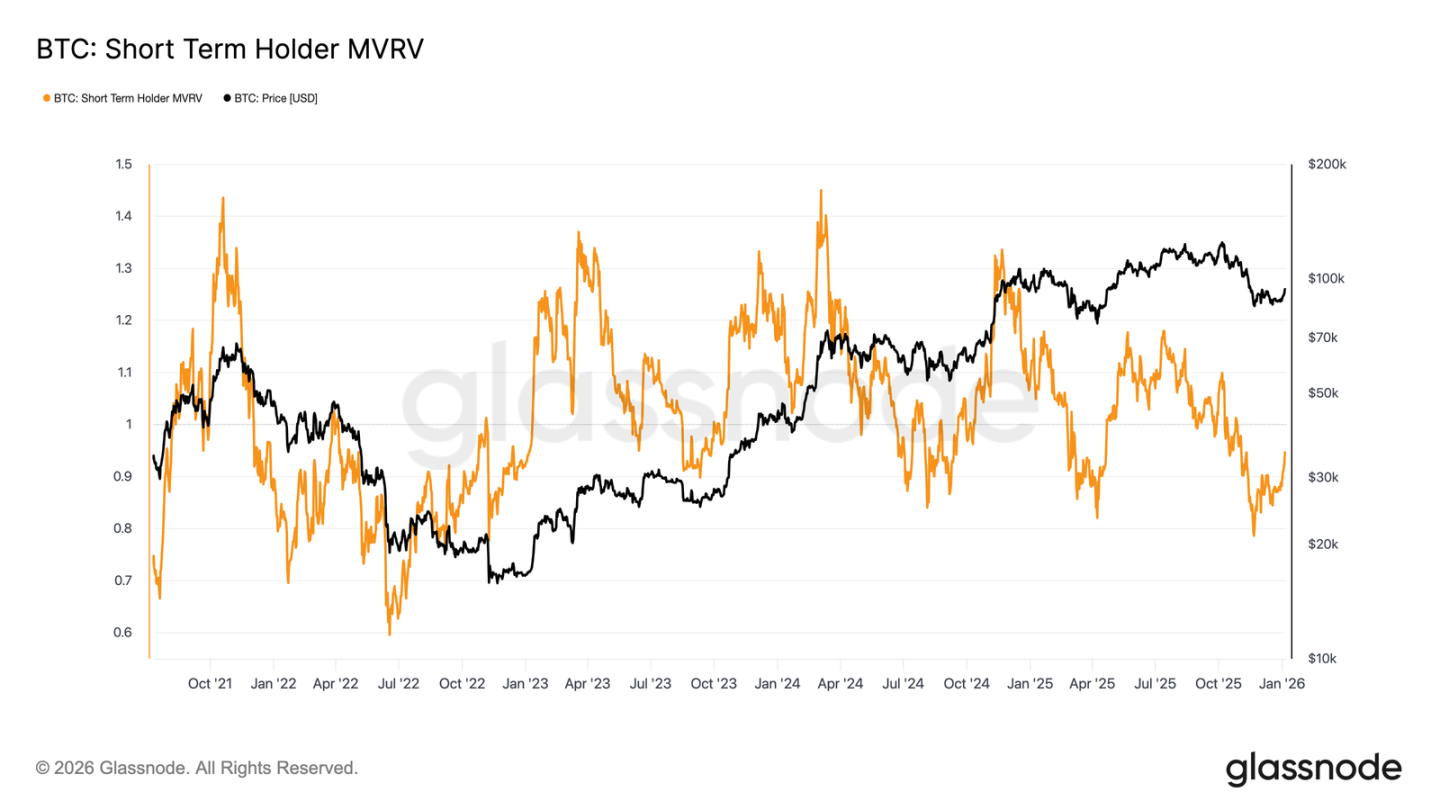
This dynamic is also clearly reflected in the MVRV metric for short-term holders. This metric compares the spot price with the average cost of recent buyers, reflecting their profit and loss status. Historically, when this metric remains below 1 (i.e., the price is below the average cost), the market is often dominated by bears. Currently, this metric has rebounded from a low of 0.79 to 0.95, indicating that recent buyers are still experiencing an unrealized loss of about 5%. If the market cannot quickly return to a profitable state (MVRV > 1), it will still face downward pressure, making this metric a key observation point in the coming weeks.
Off-chain Insights
Digital Asset Treasury Demand Cooling
Corporate treasuries continue to provide important marginal demand support for Bitcoin, but their buying behavior remains intermittent and event-driven. Treasury entities have repeatedly seen net inflows of thousands of Bitcoins in a single week, but these purchases have not formed a continuous, stable accumulation pattern.
Large capital inflows often occur during local price corrections or consolidation phases, indicating that corporate buying behavior is still price-driven, representing opportunistic allocation rather than long-term structural accumulation. Although the range of participating institutions has expanded, overall capital inflows exhibit a "pulsing" characteristic, interspersed with longer silent periods.
Without sustained treasury buying support, corporate demand plays more of a "stabilizer" role for prices rather than a driving force for a trend upward. The market direction will increasingly depend on changes in derivatives positions and short-term liquidity conditions.
ETF Fund Flows Return to Net Inflow
Recent fund flows from the U.S. spot Bitcoin ETF have shown early signs of institutional capital re-entering the market. After experiencing sustained net outflows and low trading activity at the end of 2025, fund flows have clearly shifted to net inflows in recent weeks, coinciding with the price stabilizing and rebounding in the low $80,000 range.
Although the current net inflow scale has not yet returned to mid-cycle peak levels, the direction of fund flows has shown a definitive turnaround. The increase in net inflow days indicates that ETF investors are shifting from previous net sellers back to marginal buyers.
This shift means that institutional spot demand is re-emerging as a positive support force for the market, rather than a source of liquidity pressure, providing structural buying support for the market that stabilized at the beginning of the year.
Futures Market Participation Rebounds
After the severe deleveraging triggered by price declines at the end of 2025, total open interest in the futures market has recently begun to rise. After falling from a cycle high of over $50 billion, the open interest scale has stabilized and is gently increasing, indicating that derivatives traders are re-establishing risk positions.
This position rebuilding is synchronized with the price stabilization process above $80,000 to $90,000, showing that traders are gradually increasing their risk exposure rather than rushing to chase higher prices. The pace of re-establishing positions is relatively moderate, and the open interest scale remains far below previous cycle highs, reducing the risk of large-scale liquidations in the short term.
The moderate rebound in open interest marks an improvement in local risk appetite, with derivatives buying gradually returning, helping prices to embark on a new round of pricing as liquidity normalizes at the beginning of the year.
Major Restructuring in Options Market Positions
At the end of 2025, the Bitcoin options market underwent the largest position reset in history. The number of open contracts plummeted from 579,258 contracts on December 25 to 316,472 contracts after expiration on December 26, a decrease of over 45%.
A large number of open positions concentrated at certain key strike prices can indirectly affect short-term price movements through market makers' hedging operations. By the end of last year, this concentration of positions reached a high level, leading to "price stickiness" in the market, which limited volatility.
Now, this pattern has been broken. With the concentrated liquidation of year-end expiration positions, the market has freed itself from the previous structural constraints of hedging mechanisms.
The post-expiration market environment provides a clearer window for observing true sentiment, as new positions reflect investors' current risk preferences rather than the influence of legacy positions, making options trading in the first few weeks of the year more directly reflective of market expectations for future trends.
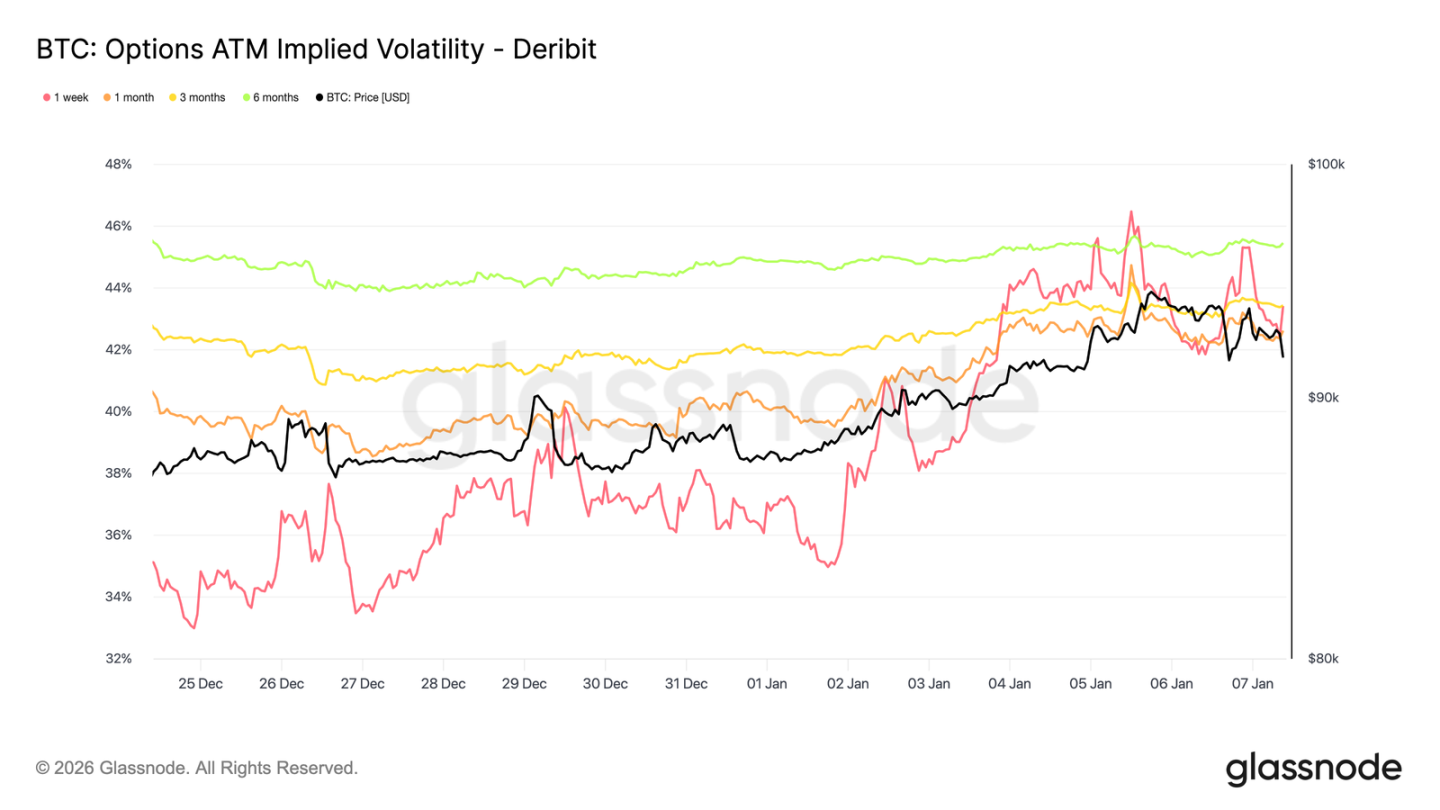
Implied Volatility May Have Bottomed
After the large-scale reset of options positions, implied volatility reached a short-term low during the Christmas period. Trading was light during the holidays, and weekly implied volatility fell to its lowest level since late September of last year.
Subsequently, buyer interest began to return, with investors gradually establishing long volatility positions (especially in the bullish direction) as the new year approached, pushing various term volatility curves gently upward.
Despite the rebound, implied volatility remains compressed. The volatility across one week to six months is concentrated between 42.6% and 45.4%, with the curve shape relatively flat.
Volatility remains at a low position within the past three months, and the recent rebound reflects more of a warming of market participation rather than a comprehensive repricing of risk.
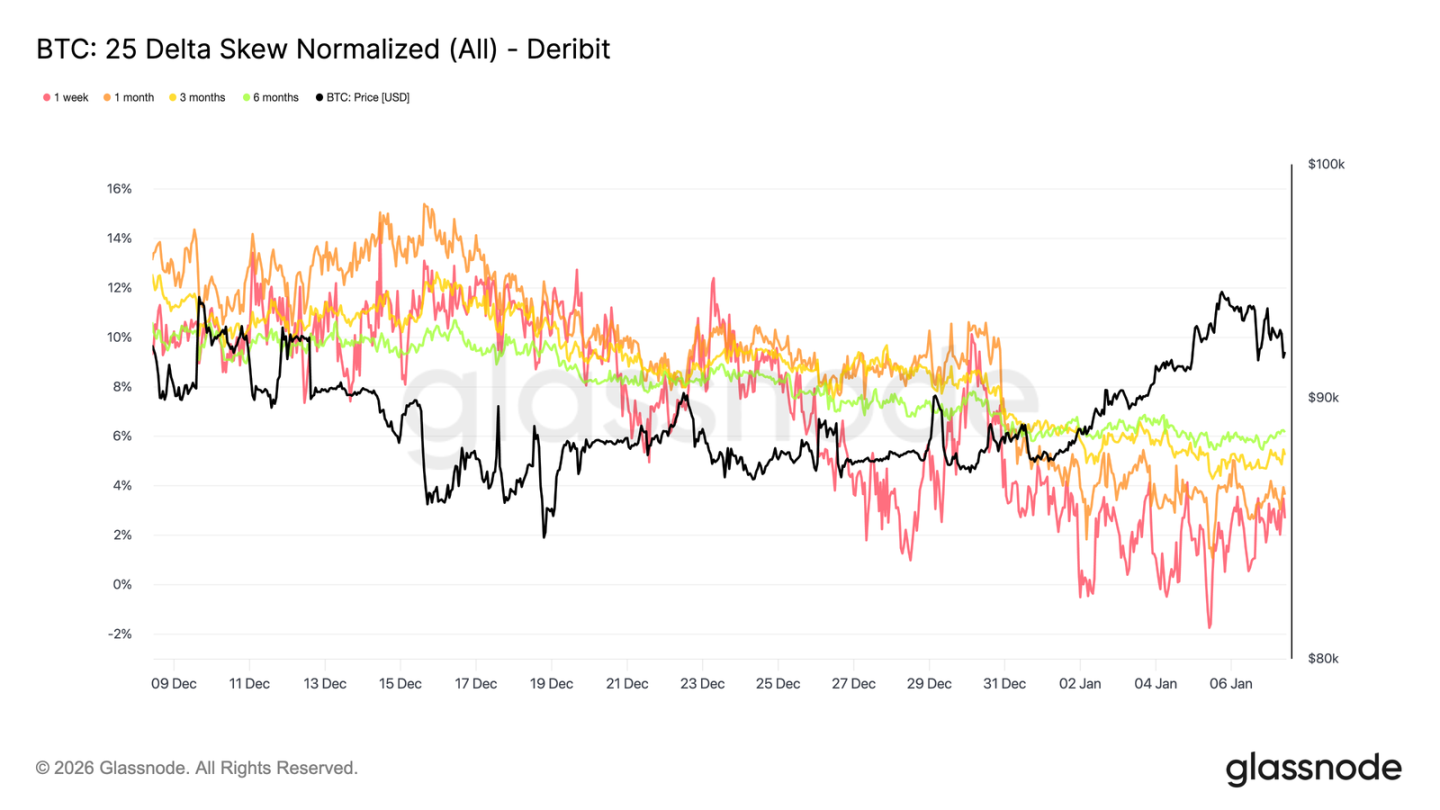
Market Tends to Balance
As implied volatility stabilizes, skew provides a clearer perspective on traders' directional preferences. Over the past month, the premiums of put options relative to call options have continued to narrow, with the 25-Delta skew curve gradually returning to the zero axis.
This reflects a gradual shift in the market towards bullish positioning. Investor demand is transitioning from merely hedging against declines to increasing exposure to upward opportunities, consistent with their behavior of repositioning after year-end position clean-up.
Meanwhile, defensive positions have decreased. Some downside protection positions have been unwound, reducing the premium paid for "black swan" insurance.
Overall, the skew indicates that market risk expression is becoming more balanced, with investors' expectations for price increases or expanded volatility warming up.
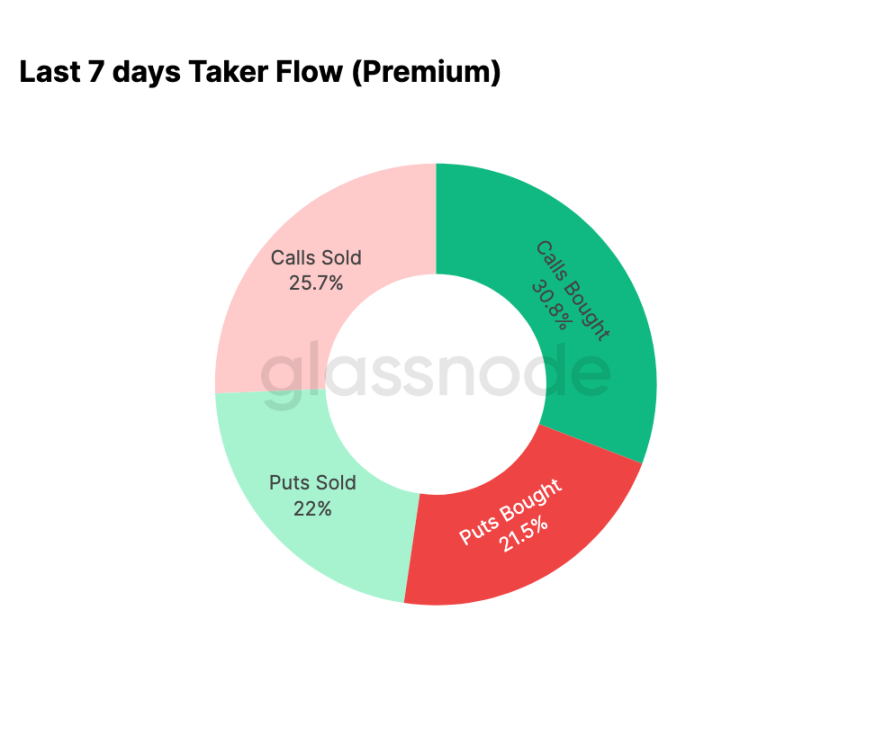
New Year Options Trading Preference is Bullish
Fund flow data corroborates the trend reflected in the skew. Since the beginning of the year, options market activity has shifted from systematically selling call options (betting on declining volatility) to actively buying call options (betting on price increases or heightened volatility).
In the past seven days, call option buying accounted for 30.8% of total options activity. The rise in call demand has also attracted the participation of volatility sellers, who are selling call options (accounting for 25.7% of total activity) to capture higher premium income.
Put direction trades accounted for 43.5% of total trading volume, which is relatively moderate in the context of recent price increases. This aligns with the performance of the skew tending towards balance, reflecting a reduced demand for immediate downside protection.
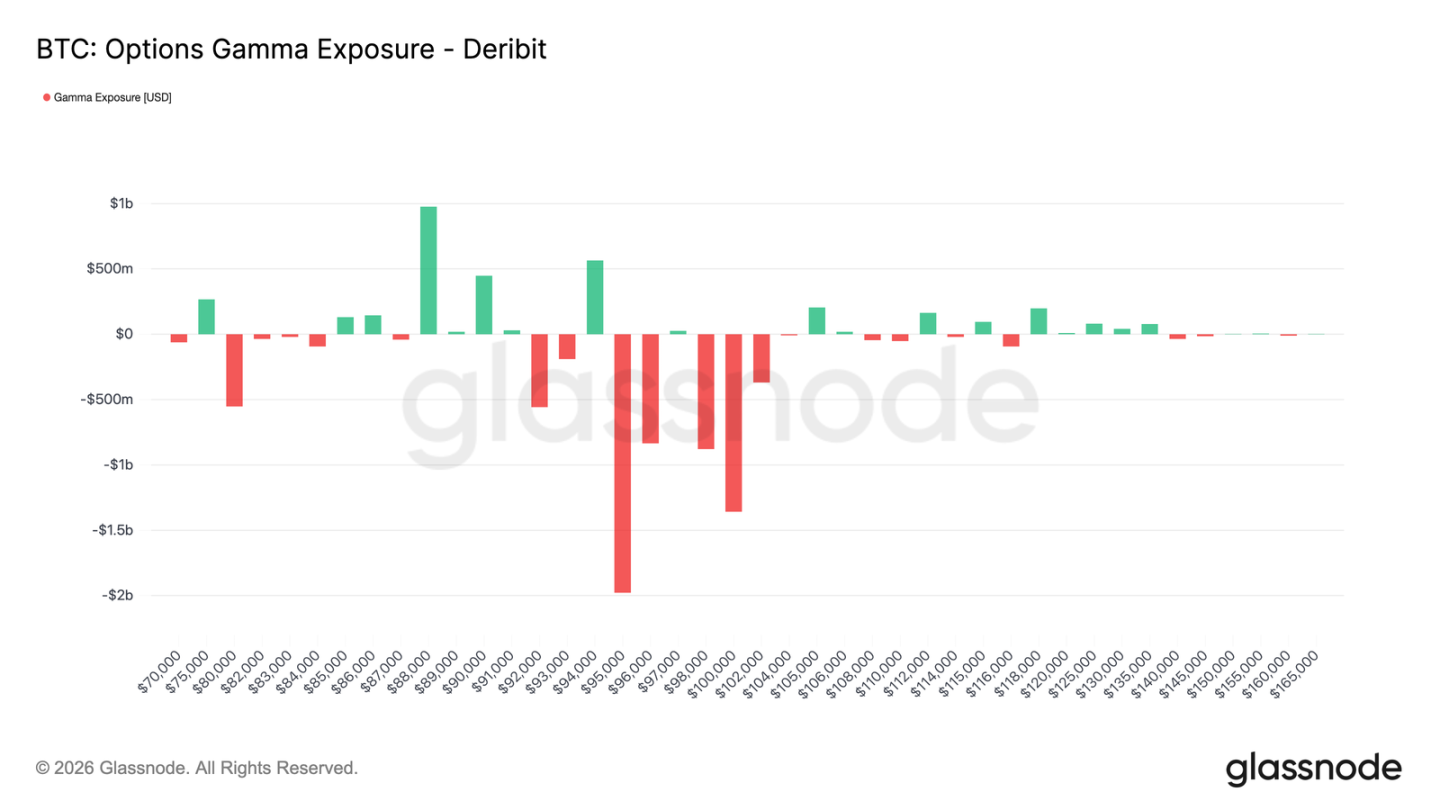
Market Makers Turn Negative in Key Range
With the active trading of call options since the beginning of the year, market maker positions have also adjusted accordingly. Currently, in the $95,000 to $104,000 range, market makers hold a net short position.
Within this range, when prices rise, market makers need to buy spot or perpetual contracts to hedge their risks, and this passive operation will create a boosting effect when the market strengthens, contrasting sharply with the positive environment that suppressed volatility at the end of last year.
In the first quarter expiration contracts, traders concentrated on buying call options in the $95,000 to $100,000 range, further confirming the shift in the market's risk expression. The current structure of market maker positions means that their hedging behavior no longer suppresses price volatility in this range and may even amplify upward momentum.
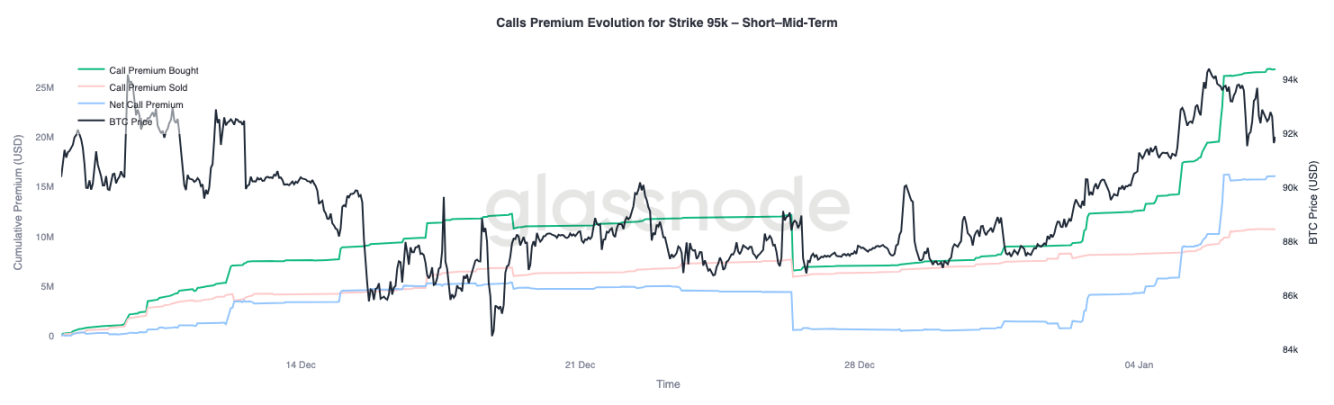
$95,000 Call Option Premium Shows Patience
The performance of the call option premium at the $95,000 strike price can serve as an effective indicator for observing changes in market sentiment. On January 1, when the spot price was still around $87,000, the buying of call option premiums at this strike price began to accelerate and continued to increase as the price climbed to a recent high of $94,400.
Subsequently, while the premium buying has leveled off, there has not been a significant pullback. More importantly, this process has not been accompanied by a substantial increase in the selling of call option premiums.
This indicates that profit-taking behavior is limited. Since the recent high, the volume of call option selling has only risen moderately, suggesting that most holders of long positions choose to continue holding rather than rush to lock in profits.
Overall, the behavior of option premiums around the $95,000 strike price reflects the patience and confidence of bullish participants.
Summary
As Bitcoin enters the new year, it has significantly cleaned up historical positions in the spot, futures, and options markets. The deleveraging at the end of 2025 and the year-end options expiration event have effectively removed the structural constraints the market previously faced, leaving a cleaner environment with clearer signals.
Currently, early signs of renewed market participation are emerging: ETF fund flows are stabilizing and rebounding, futures market activity is being rebuilt, and the options market is clearly shifting towards bullish positioning—skew returning to normal, volatility bottoming out, and market makers turning negative in key upper ranges.
These dynamics collectively indicate that the market is gradually shifting from a defensive selling-dominated mode to a phase of selectively increasing risk exposure and rebuilding participation. Although structural buying power still needs to strengthen, the release of historical position pressure and the re-accumulation of bullish sentiment mean that Bitcoin is starting 2026 with a lighter step, improving the internal market structure and providing more possibilities for future expansion.
免责声明:本文章仅代表作者个人观点,不代表本平台的立场和观点。本文章仅供信息分享,不构成对任何人的任何投资建议。用户与作者之间的任何争议,与本平台无关。如网页中刊载的文章或图片涉及侵权,请提供相关的权利证明和身份证明发送邮件到support@aicoin.com,本平台相关工作人员将会进行核查。


