The daily chart reads like the end of a sprint—bitcoin charged from $84,398 to $94,792 before abruptly losing steam. The recent three-day pullback has brought the price back down to a holding pattern around $91,000. Notably, declining volume during this retreat was unusually high, a textbook sign of bearish pressure despite a relatively small-bodied daily candle.
That candle, caught between hesitation and exhaustion, suggests a classic moment of indecision. Traders watching this frame will need to see a strong close above $92,000—ideally with volume riding shotgun—before entertaining another test of the $94,000 to $95,000 resistance ceiling.
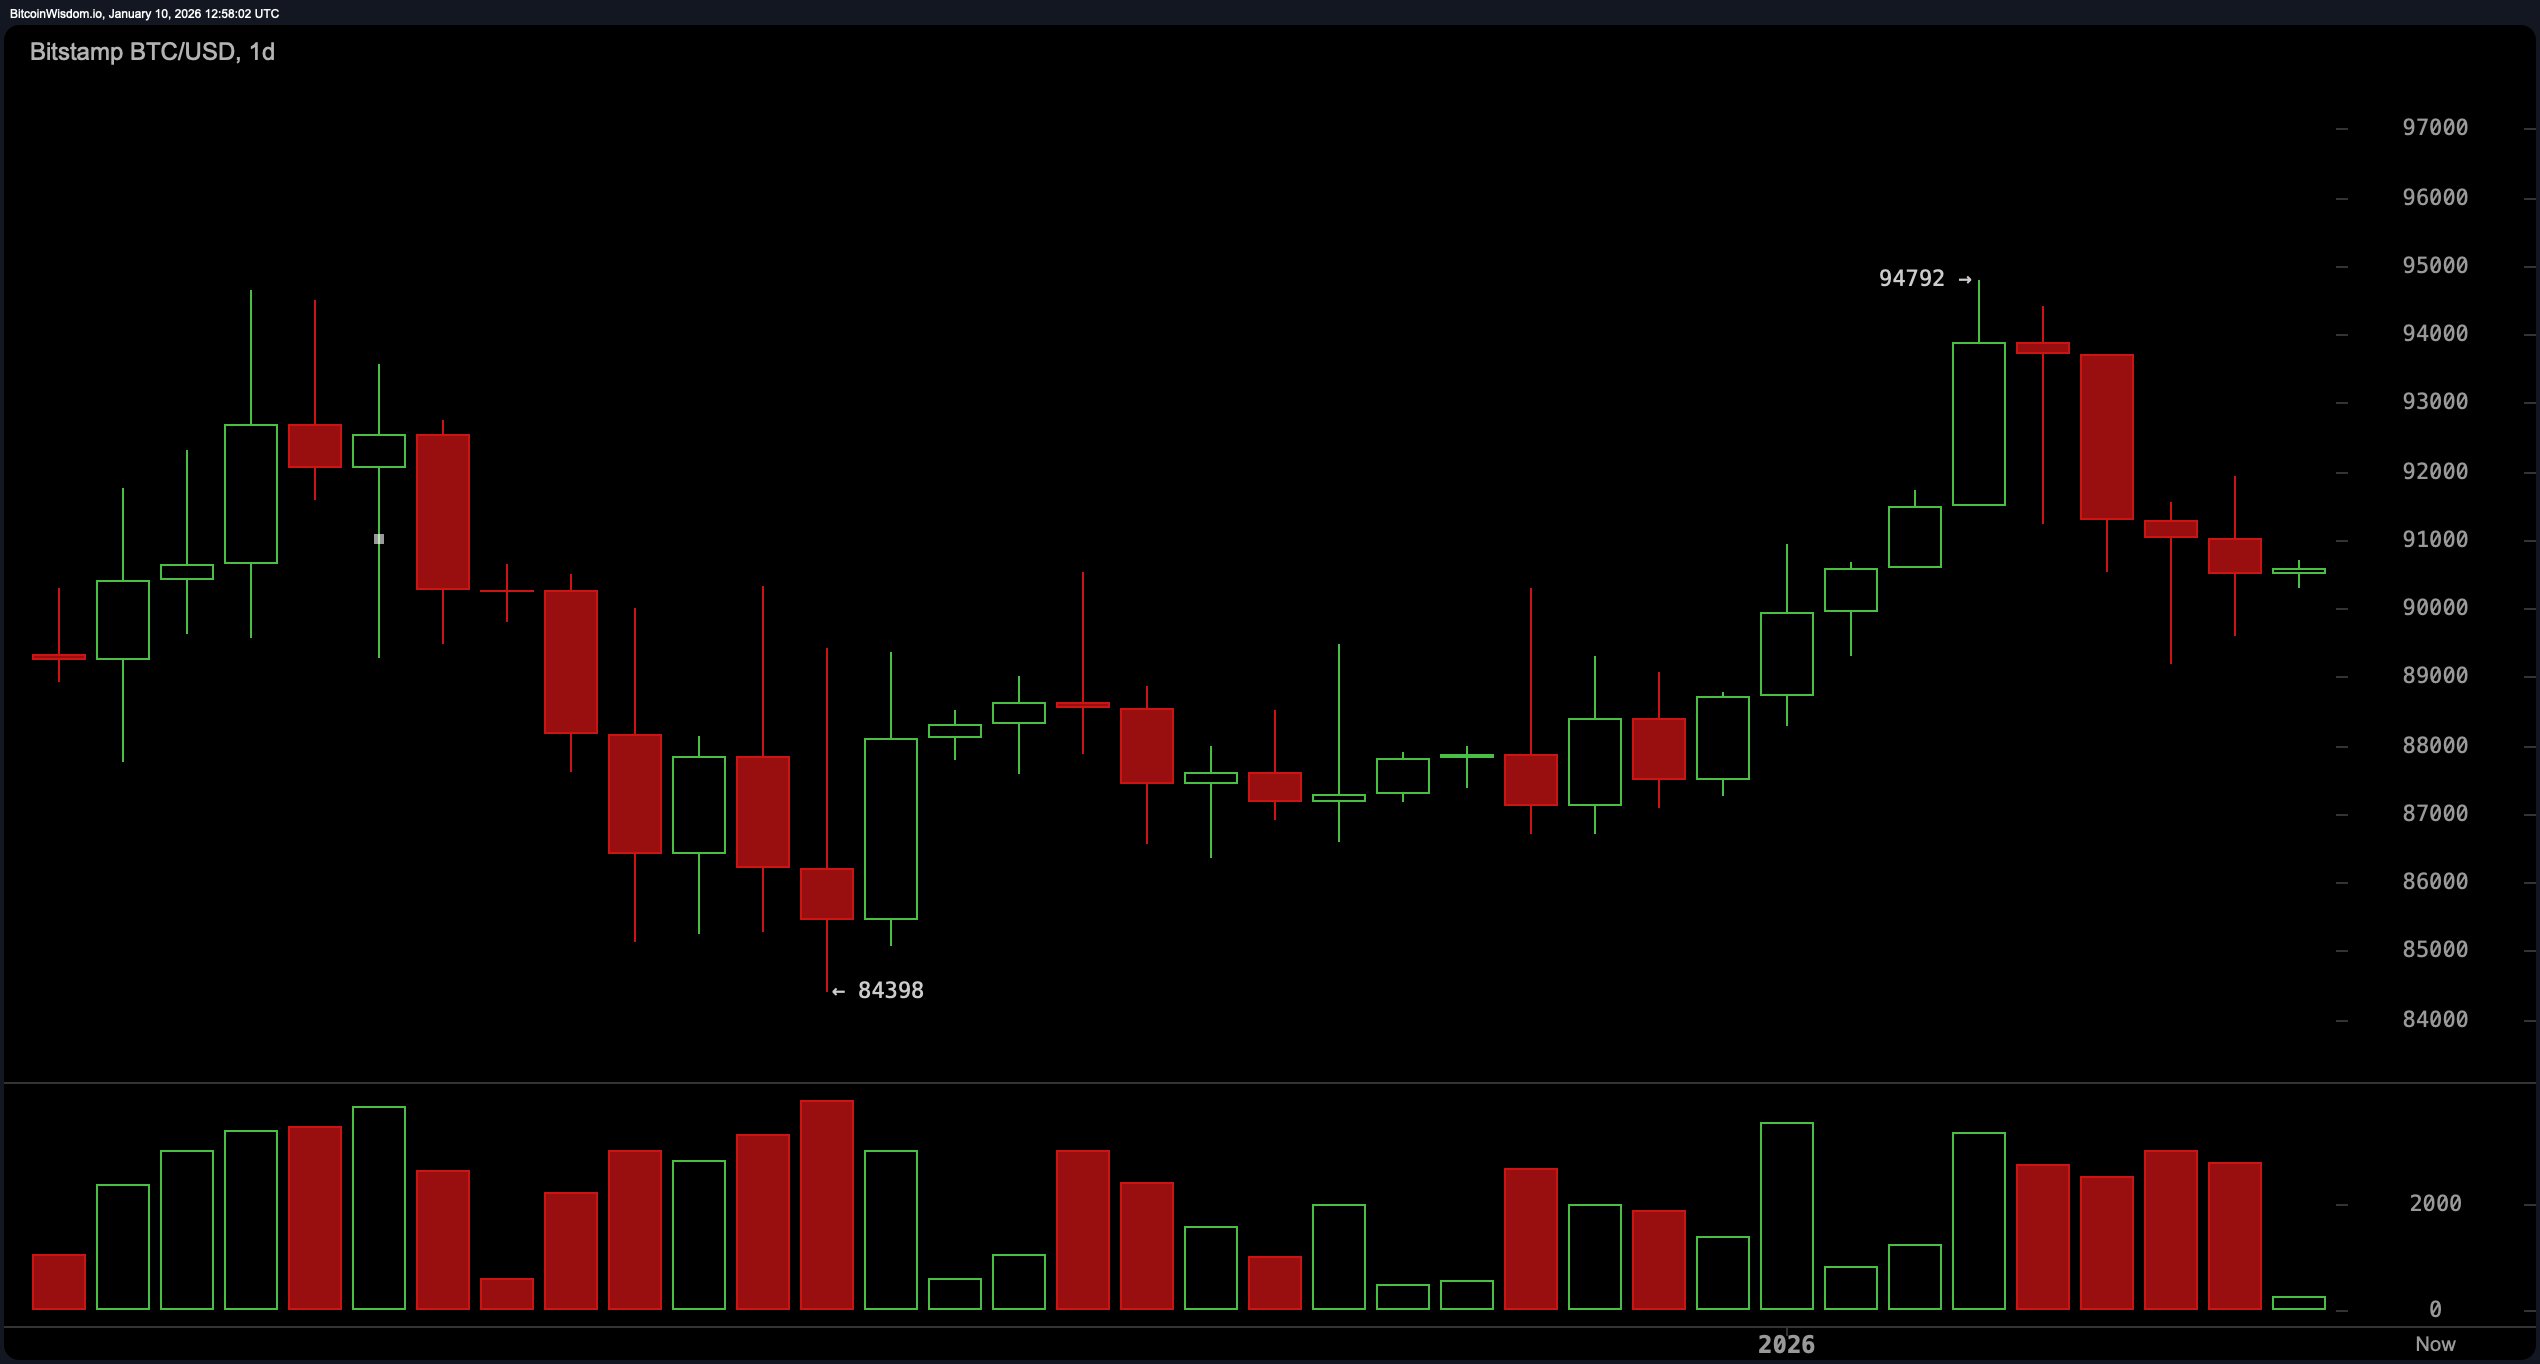
BTC/USD 1-day chart via Bitstamp on Jan. 10, 2026.
Zoom into the 4-hour chart, and the optimism starts to peel away. Bitcoin has been drifting sideways in the $90,000 to $91,000 pocket, with price structure hinting at a potential bear flag—a consolidation after a drop, not a party invitation. Volume on green candles has been underwhelming, signaling that buyer enthusiasm is either missing or terribly miscalculated. A decisive breakdown below $90,000 could open the door to a re-test of the $88,500 to $89,000 support zone, especially if volume supports the fall.
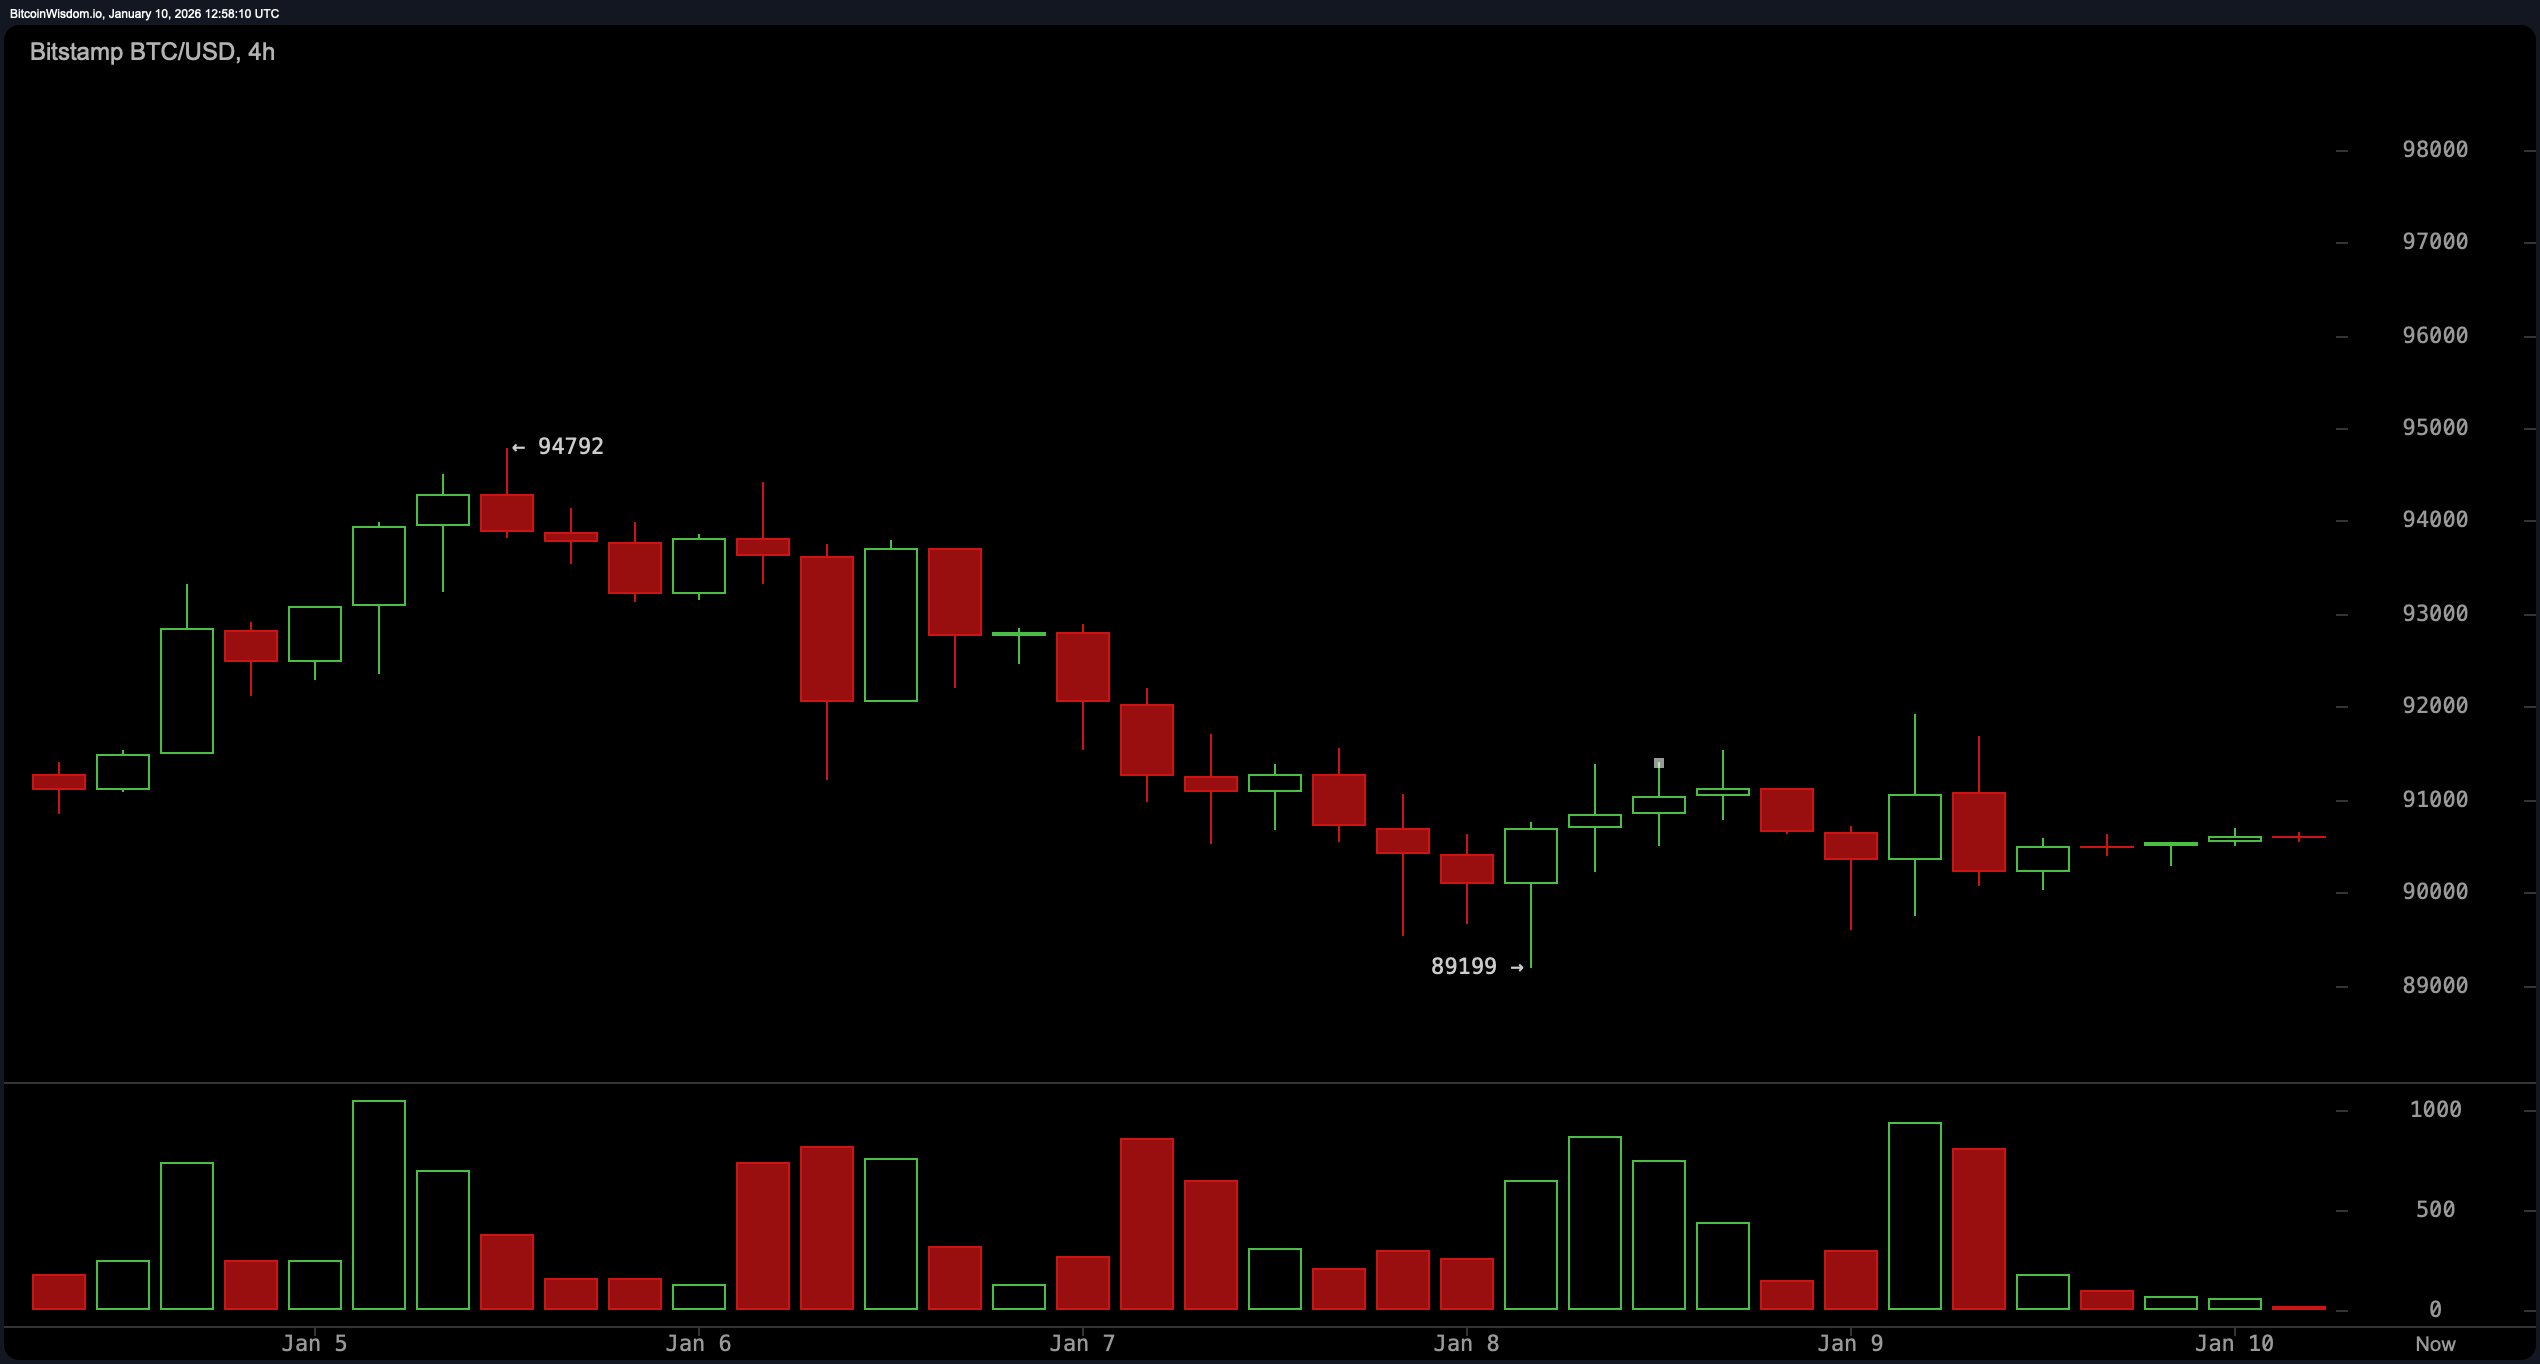
BTC/USD 4-hour chart via Bitstamp on Jan. 10, 2026.
The 1-hour chart tells the story of a market stuck in a revolving door. Bitcoin is still rangebound between $90,500 and $91,500, with intraday attempts at breakout swiftly rejected, including a failed push to $91,924. Volume here is equally lifeless, and volatility has taken a smoke break. This environment suits only the nimblest of scalpers, with micro-opportunities lurking between known support and resistance levels—but the lack of conviction makes overstaying any trade a costly gamble.
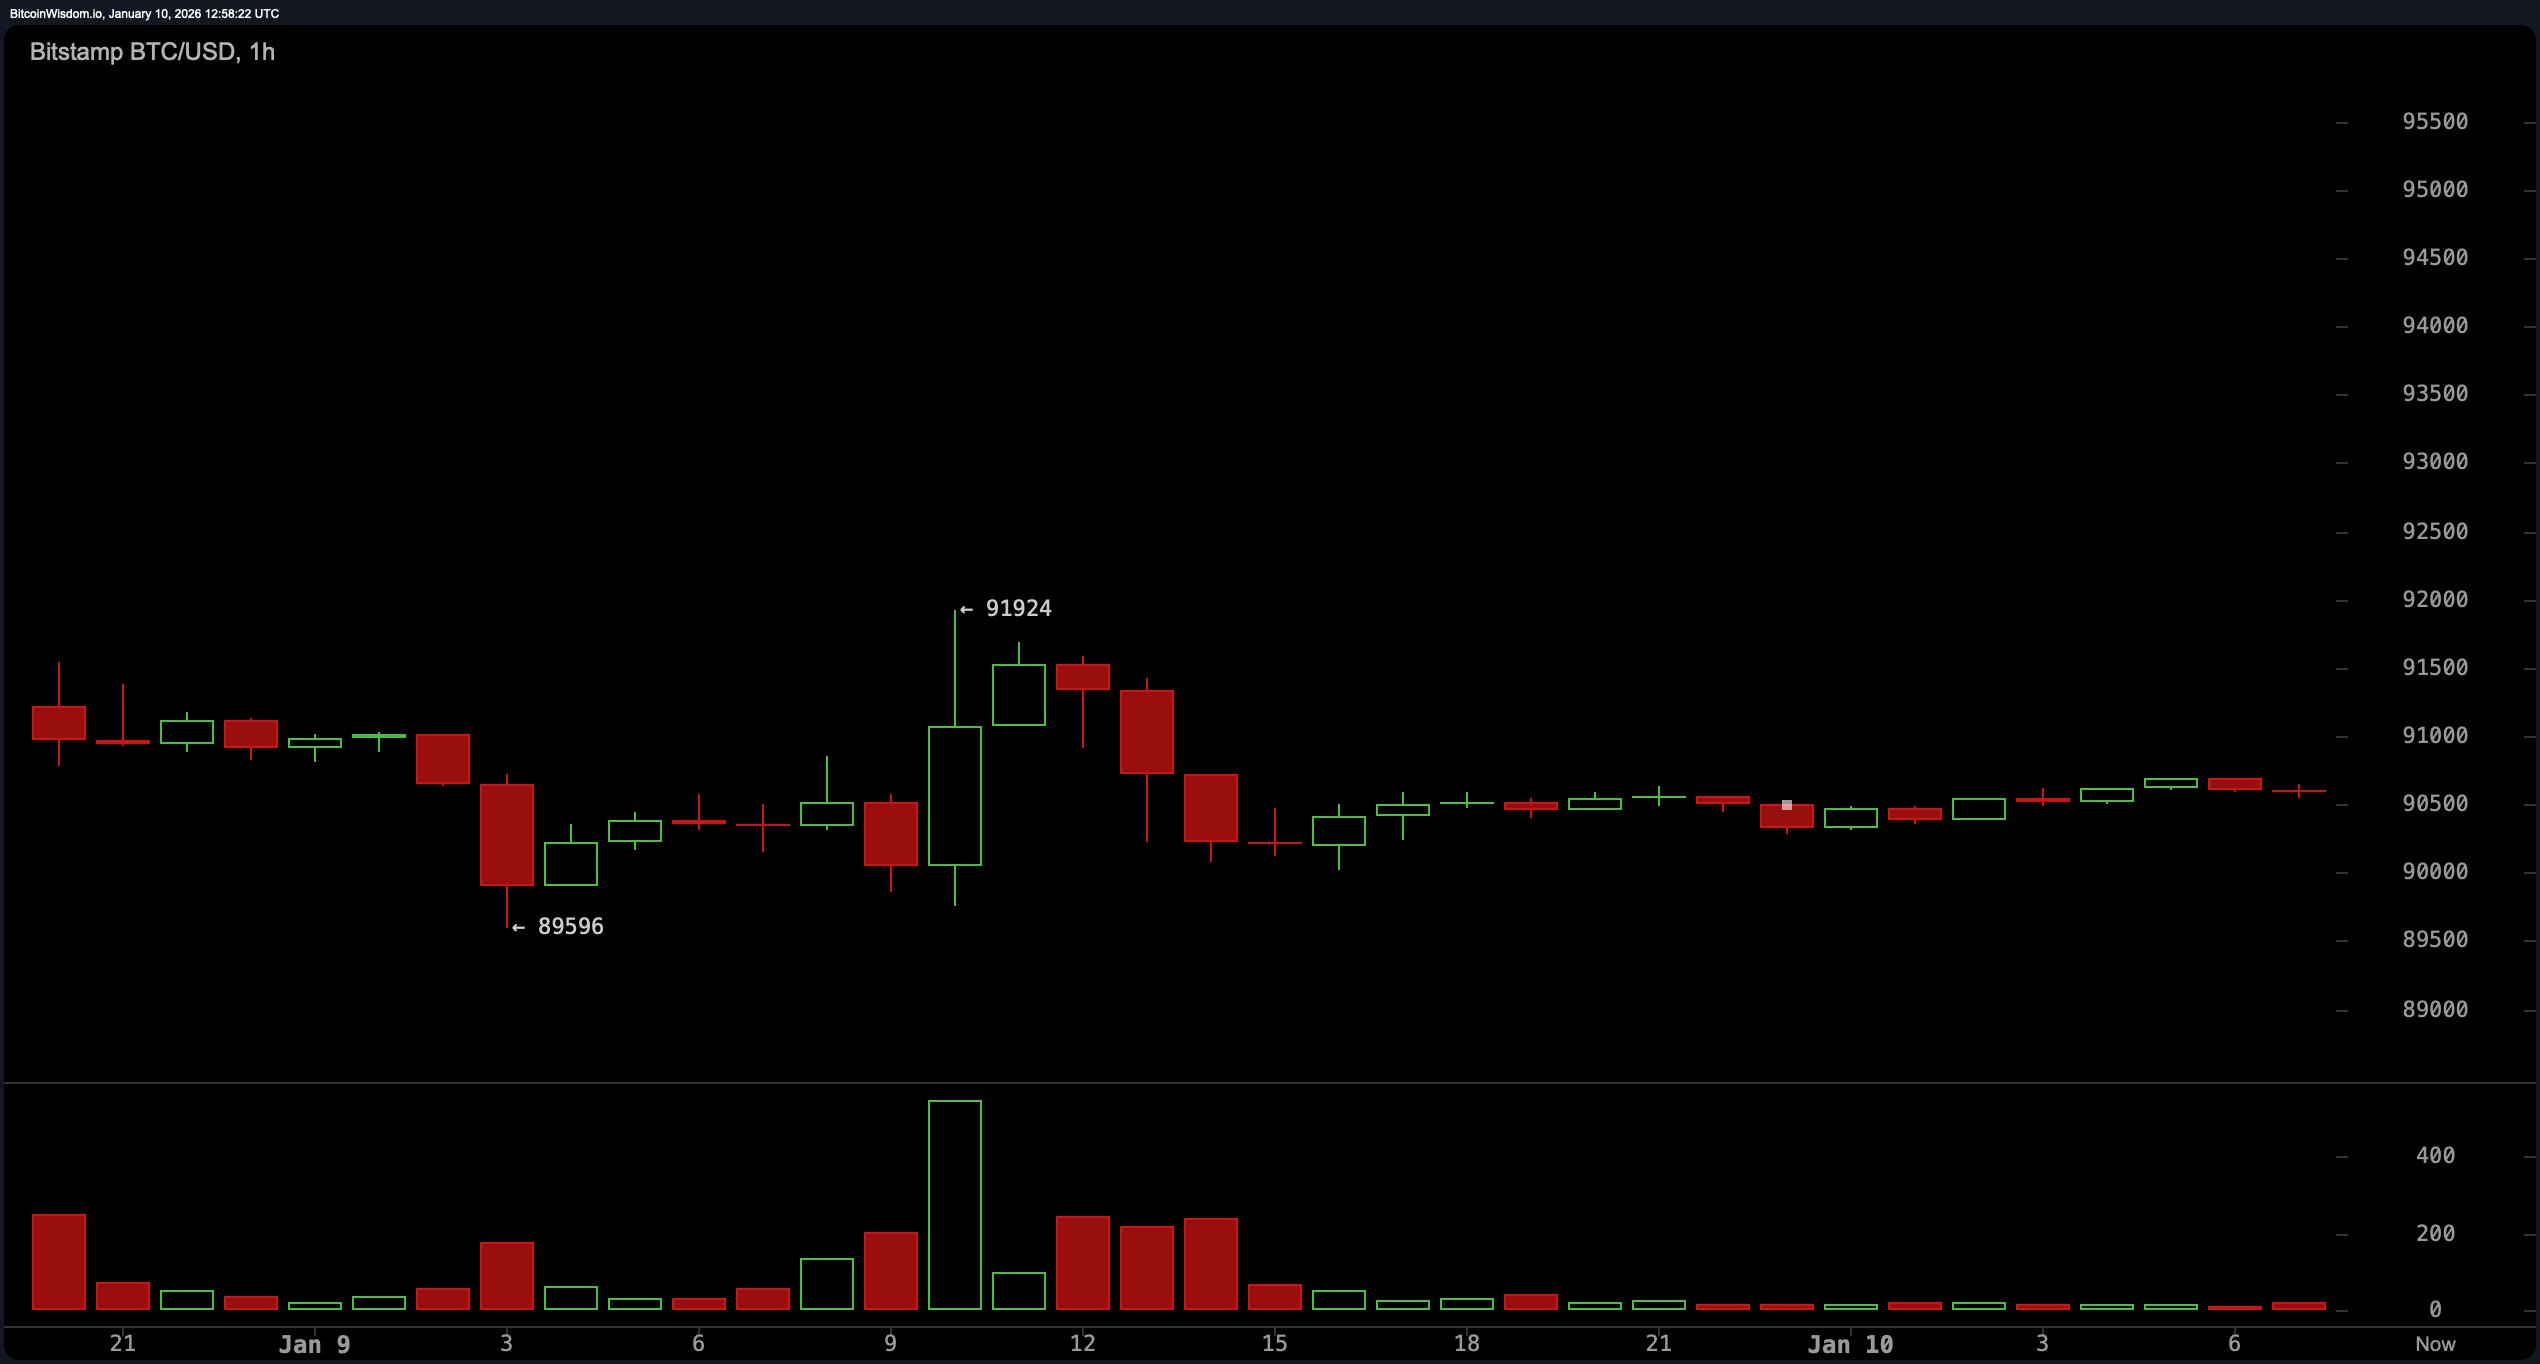
BTC/USD 1-hour chart via Bitstamp on Jan. 10, 2026.
Oscillator readings echo this ambivalence. The relative strength index ( RSI) at 52, Stochastic at 50, and commodity channel index (CCI) at 45 all flash neutral. The average directional index (ADX) confirms a lack of trend strength at 24, while the Awesome oscillator meanders near 1,941 with no clear signal. The momentum indicator at 3,101 and the moving average convergence divergence ( MACD) level at 509 are the lone voices leaning bullish, but without confirmation from other indicators, they feel more like hope than certainty.
As for moving averages (MAs), it’s a tug-of-war across the board. Short- and mid-term exponential moving averages (EMA) and simple moving averages (SMA) split between favoring upward and downward trends: the 10-day EMA and SMA are both flashing red, while the 20-day and 30-day averages lean green. Longer-term indicators are decisively bearish—the 100-day and 200-day EMAs and SMAs are all deep in red territory, suggesting the macro trend is still cooling off despite near-term stabilization. It’s a sideways shuffle, and until bitcoin clears $92,000 or cracks below $90,000, the charts are calling for patience, not predictions.
Bull Verdict:
If bitcoin can reclaim $92,000 with conviction and volume, short-term momentum could return, setting up a path toward retesting the $94,000 to $95,000 range. Support from mid-term moving averages and bullish signals from the momentum indicator and moving average convergence divergence ( MACD) offer some tailwinds—assuming the bulls can stay awake.
Bear Verdict:
With price action stuck beneath key resistance and a potential bear flag brewing on the 4-hour chart, bitcoin risks slipping below the $90,000 mark. Weak volume on upticks and bearish pressure from long-term moving averages suggest the recent uptrend is cooling off—and downside toward $88,500 may be back on the menu.
- What is bitcoin’s current price?
As of 8:45 a.m. Eastern time, Saturday, Jan. 10, 2026, bitcoin is priced at $90,617. - Is bitcoin in an uptrend or downtrend?
Bitcoin is currently consolidating after a recent uptrend, showing signs of short-term indecision. - What is bitcoin’s trading range today?
The 24-hour price band is between $89,596 and $91,924. - What are key bitcoin support and resistance levels?
Support sits near $90,000, while resistance stands around $92,000 to $95,000.
免责声明:本文章仅代表作者个人观点,不代表本平台的立场和观点。本文章仅供信息分享,不构成对任何人的任何投资建议。用户与作者之间的任何争议,与本平台无关。如网页中刊载的文章或图片涉及侵权,请提供相关的权利证明和身份证明发送邮件到support@aicoin.com,本平台相关工作人员将会进行核查。


